| Param | Original file | Final file |
|---|---|---|
| Filename | modeM0/AS1T04_071T01_9000004782_33333cztM0_level2.evt | modeM0/AS1T04_071T01_9000004782_33333cztM0_level2_quad_clean.evt |
| Size (bytes) | 527,448,960 | 58,222,080 |
| Size | 503.0 MB | 55.5 MB |
| Events in quadrant A | 2,511,024 | 364,766 |
| Events in quadrant B | 3,991,804 | 343,516 |
| Events in quadrant C | 3,693,623 | 352,232 |
| Events in quadrant D | 5,418,006 | 330,136 |
| Mode M0 | |||
|---|---|---|---|
| Quadrant | BADHDUFLAG | Total packets | Discarded packets |
| A | 0 | 10738 | 3 |
| B | 0 | 15227 | 2 |
| C | 0 | 14558 | 2 |
| D | 0 | 19934 | 2 |
| Mode SS | |||
|---|---|---|---|
| Quadrant | BADHDUFLAG | Total packets | Discarded packets |
| A | 0 | 106 | 0 |
| B | 0 | 106 | 0 |
| C | 0 | 106 | 0 |
| D | 0 | 106 | 0 |
| Mode M9 | |||
|---|---|---|---|
| Quadrant | BADHDUFLAG | Total packets | Discarded packets |
| A | 0 | 26 | 0 |
| B | 0 | 26 | 0 |
| C | 0 | 26 | 0 |
| D | 0 | 27 | 0 |
| Quadrant | Total seconds | Saturated seconds | Saturation percentage |
|---|---|---|---|
| A | 5319 | 10 | 0.188005% |
| B | 5319 | 566 | 10.641098% |
| C | 5319 | 116 | 2.180861% |
| D | 5319 | 206 | 3.872908% |
Noise dominated data is calculated using 1-second bins in cleaned event files. If a bin has >2000 counts, and if more than 50% of those come from <1% of pixels, then it is considered to be noise-dominated and hence unusable.
| Quadrant | # 1 sec bins | Bins with >0 counts | Bins with >2000 counts | High rate bins dominated by noise | Noise dominated (total time) | Noise dominated (detector-on time) | Marked lightcurve |
|---|---|---|---|---|---|---|---|
| A | 7051 | 5320 | 0 | 0 | 0.00% | 0.00% | 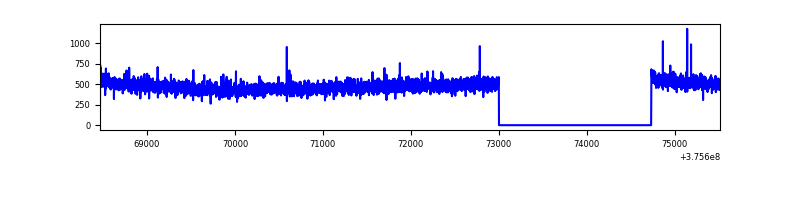 |
| B | 7051 | 5320 | 426 | 426 | 6.04% | 8.01% | 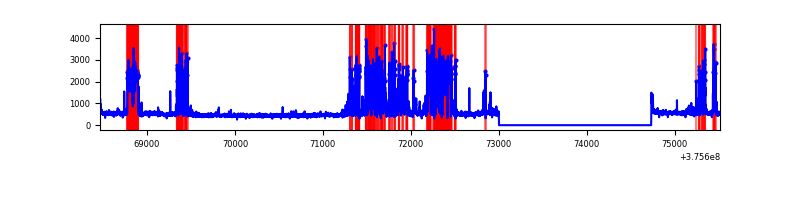 |
| C | 7051 | 5320 | 88 | 88 | 1.25% | 1.65% | 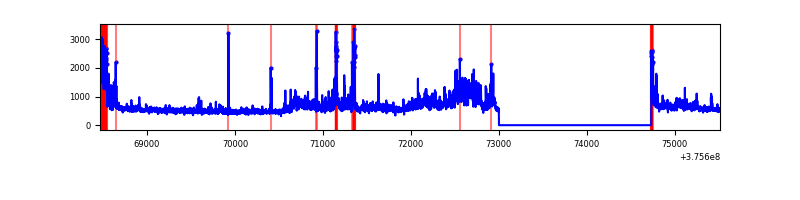 |
| D | 7051 | 5320 | 174 | 174 | 2.47% | 3.27% | 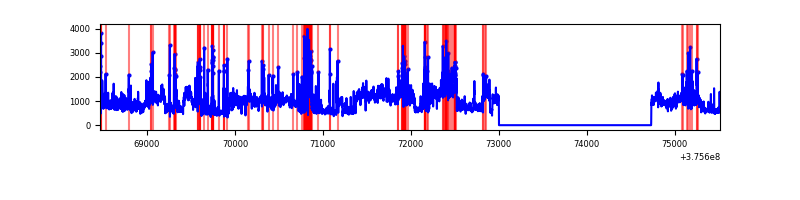 |
Top three noisy pixels from each quadrant. If the there are fewer than three noisy pixels in the level2.evt file, extra rows are filled as -1
| Pixel properties | Quadrant properties | ||||||
|---|---|---|---|---|---|---|---|
| Quadrant | DetID | PixID | Counts | Sigma | Mean | Median | Sigma |
| A | 13 | 6 | 7497 | 52.97 | 648 | 635 | 129.6 |
| A | 13 | 254 | 6374 | 44.3 | 648 | 635 | 129.6 |
| A | 3 | 137 | 6188 | 42.86 | 648 | 635 | 129.6 |
| B | 5 | 172 | 1186690 | 9966.76 | 614 | 599 | 119.0 |
| B | 0 | 219 | 233071 | 1953.47 | 614 | 599 | 119.0 |
| B | 15 | 85 | 84391 | 704.11 | 614 | 599 | 119.0 |
| C | 10 | 49 | 607798 | 4208.56 | 619 | 625 | 144.3 |
| C | 15 | 214 | 250138 | 1729.47 | 619 | 625 | 144.3 |
| C | 0 | 207 | 129348 | 892.23 | 619 | 625 | 144.3 |
| D | 8 | 195 | 2184217 | 14430.49 | 615 | 598 | 151.3 |
| D | 12 | 6 | 289844 | 1911.49 | 615 | 598 | 151.3 |
| D | 13 | 249 | 171645 | 1130.37 | 615 | 598 | 151.3 |
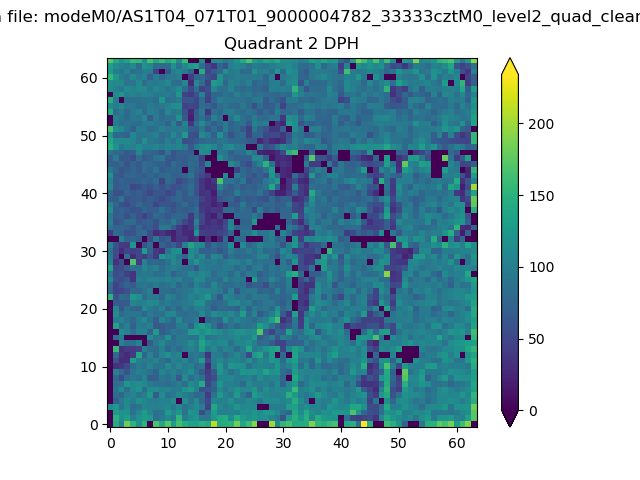
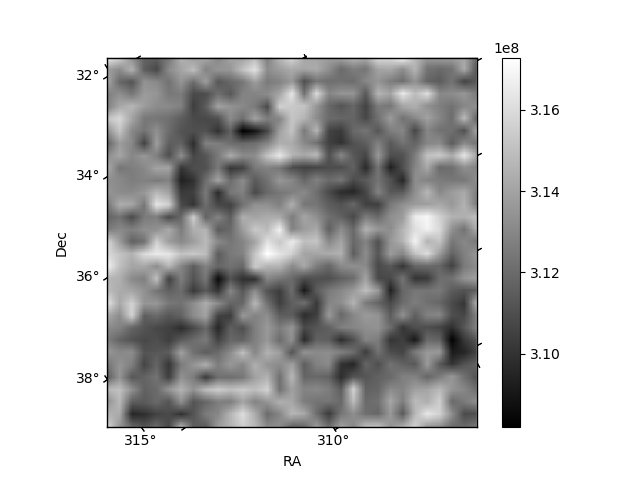
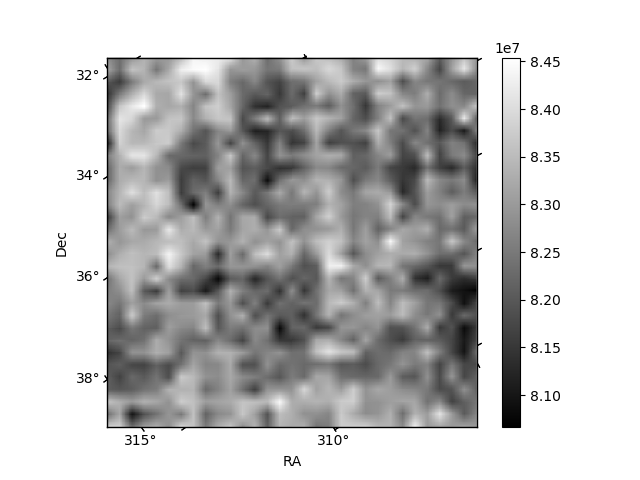
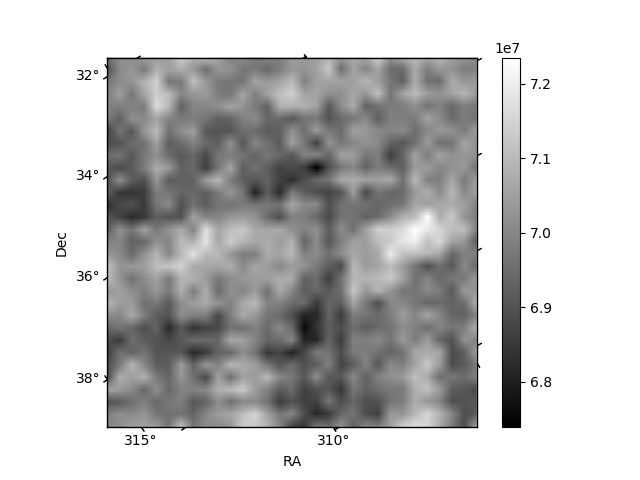
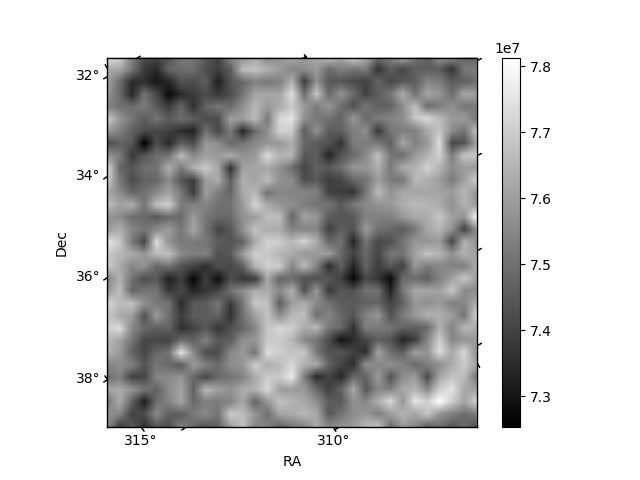
Histogram calculated using DETX and DETY for each event in the final _common_clean file
| Quadrant A | 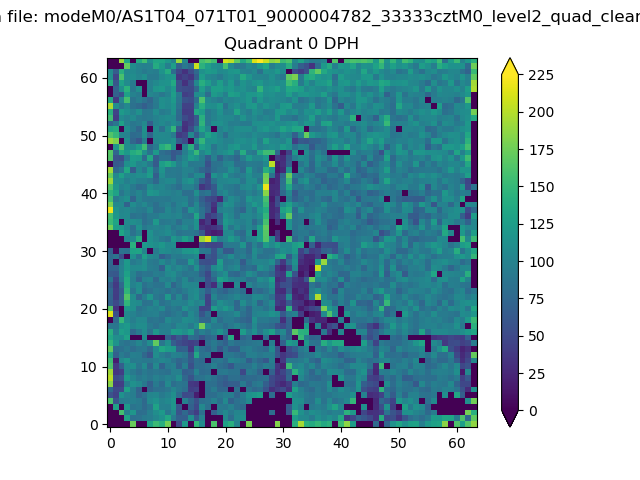 |
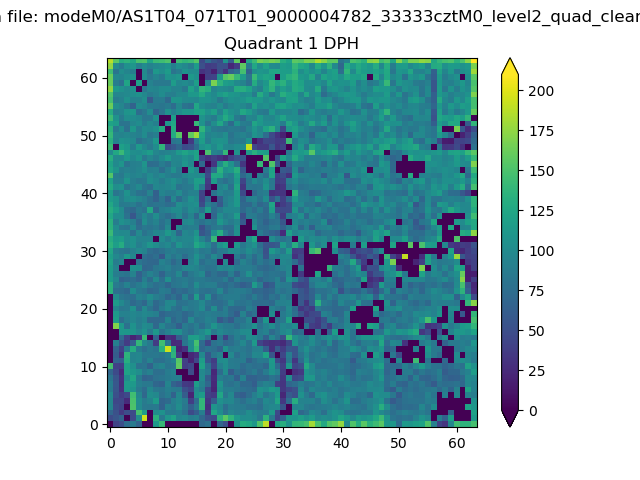 |
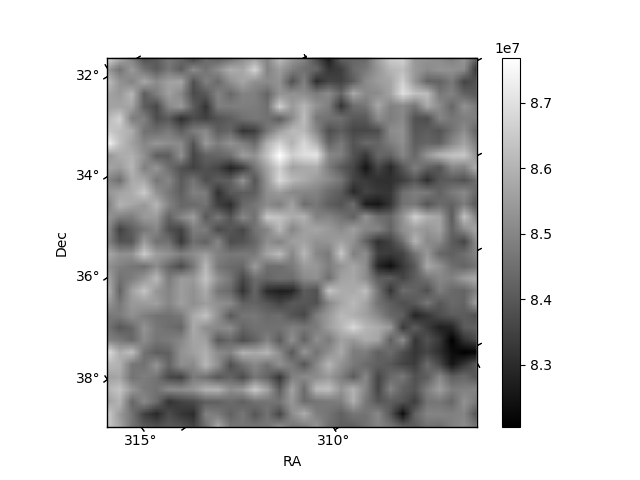
Quadrant B |
|---|---|---|---|
| Quadrant D | 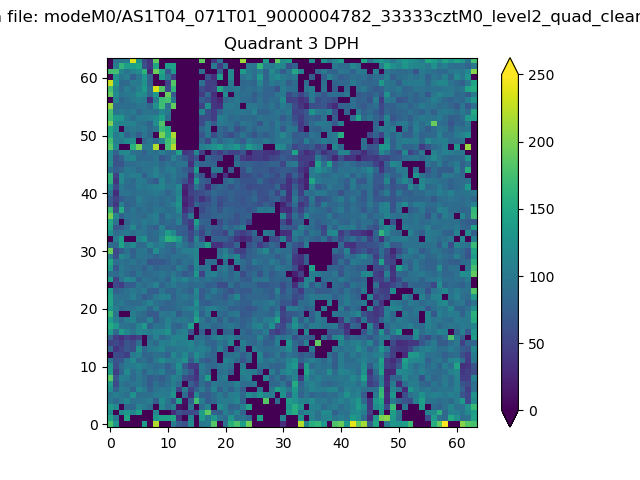 |
 |
Quadrant C |
| Plot type | Count rate plots | Images |
|---|---|---|
| Comparison with Poisson distribution Blue bars denote a histogram of data divided into 1 sec bins. Red curve is a Poisson curve with rate = median count rate of data. |
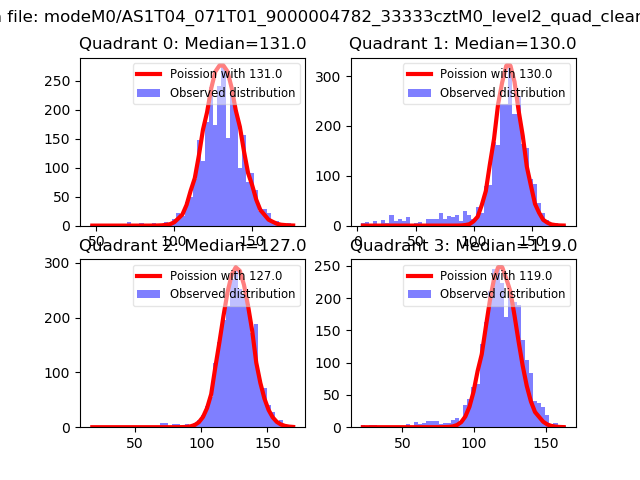 |
 |
| Quadrant-wise count rates Data is divided into 100 sec bins |
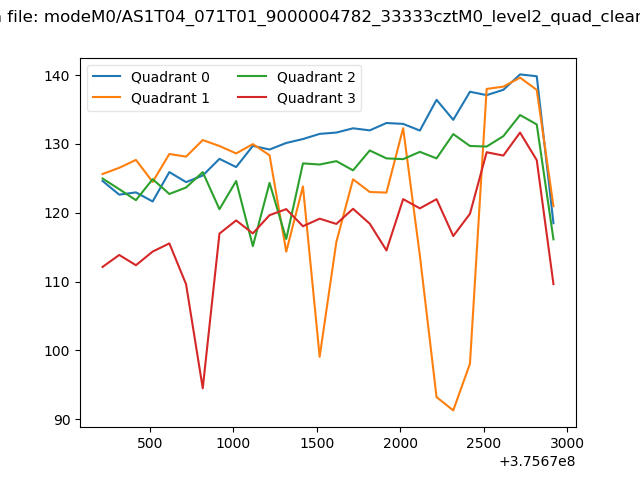 |
|
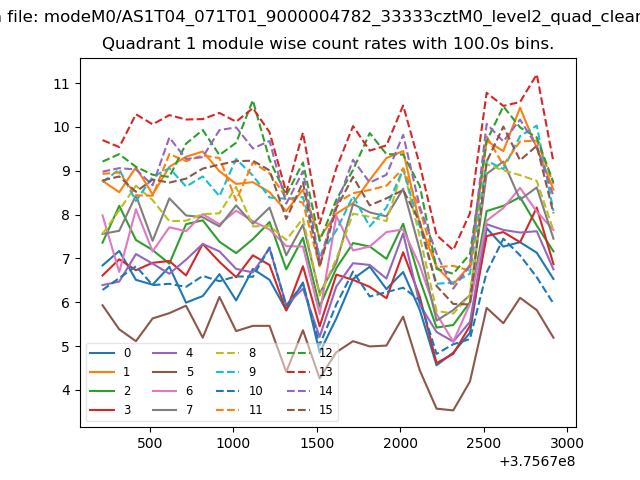
| Module-wise count rates for Quadrant A Data is divided into 100 sec bins |
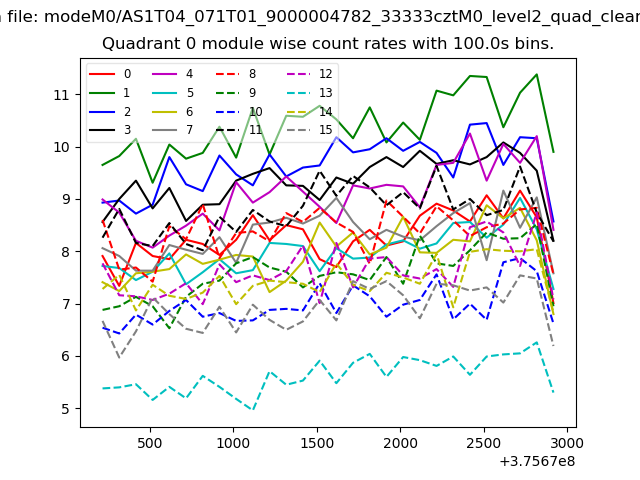 |
 |
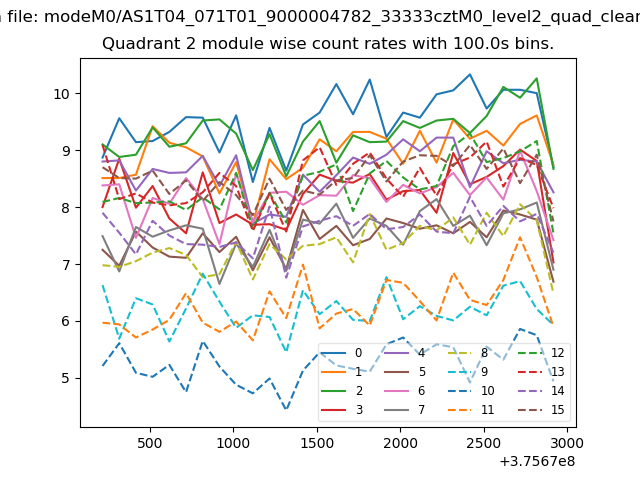
| Module-wise count rates for Quadrant B Data is divided into 100 sec bins |
 |
 |
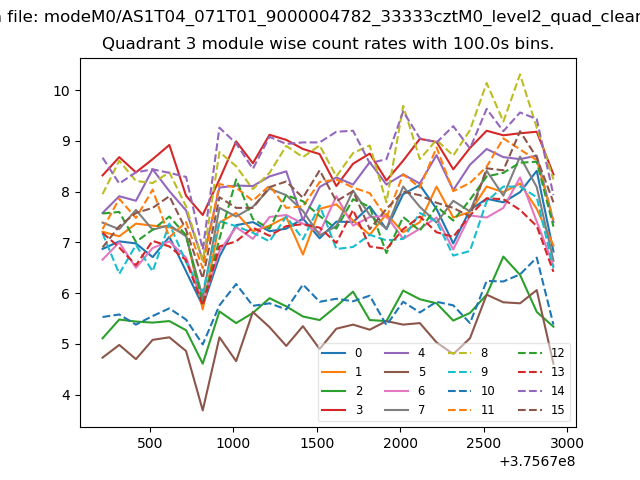
| Module-wise count rates for Quadrant C Data is divided into 100 sec bins |
 |
 |
| Module-wise count rates for Quadrant D Data is divided into 100 sec bins |
 |
 |
| Parameter | Plot |
|---|---|
| CZT HV Monitor | 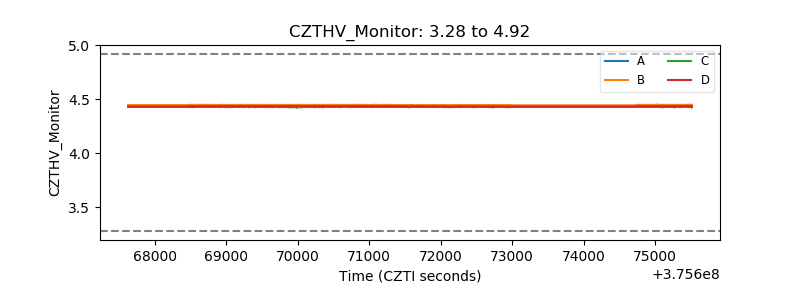 |
| D_VDD | 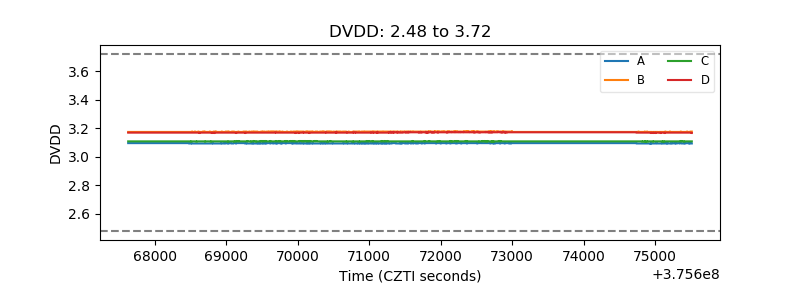 |
| Temperature 1 |  |
| Veto HV Monitor | 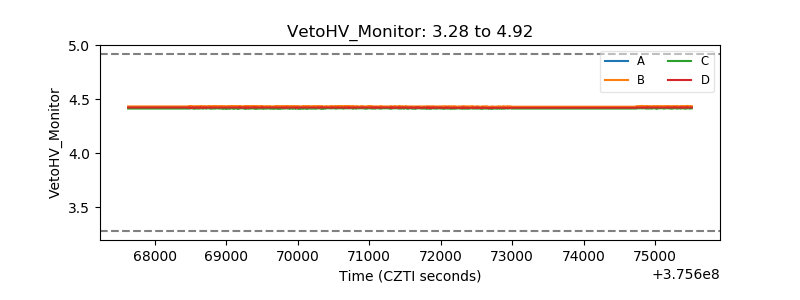 |
| Veto LLD | 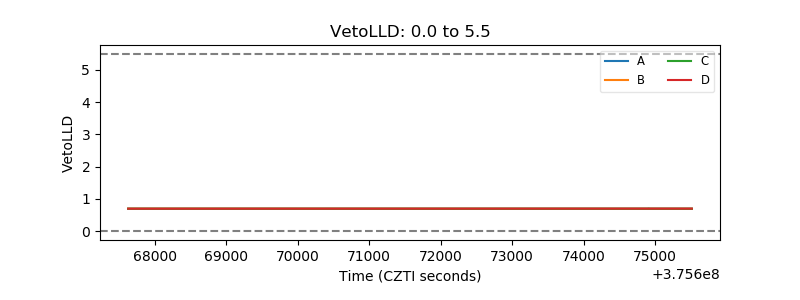 |
| Alpha Counter | 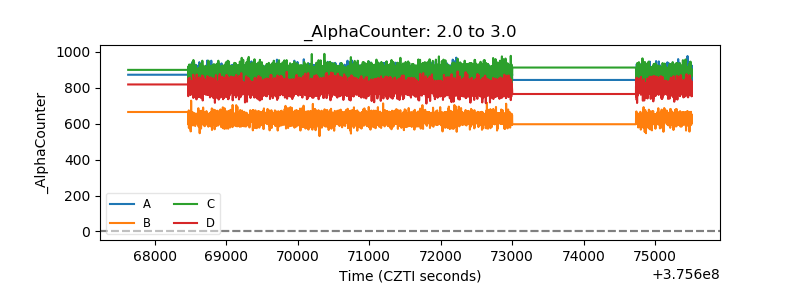 |
| _CPM_Rate |  |
| CZT Counter | 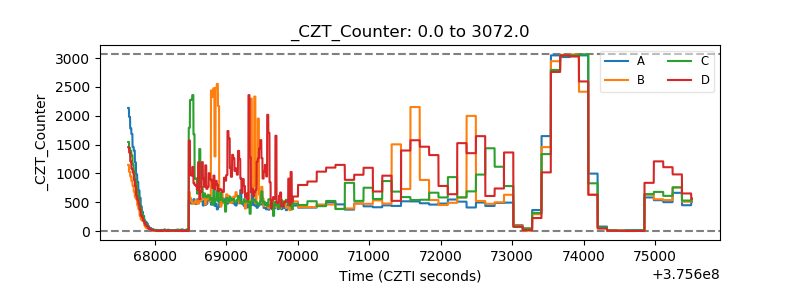 |
| +2.5 Volts monitor |  |
| +5 Volts monitor |  |
| _ROLL_ROT | 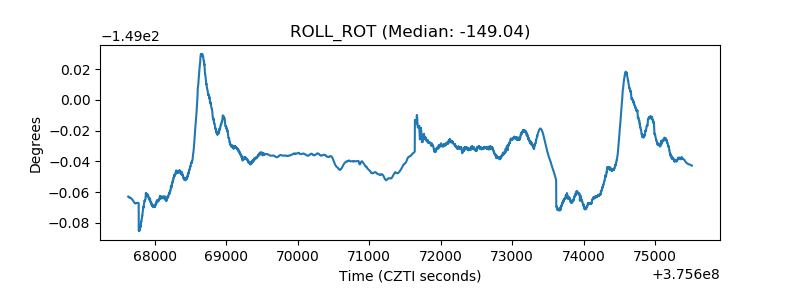 |
| _Roll_DEC | 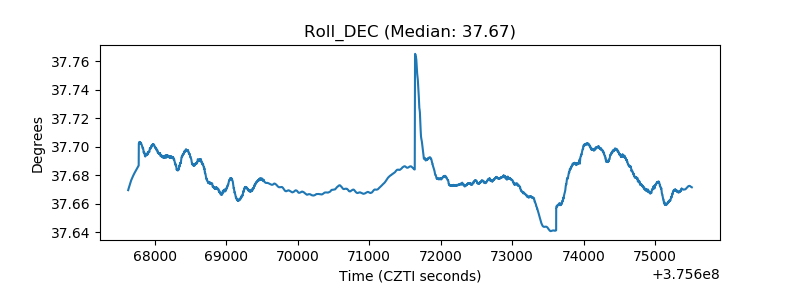 |
| _Roll_RA | 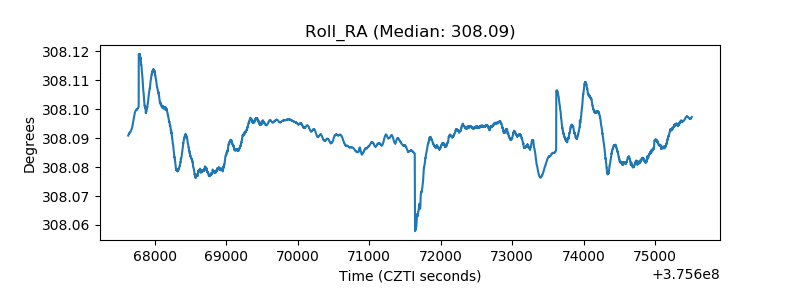 |
| Veto Counter | 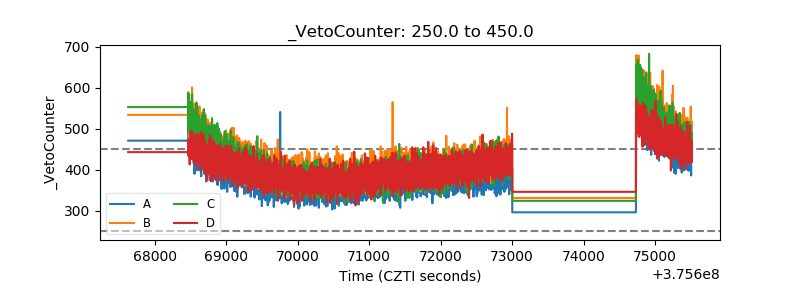 |