| Param | Original file | Final file |
|---|---|---|
| Filename | modeM0/AS1T04_071T01_9000004782_33334cztM0_level2.evt | modeM0/AS1T04_071T01_9000004782_33334cztM0_level2_quad_clean.evt |
| Size (bytes) | 370,143,360 | 54,717,120 |
| Size | 353.0 MB | 52.2 MB |
| Events in quadrant A | 1,915,655 | 358,059 |
| Events in quadrant B | 2,866,065 | 345,841 |
| Events in quadrant C | 2,650,005 | 347,382 |
| Events in quadrant D | 3,508,505 | 325,425 |
| Mode M0 | |||
|---|---|---|---|
| Quadrant | BADHDUFLAG | Total packets | Discarded packets |
| A | 0 | 8031 | 1 |
| B | 0 | 10978 | 1 |
| C | 0 | 10560 | 1 |
| D | 0 | 13164 | 1 |
| Mode SS | |||
|---|---|---|---|
| Quadrant | BADHDUFLAG | Total packets | Discarded packets |
| A | 0 | 78 | 0 |
| B | 0 | 78 | 0 |
| C | 0 | 78 | 0 |
| D | 0 | 78 | 0 |
| Mode M9 | |||
|---|---|---|---|
| Quadrant | BADHDUFLAG | Total packets | Discarded packets |
| A | 0 | 11 | 0 |
| B | 0 | 11 | 0 |
| C | 0 | 11 | 0 |
| D | 0 | 12 | 0 |
| Quadrant | Total seconds | Saturated seconds | Saturation percentage |
|---|---|---|---|
| A | 3971 | 10 | 0.251826% |
| B | 3971 | 301 | 7.579955% |
| C | 3971 | 32 | 0.805842% |
| D | 3971 | 101 | 2.543440% |
Noise dominated data is calculated using 1-second bins in cleaned event files. If a bin has >2000 counts, and if more than 50% of those come from <1% of pixels, then it is considered to be noise-dominated and hence unusable.
| Quadrant | # 1 sec bins | Bins with >0 counts | Bins with >2000 counts | High rate bins dominated by noise | Noise dominated (total time) | Noise dominated (detector-on time) | Marked lightcurve |
|---|---|---|---|---|---|---|---|
| A | 3971 | 3971 | 1 | 1 | 0.03% | 0.03% | 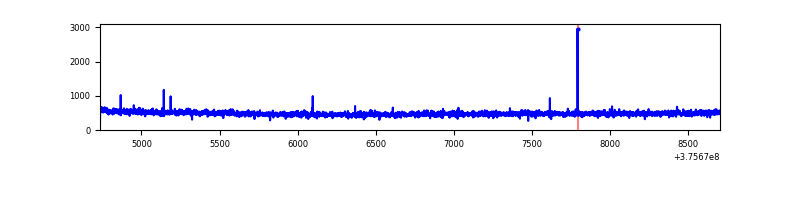 |
| B | 3971 | 3971 | 210 | 210 | 5.29% | 5.29% | 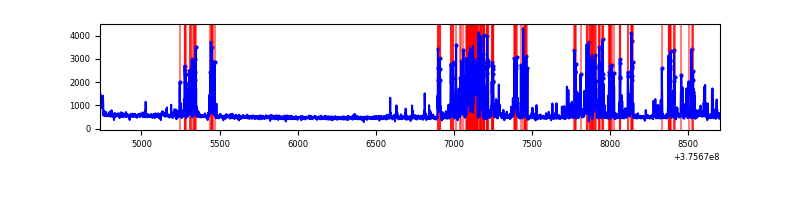 |
| C | 3971 | 3971 | 31 | 31 | 0.78% | 0.78% | 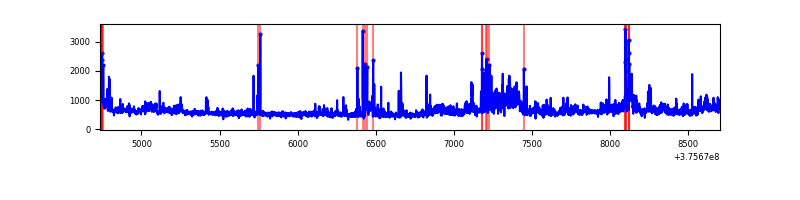 |
| D | 3971 | 3971 | 83 | 83 | 2.09% | 2.09% | 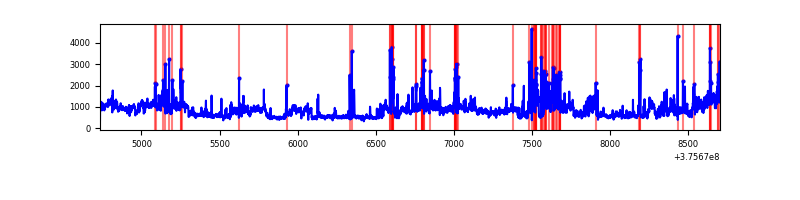 |
Top three noisy pixels from each quadrant. If the there are fewer than three noisy pixels in the level2.evt file, extra rows are filled as -1
| Pixel properties | Quadrant properties | ||||||
|---|---|---|---|---|---|---|---|
| Quadrant | DetID | PixID | Counts | Sigma | Mean | Median | Sigma |
| A | 15 | 169 | 8328 | 78.92 | 492 | 483 | 99.4 |
| A | 13 | 6 | 7323 | 68.81 | 492 | 483 | 99.4 |
| A | 13 | 254 | 5659 | 52.07 | 492 | 483 | 99.4 |
| B | 0 | 219 | 529815 | 5825.0 | 474 | 463 | 90.9 |
| B | 5 | 172 | 358860 | 3943.81 | 474 | 463 | 90.9 |
| B | 15 | 85 | 69794 | 762.92 | 474 | 463 | 90.9 |
| C | 10 | 49 | 399121 | 3693.5 | 467 | 472 | 107.9 |
| C | 15 | 214 | 184515 | 1705.17 | 467 | 472 | 107.9 |
| C | 15 | 208 | 67199 | 618.23 | 467 | 472 | 107.9 |
| D | 8 | 195 | 1083152 | 9482.78 | 465 | 452 | 114.2 |
| D | 2 | 250 | 261401 | 2285.51 | 465 | 452 | 114.2 |
| D | 12 | 6 | 107435 | 937.01 | 465 | 452 | 114.2 |
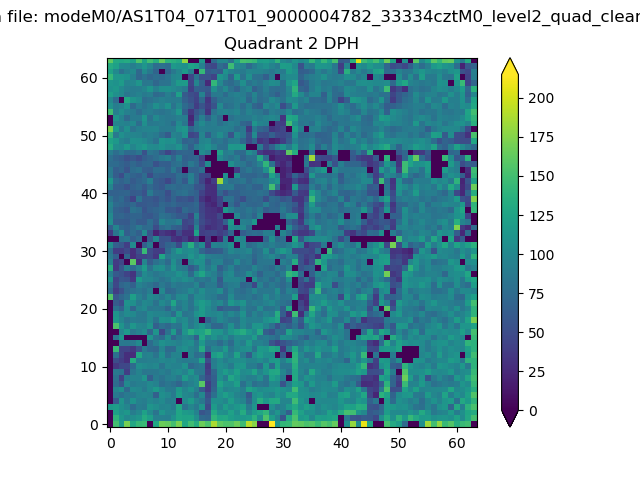
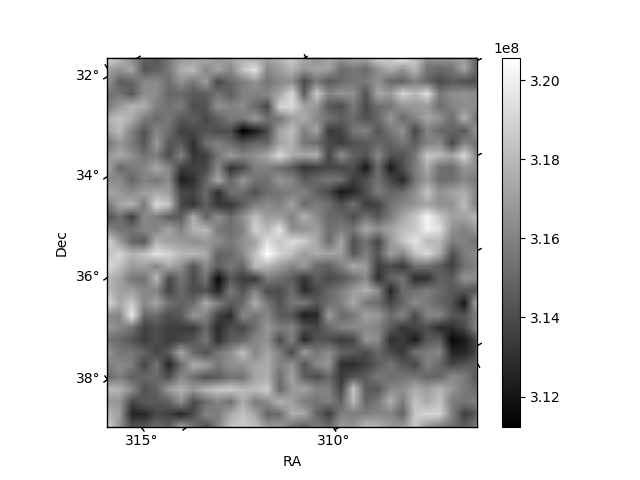
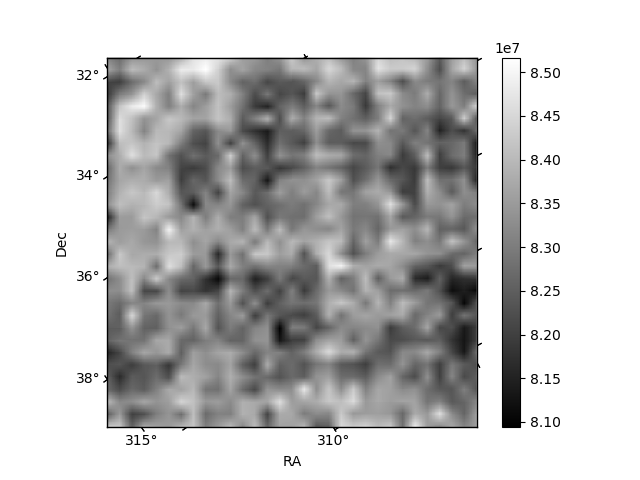
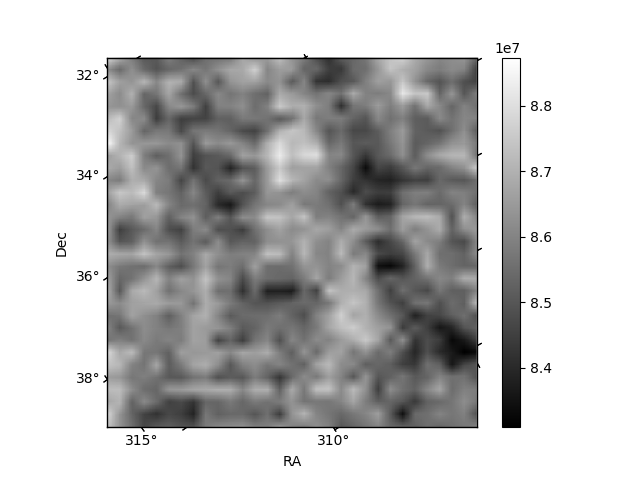
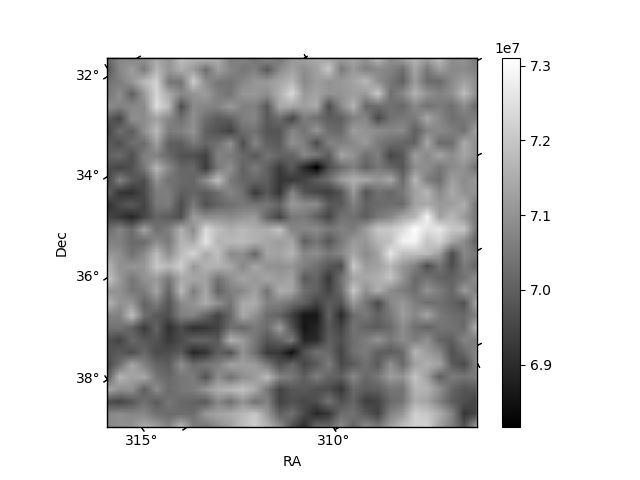
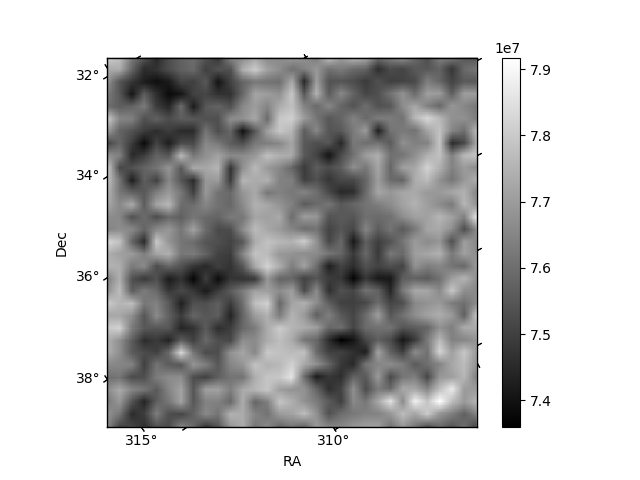
Histogram calculated using DETX and DETY for each event in the final _common_clean file
| Quadrant A | 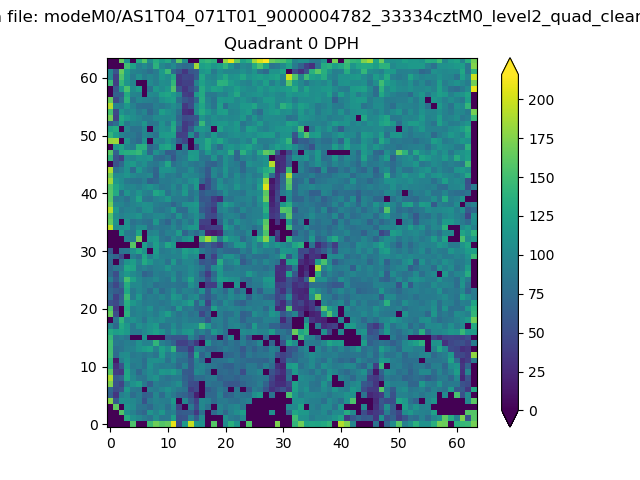 |
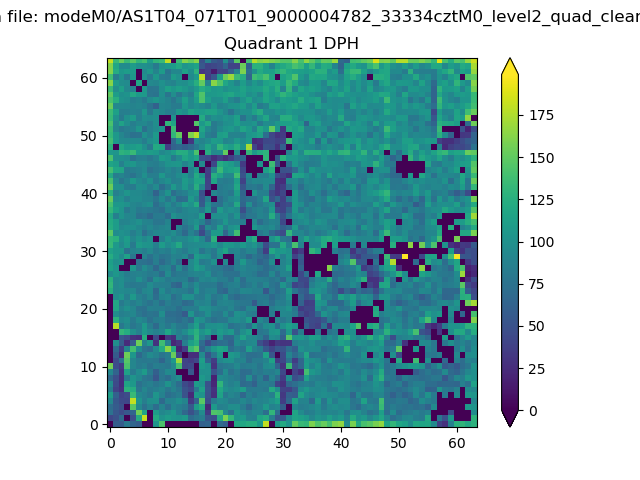 |
Quadrant B |
|---|---|---|---|
| Quadrant D | 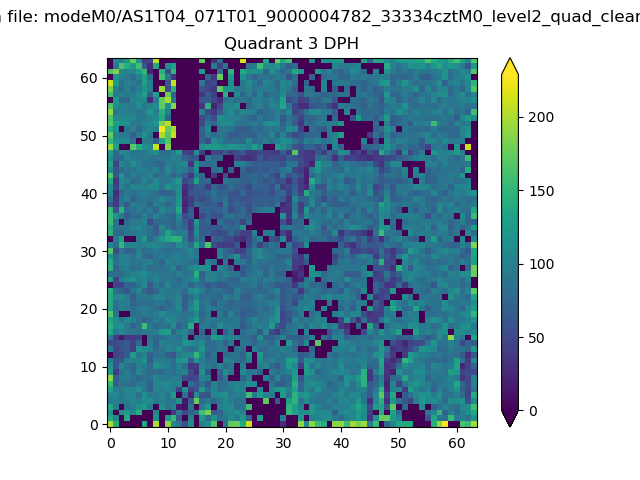 |
 |
Quadrant C |
| Plot type | Count rate plots | Images |
|---|---|---|
| Comparison with Poisson distribution Blue bars denote a histogram of data divided into 1 sec bins. Red curve is a Poisson curve with rate = median count rate of data. |
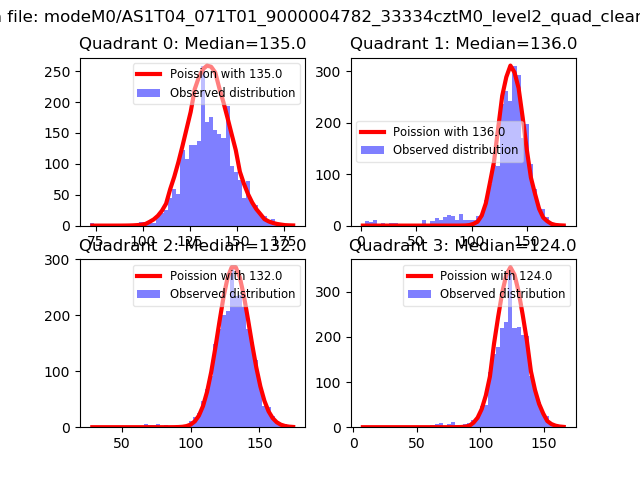 |
 |
| Quadrant-wise count rates Data is divided into 100 sec bins |
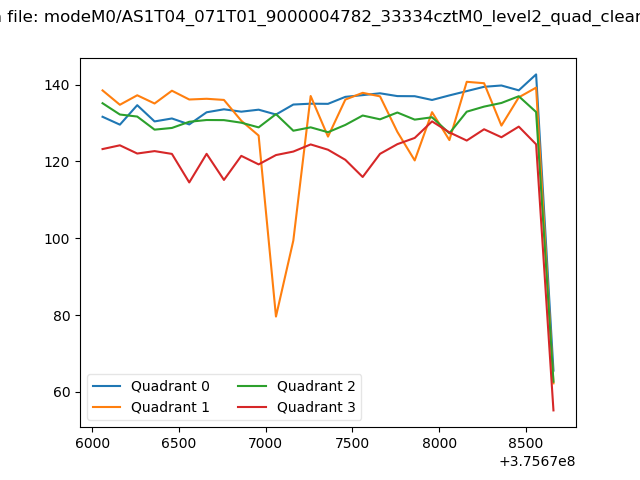 |
|
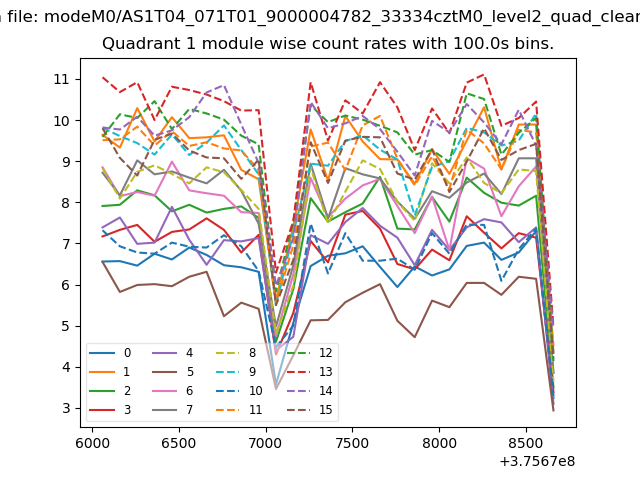
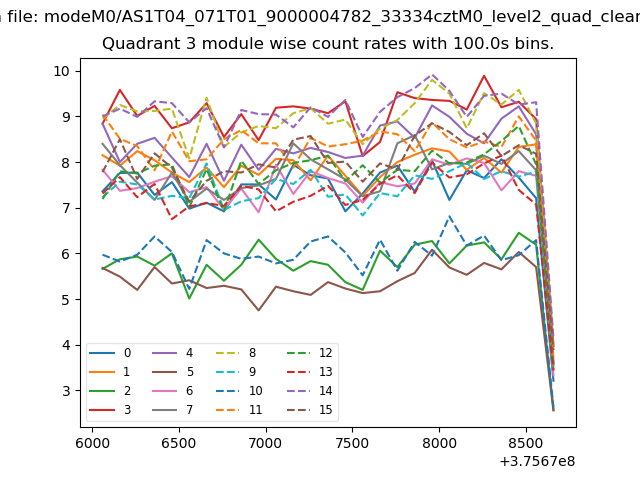
| Module-wise count rates for Quadrant A Data is divided into 100 sec bins |
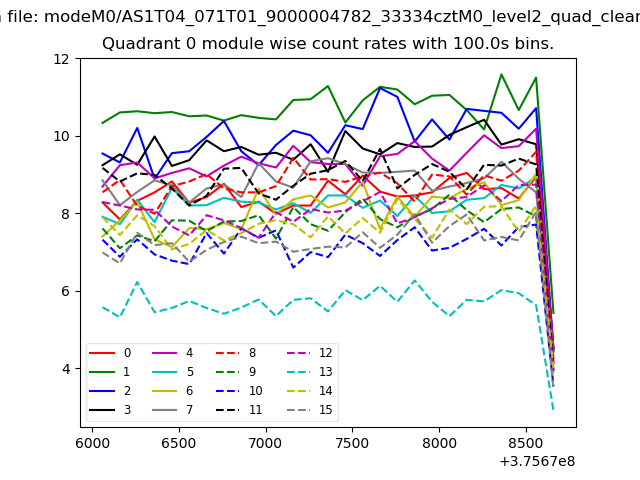 |
 |
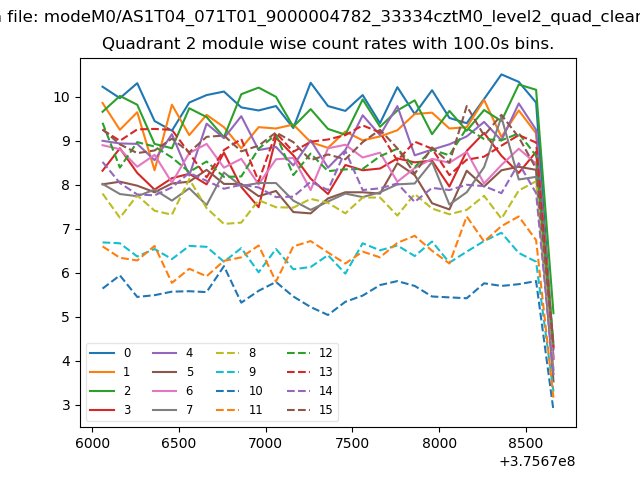
| Module-wise count rates for Quadrant B Data is divided into 100 sec bins |
 |
 |
| Module-wise count rates for Quadrant C Data is divided into 100 sec bins |
 |
 |
| Module-wise count rates for Quadrant D Data is divided into 100 sec bins |
 |
 |
| Parameter | Plot |
|---|---|
| CZT HV Monitor | 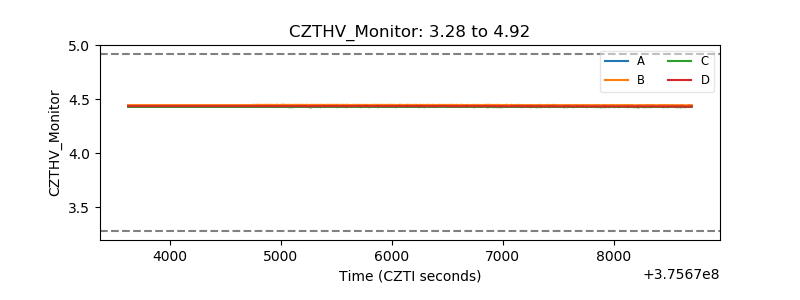 |
| D_VDD | 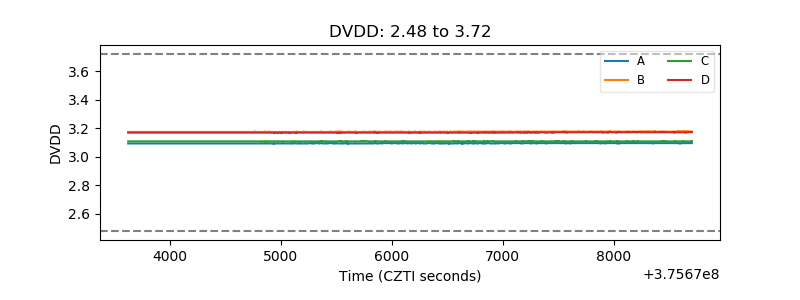 |
| Temperature 1 | 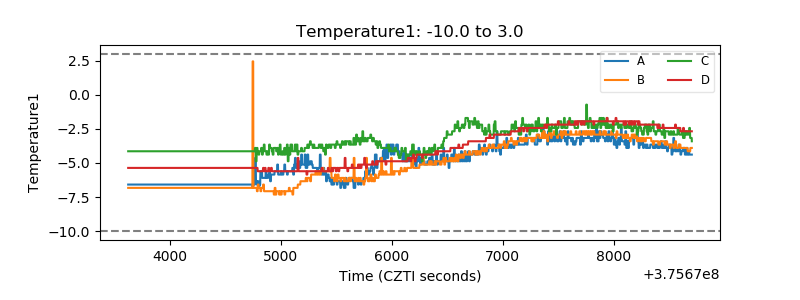 |
| Veto HV Monitor | 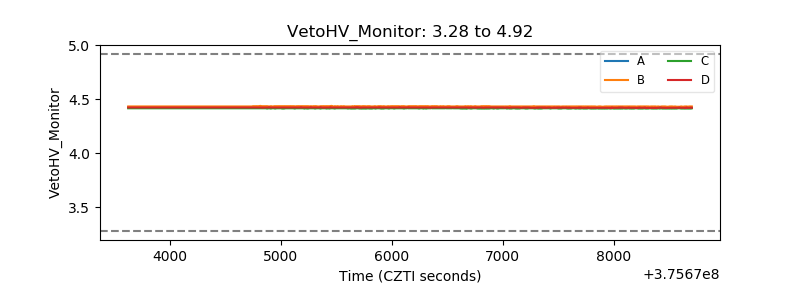 |
| Veto LLD | 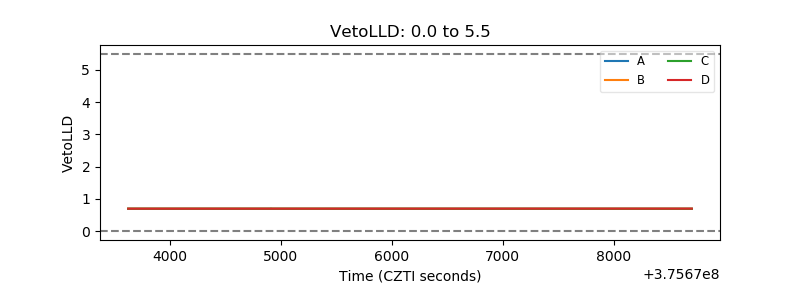 |
| Alpha Counter | 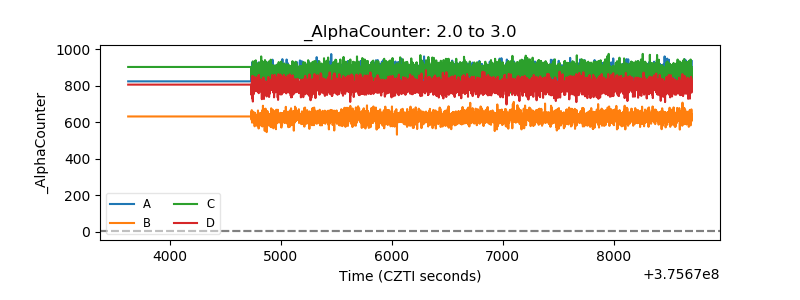 |
| _CPM_Rate | 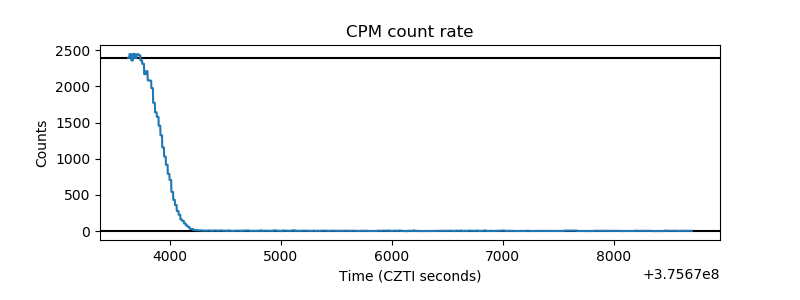 |
| CZT Counter | 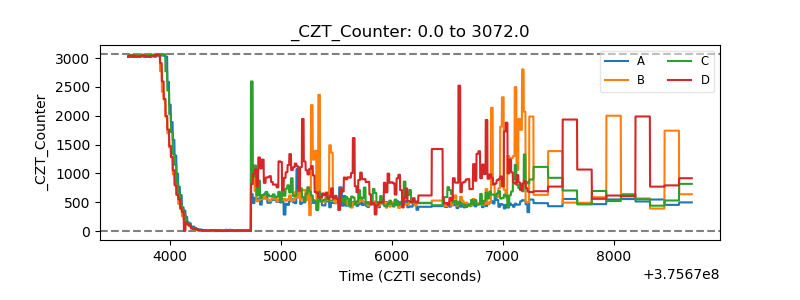 |
| +2.5 Volts monitor |  |
| +5 Volts monitor |  |
| _ROLL_ROT | 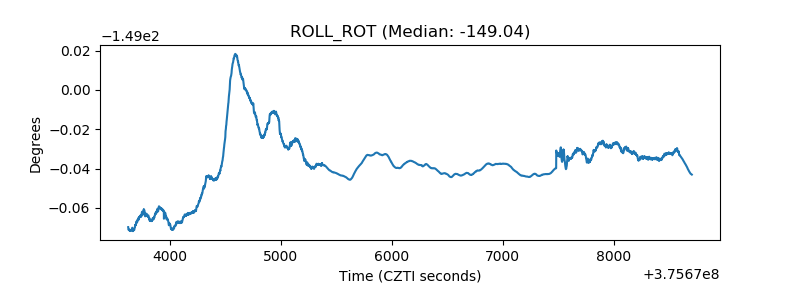 |
| _Roll_DEC | 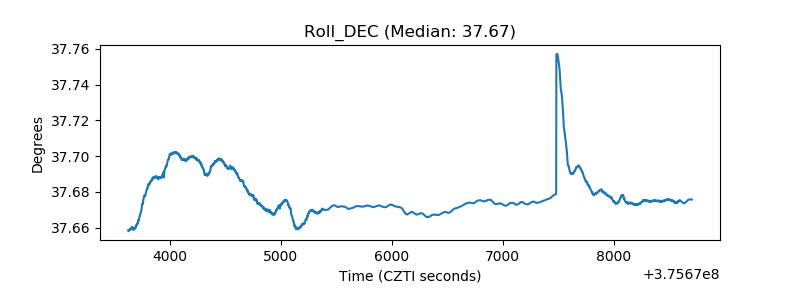 |
| _Roll_RA |  |
| Veto Counter | 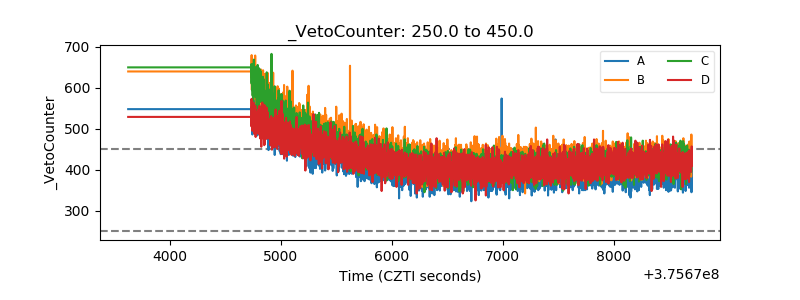 |