| Param | Original file | Final file |
|---|---|---|
| Filename | modeM0/AS1A10_058T15_9000004786cztM0_level2.fits | modeM0/AS1A10_058T15_9000004786cztM0_level2_quad_clean.evt |
| Size (bytes) | 1,120,049,280 | 931,348,800 |
| Size | 1.0 GB | 888.2 MB |
| Events in quadrant A | 7,100,380 | 5,591,518 |
| Events in quadrant B | 6,589,382 | 5,184,881 |
| Events in quadrant C | 6,789,180 | 5,243,520 |
| Events in quadrant D | 5,598,972 | 4,348,106 |
| Mode M0 | |||
|---|---|---|---|
| Quadrant | BADHDUFLAG | Total packets | Discarded packets |
| A | 0 | 260110 | 0 |
| B | 0 | 323573 | 0 |
| C | 0 | 289492 | 0 |
| D | 0 | 471440 | 0 |
| Mode M9 | |||
|---|---|---|---|
| Quadrant | BADHDUFLAG | Total packets | Discarded packets |
| A | 0 | 437 | 0 |
| B | 0 | 437 | 0 |
| C | 0 | 437 | 0 |
| D | 0 | 438 | 0 |
| Mode SS | |||
|---|---|---|---|
| Quadrant | BADHDUFLAG | Total packets | Discarded packets |
| A | 0 | 2344 | 0 |
| B | 0 | 2342 | 0 |
| C | 0 | 2344 | 0 |
| D | 0 | 2340 | 0 |
| Quadrant | Total seconds | Saturated seconds | Saturation percentage |
|---|---|---|---|
| A | 114347 | 921 | 0.805443% |
| B | 114332 | 7398 | 6.470629% |
| C | 114262 | 3388 | 2.965115% |
| D | 114192 | 15126 | 13.246112% |
Noise dominated data is calculated using 1-second bins in cleaned event files. If a bin has >2000 counts, and if more than 50% of those come from <1% of pixels, then it is considered to be noise-dominated and hence unusable.
| Quadrant | # 1 sec bins | Bins with >0 counts | Bins with >2000 counts | High rate bins dominated by noise | Noise dominated (total time) | Noise dominated (detector-on time) | Marked lightcurve |
|---|---|---|---|---|---|---|---|
| A | 162858 | 114488 | 0 | 0 | 0.00% | 0.00% | 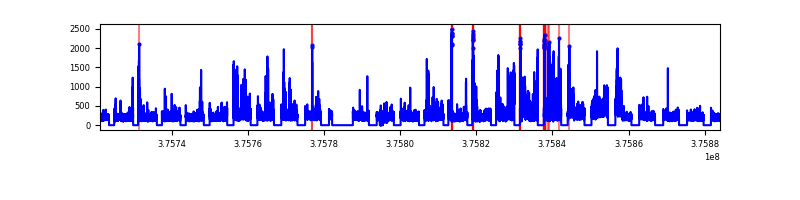 |
| B | 162858 | 114396 | 0 | 0 | 0.00% | 0.00% |  |
| C | 162858 | 114378 | 0 | 0 | 0.00% | 0.00% |  |
| D | 162858 | 114210 | 0 | 0 | 0.00% | 0.00% | 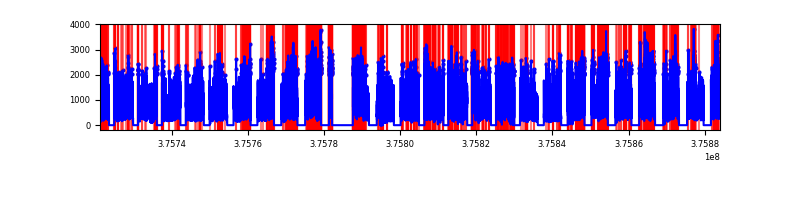 |
Top three noisy pixels from each quadrant. If the there are fewer than three noisy pixels in the level2.evt file, extra rows are filled as -1
| Pixel properties | Quadrant properties | ||||||
|---|---|---|---|---|---|---|---|
| Quadrant | DetID | PixID | Counts | Sigma | Mean | Median | Sigma |
| A | 9 | 19 | 5873 | 9.1 | 1858 | 1755 | 452.4 |
| A | 0 | 29 | 5711 | 8.74 | 1858 | 1755 | 452.4 |
| A | 7 | 110 | 5610 | 8.52 | 1858 | 1755 | 452.4 |
| B | 2 | 9 | 5738 | 12.06 | 1750 | 1681 | 336.3 |
| B | 3 | 80 | 5134 | 10.27 | 1750 | 1681 | 336.3 |
| B | 2 | 8 | 4623 | 8.75 | 1750 | 1681 | 336.3 |
| C | 1 | 81 | 5867 | 9.24 | 1799 | 1700 | 451.1 |
| C | 1 | 80 | 5672 | 8.81 | 1799 | 1700 | 451.1 |
| C | 3 | 187 | 4629 | 6.49 | 1799 | 1700 | 451.1 |
| D | 7 | 3 | 4122 | 6.27 | 1606 | 1470 | 422.7 |
| D | 6 | 231 | 4102 | 6.23 | 1606 | 1470 | 422.7 |
| D | 6 | 67 | 4068 | 6.15 | 1606 | 1470 | 422.7 |
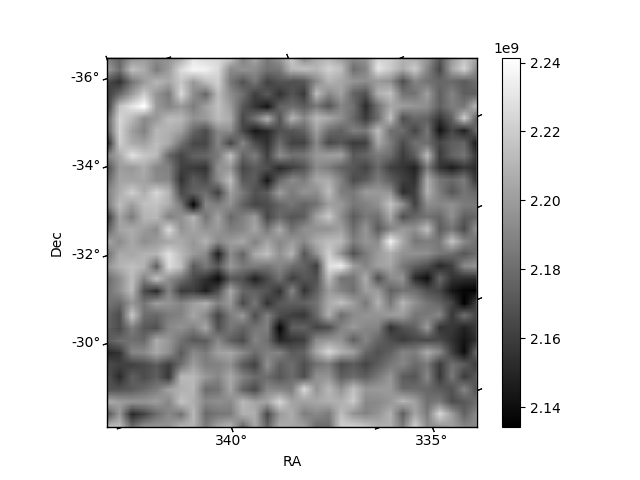
Histogram calculated using DETX and DETY for each event in the final _common_clean file
| Quadrant A |  |
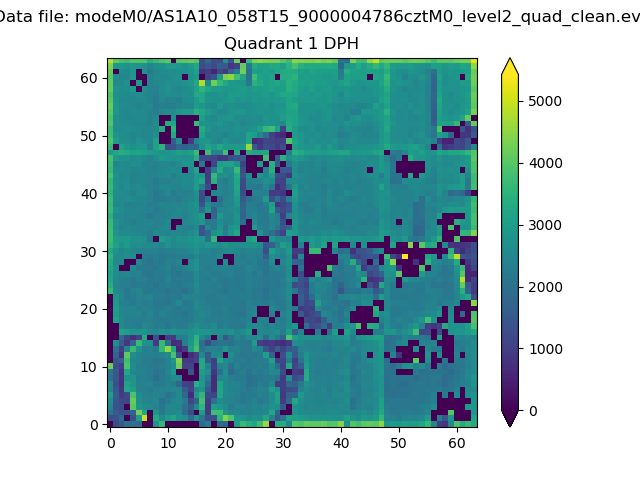 |
Quadrant B |
|---|---|---|---|
| Quadrant D |  |
 |
Quadrant C |
| Plot type | Count rate plots | Images |
|---|---|---|
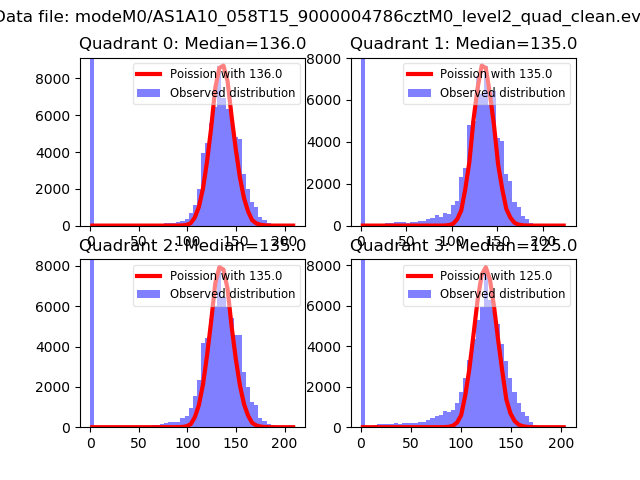
| Comparison with Poisson distribution Blue bars denote a histogram of data divided into 1 sec bins. Red curve is a Poisson curve with rate = median count rate of data. |
 |
 |
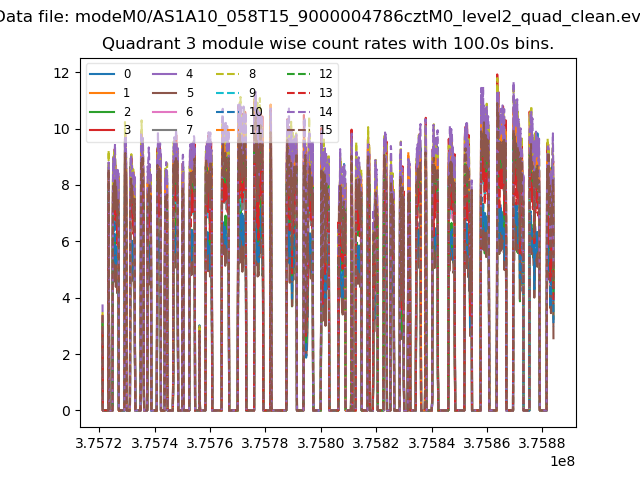
| Quadrant-wise count rates Data is divided into 100 sec bins |
 |
|
| Module-wise count rates for Quadrant A Data is divided into 100 sec bins |
 |
 |
| Module-wise count rates for Quadrant B Data is divided into 100 sec bins |
 |
 |
| Module-wise count rates for Quadrant C Data is divided into 100 sec bins |
 |
 |
| Module-wise count rates for Quadrant D Data is divided into 100 sec bins |
 |
 |
| Parameter | Plot |
|---|---|
| CZT HV Monitor |  |
| D_VDD |  |
| Temperature 1 | 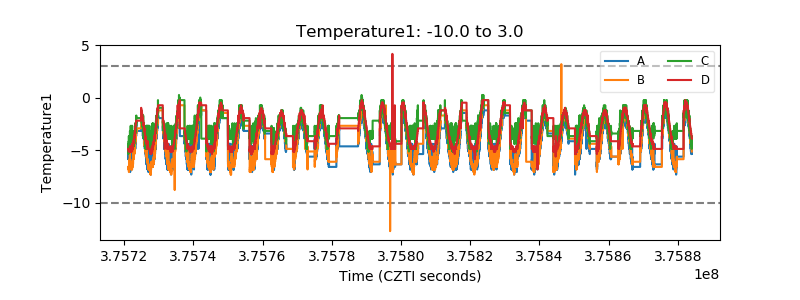 |
| Veto HV Monitor |  |
| Veto LLD | 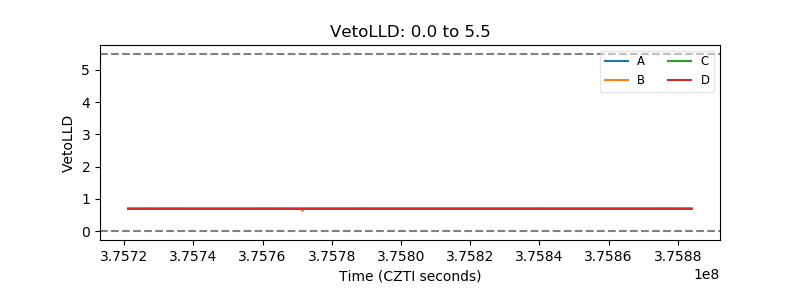 |
| Alpha Counter |  |
| _CPM_Rate |  |
| CZT Counter |  |
| +2.5 Volts monitor |  |
| +5 Volts monitor |  |
| _ROLL_ROT |  |
| _Roll_DEC |  |
| _Roll_RA |  |
| Veto Counter |  |