| Param | Original file | Final file |
|---|---|---|
| Filename | modeM0/AS1A10_058T15_9000004786_33342cztM0_level2.evt | modeM0/AS1A10_058T15_9000004786_33342cztM0_level2_quad_clean.evt |
| Size (bytes) | 615,499,200 | 74,658,240 |
| Size | 587.0 MB | 71.2 MB |
| Events in quadrant A | 2,909,019 | 485,960 |
| Events in quadrant B | 4,757,102 | 445,066 |
| Events in quadrant C | 4,259,794 | 462,863 |
| Events in quadrant D | 6,309,747 | 448,240 |
| Mode M0 | |||
|---|---|---|---|
| Quadrant | BADHDUFLAG | Total packets | Discarded packets |
| A | 0 | 12579 | 3 |
| B | 0 | 18011 | 2 |
| C | 0 | 16475 | 2 |
| D | 0 | 22883 | 2 |
| Mode M9 | |||
|---|---|---|---|
| Quadrant | BADHDUFLAG | Total packets | Discarded packets |
| A | 0 | 19 | 0 |
| B | 0 | 19 | 0 |
| C | 0 | 19 | 0 |
| D | 0 | 20 | 0 |
| Mode SS | |||
|---|---|---|---|
| Quadrant | BADHDUFLAG | Total packets | Discarded packets |
| A | 0 | 122 | 0 |
| B | 0 | 122 | 0 |
| C | 0 | 122 | 0 |
| D | 0 | 122 | 0 |
| Quadrant | Total seconds | Saturated seconds | Saturation percentage |
|---|---|---|---|
| A | 5982 | 9 | 0.150451% |
| B | 5982 | 724 | 12.102976% |
| C | 5982 | 311 | 5.198930% |
| D | 5982 | 586 | 9.796055% |
Noise dominated data is calculated using 1-second bins in cleaned event files. If a bin has >2000 counts, and if more than 50% of those come from <1% of pixels, then it is considered to be noise-dominated and hence unusable.
| Quadrant | # 1 sec bins | Bins with >0 counts | Bins with >2000 counts | High rate bins dominated by noise | Noise dominated (total time) | Noise dominated (detector-on time) | Marked lightcurve |
|---|---|---|---|---|---|---|---|
| A | 7296 | 5983 | 1 | 1 | 0.01% | 0.02% | 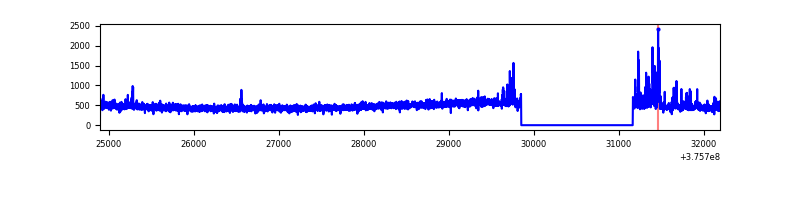 |
| B | 7296 | 5983 | 440 | 440 | 6.03% | 7.35% | 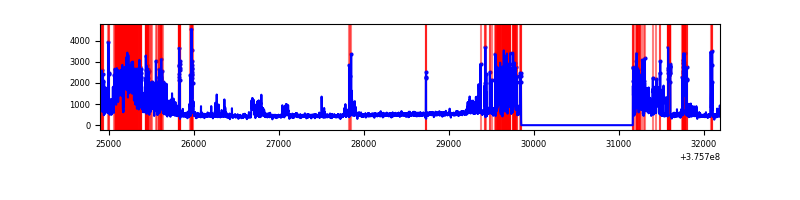 |
| C | 7296 | 5983 | 273 | 273 | 3.74% | 4.56% | 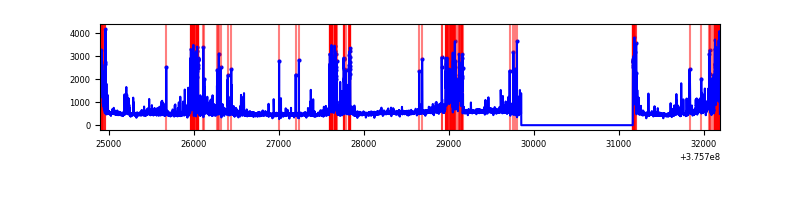 |
| D | 7296 | 5983 | 476 | 476 | 6.52% | 7.96% | 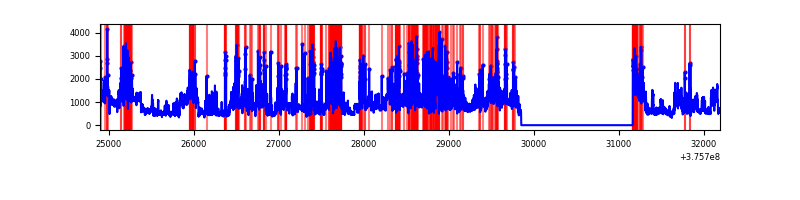 |
Top three noisy pixels from each quadrant. If the there are fewer than three noisy pixels in the level2.evt file, extra rows are filled as -1
| Pixel properties | Quadrant properties | ||||||
|---|---|---|---|---|---|---|---|
| Quadrant | DetID | PixID | Counts | Sigma | Mean | Median | Sigma |
| A | 12 | 16 | 123872 | 864.99 | 706 | 691 | 142.4 |
| A | 12 | 194 | 25273 | 172.62 | 706 | 691 | 142.4 |
| A | 13 | 6 | 22005 | 149.67 | 706 | 691 | 142.4 |
| B | 0 | 219 | 1107623 | 8491.41 | 673 | 656 | 130.4 |
| B | 5 | 172 | 729628 | 5591.86 | 673 | 656 | 130.4 |
| B | 4 | 170 | 97049 | 739.42 | 673 | 656 | 130.4 |
| C | 1 | 23 | 583124 | 3789.53 | 663 | 669 | 153.7 |
| C | 15 | 208 | 367650 | 2387.63 | 663 | 669 | 153.7 |
| C | 15 | 214 | 257082 | 1668.26 | 663 | 669 | 153.7 |
| D | 8 | 195 | 1583002 | 9489.94 | 651 | 636 | 166.7 |
| D | 2 | 250 | 863790 | 5176.6 | 651 | 636 | 166.7 |
| D | 12 | 218 | 407978 | 2442.96 | 651 | 636 | 166.7 |
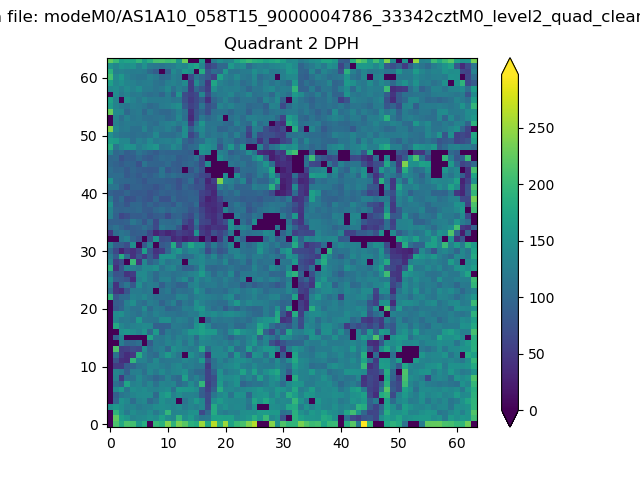
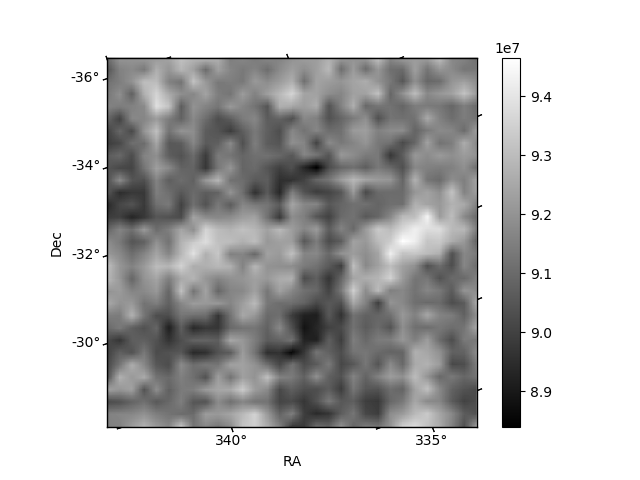
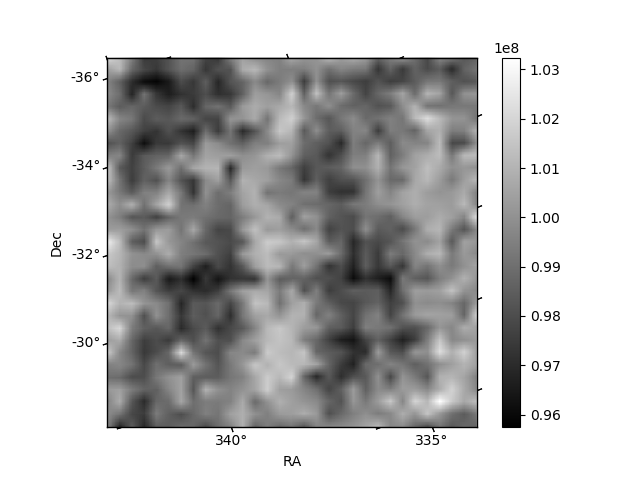
Histogram calculated using DETX and DETY for each event in the final _common_clean file
| Quadrant A | 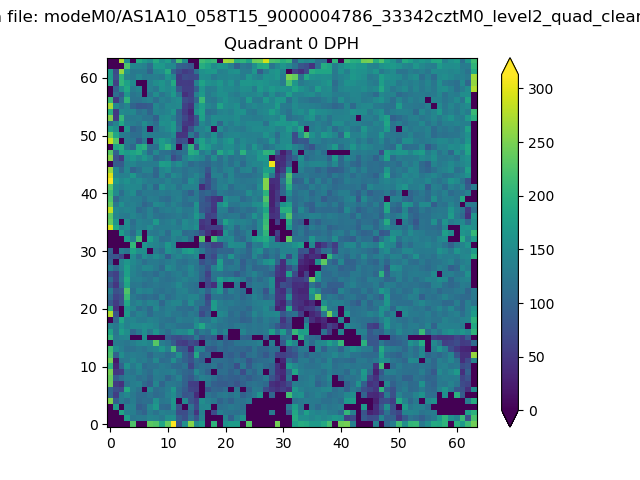 |
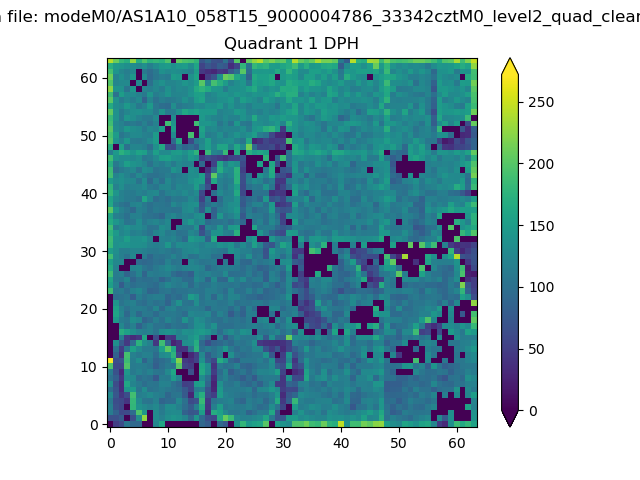 |
Quadrant B |
|---|---|---|---|
| Quadrant D | 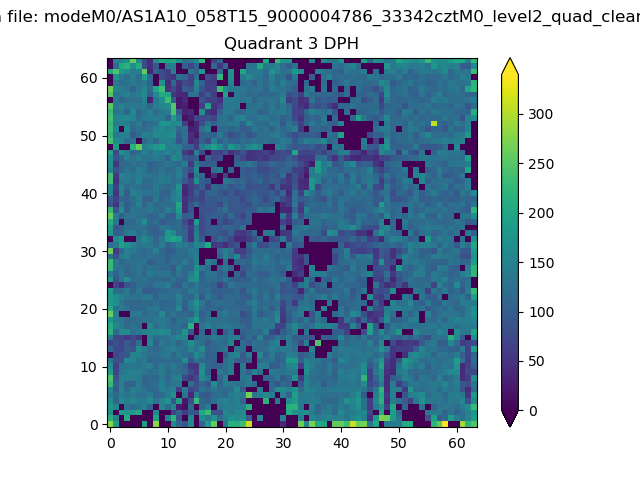 |
 |
Quadrant C |
| Plot type | Count rate plots | Images |
|---|---|---|
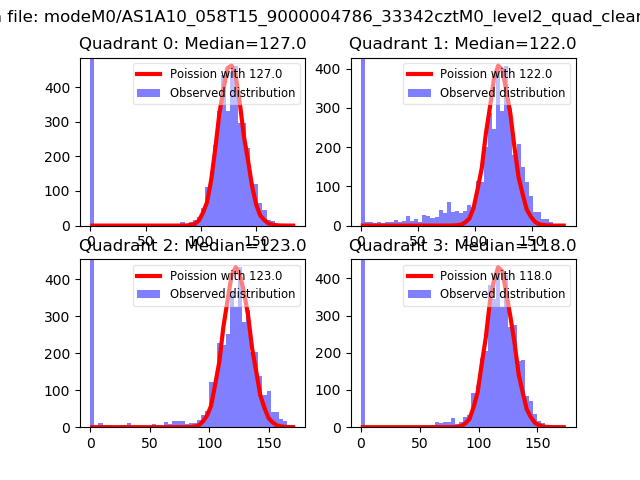
| Comparison with Poisson distribution Blue bars denote a histogram of data divided into 1 sec bins. Red curve is a Poisson curve with rate = median count rate of data. |
 |
 |
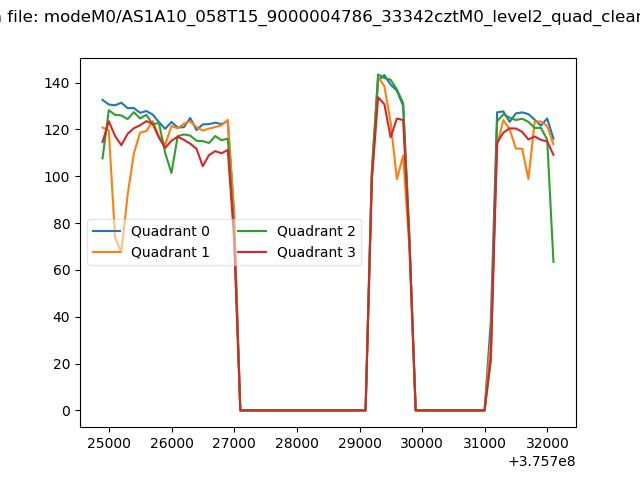
| Quadrant-wise count rates Data is divided into 100 sec bins |
 |
|
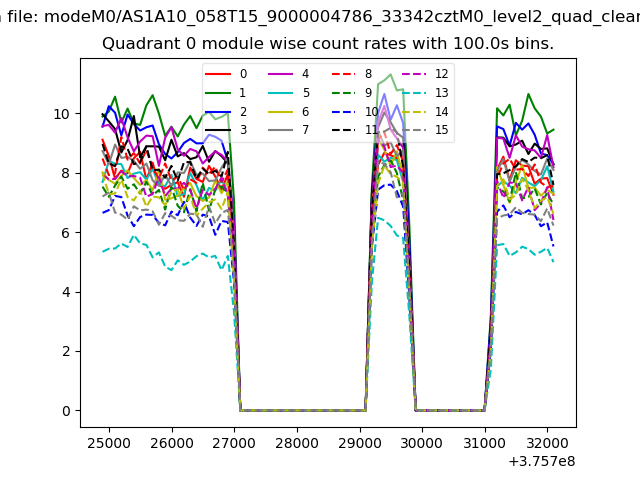
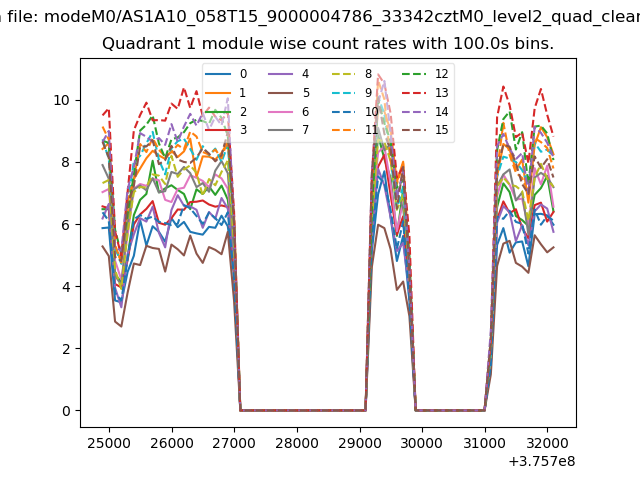
| Module-wise count rates for Quadrant A Data is divided into 100 sec bins |
 |
 |
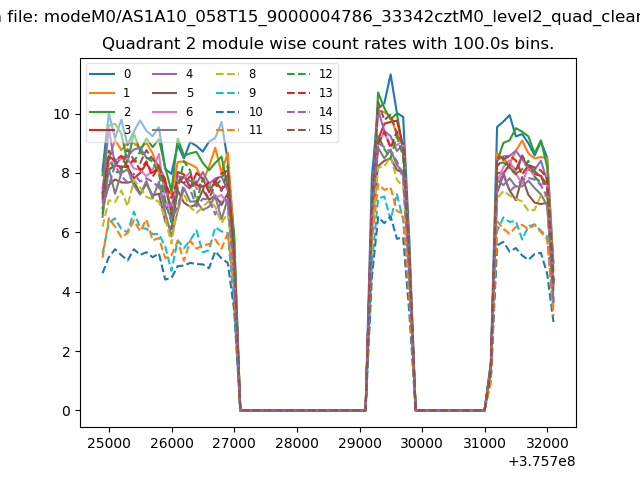
| Module-wise count rates for Quadrant B Data is divided into 100 sec bins |
 |
 |
| Module-wise count rates for Quadrant C Data is divided into 100 sec bins |
 |
 |
| Module-wise count rates for Quadrant D Data is divided into 100 sec bins |
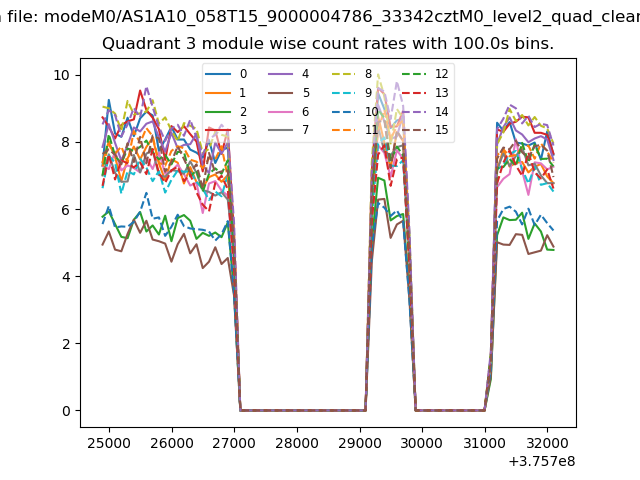 |
 |
| Parameter | Plot |
|---|---|
| CZT HV Monitor | 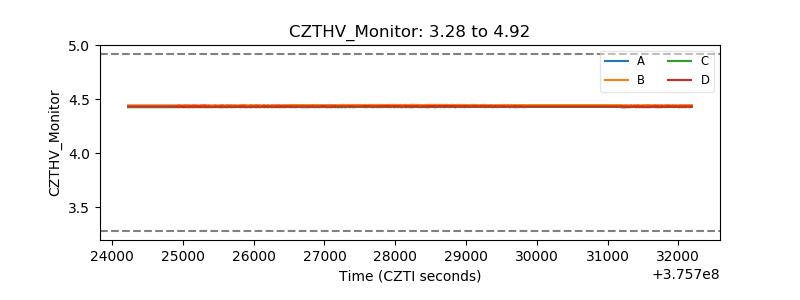 |
| D_VDD | 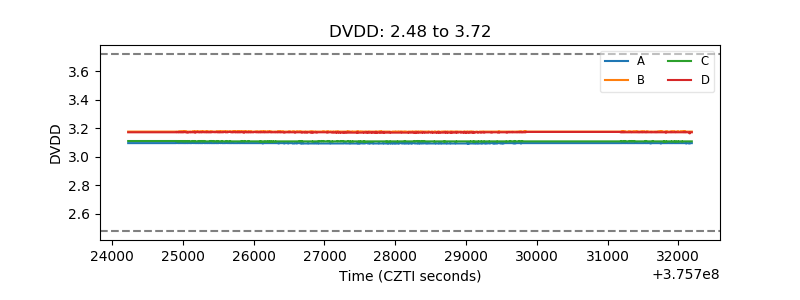 |
| Temperature 1 | 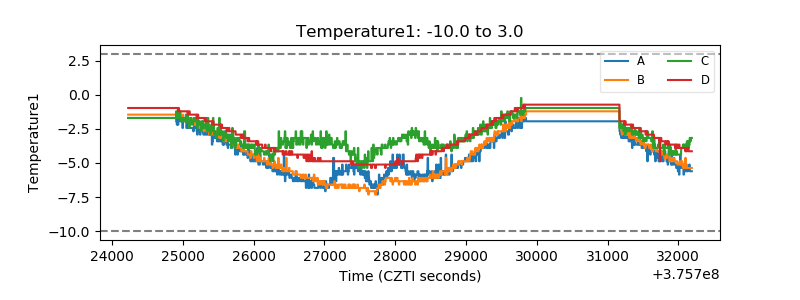 |
| Veto HV Monitor | 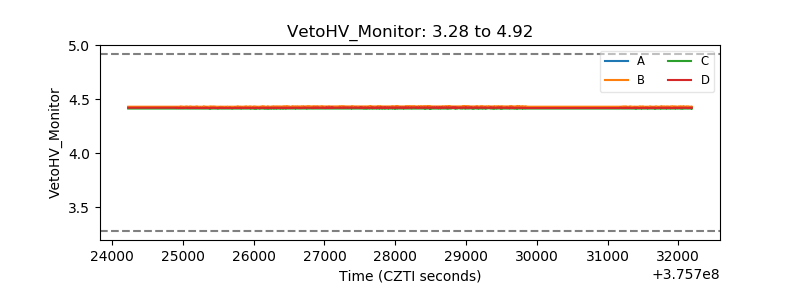 |
| Veto LLD | 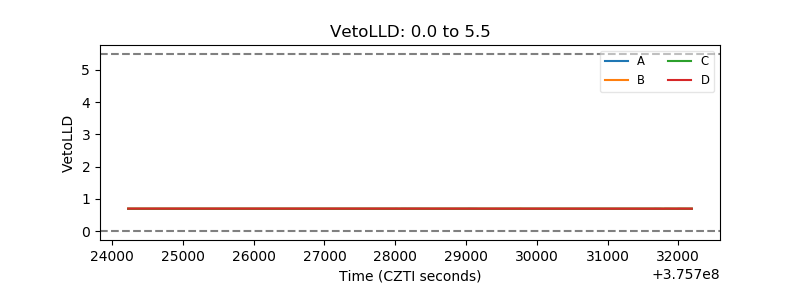 |
| Alpha Counter | 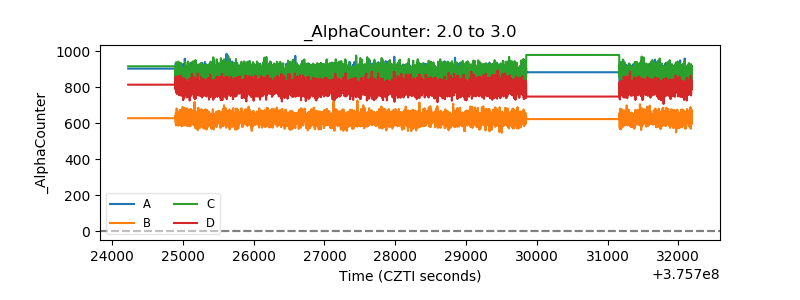 |
| _CPM_Rate | 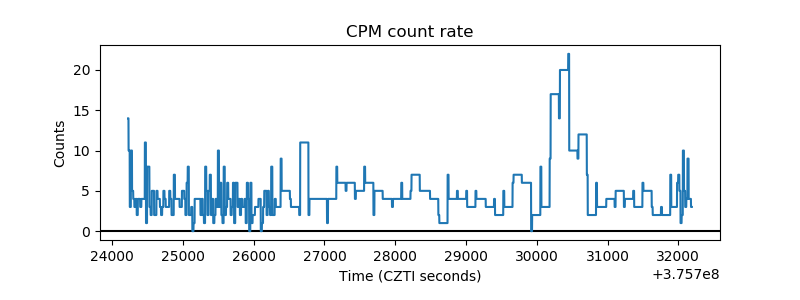 |
| CZT Counter | 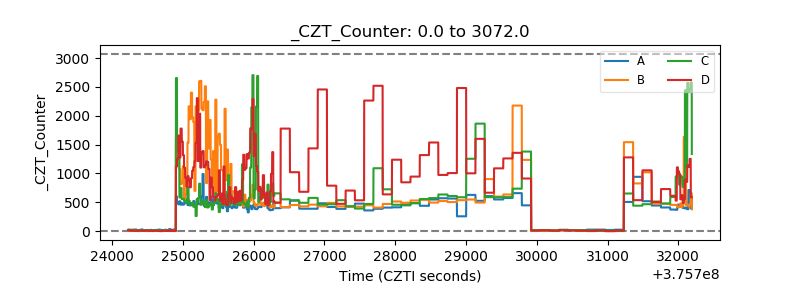 |
| +2.5 Volts monitor |  |
| +5 Volts monitor |  |
| _ROLL_ROT | 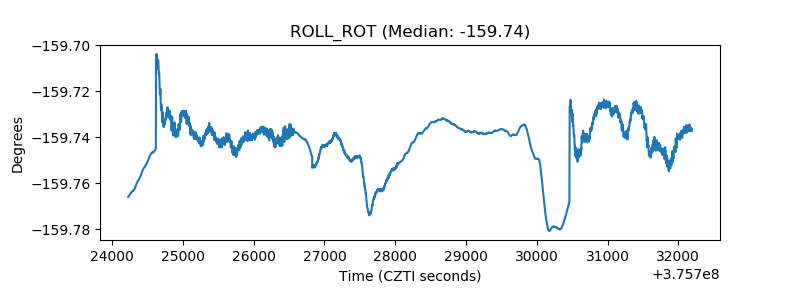 |
| _Roll_DEC | 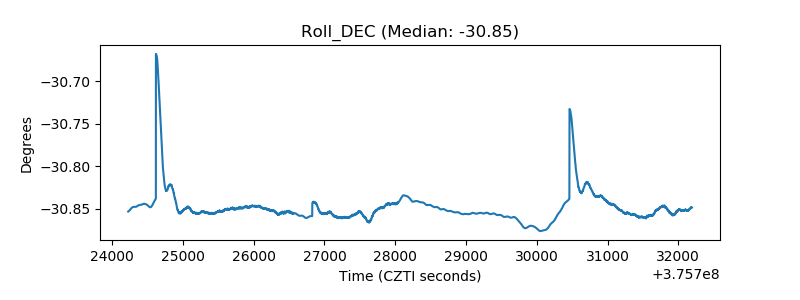 |
| _Roll_RA | 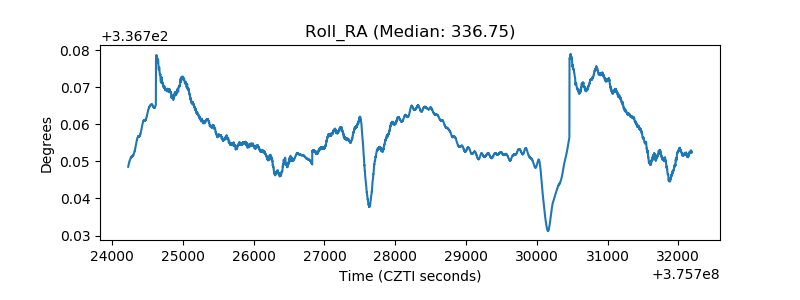 |
| Veto Counter | 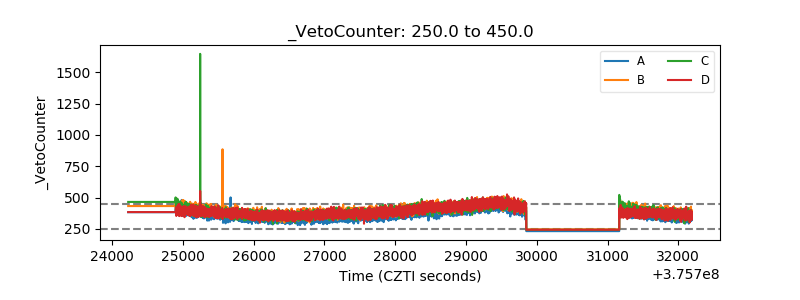 |