| Param | Original file | Final file |
|---|---|---|
| Filename | modeM0/AS1A10_058T15_9000004786_33345cztM0_level2.evt | modeM0/AS1A10_058T15_9000004786_33345cztM0_level2_quad_clean.evt |
| Size (bytes) | 588,968,640 | 74,514,240 |
| Size | 561.7 MB | 71.1 MB |
| Events in quadrant A | 3,055,534 | 472,356 |
| Events in quadrant B | 4,881,463 | 443,084 |
| Events in quadrant C | 3,385,329 | 463,544 |
| Events in quadrant D | 6,085,057 | 433,968 |
| Mode M0 | |||
|---|---|---|---|
| Quadrant | BADHDUFLAG | Total packets | Discarded packets |
| A | 0 | 12979 | 3 |
| B | 0 | 18712 | 2 |
| C | 0 | 13709 | 2 |
| D | 0 | 22602 | 2 |
| Mode M9 | |||
|---|---|---|---|
| Quadrant | BADHDUFLAG | Total packets | Discarded packets |
| A | 0 | 30 | 0 |
| B | 0 | 30 | 0 |
| C | 0 | 30 | 0 |
| D | 0 | 30 | 0 |
| Mode SS | |||
|---|---|---|---|
| Quadrant | BADHDUFLAG | Total packets | Discarded packets |
| A | 0 | 130 | 0 |
| B | 0 | 130 | 0 |
| C | 0 | 130 | 0 |
| D | 0 | 130 | 0 |
| Quadrant | Total seconds | Saturated seconds | Saturation percentage |
|---|---|---|---|
| A | 6350 | 12 | 0.188976% |
| B | 6350 | 710 | 11.181102% |
| C | 6350 | 60 | 0.944882% |
| D | 6350 | 260 | 4.094488% |
Noise dominated data is calculated using 1-second bins in cleaned event files. If a bin has >2000 counts, and if more than 50% of those come from <1% of pixels, then it is considered to be noise-dominated and hence unusable.
| Quadrant | # 1 sec bins | Bins with >0 counts | Bins with >2000 counts | High rate bins dominated by noise | Noise dominated (total time) | Noise dominated (detector-on time) | Marked lightcurve |
|---|---|---|---|---|---|---|---|
| A | 9335 | 6352 | 1 | 1 | 0.01% | 0.02% | 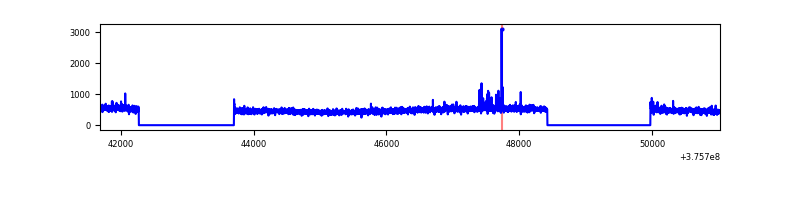 |
| B | 9335 | 6352 | 338 | 338 | 3.62% | 5.32% | 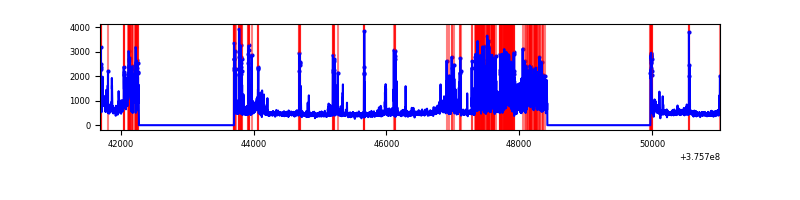 |
| C | 9335 | 6352 | 42 | 42 | 0.45% | 0.66% | 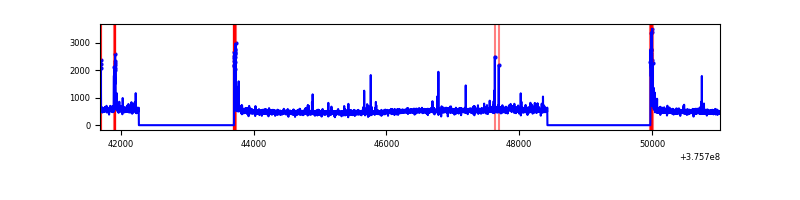 |
| D | 9335 | 6352 | 182 | 182 | 1.95% | 2.87% | 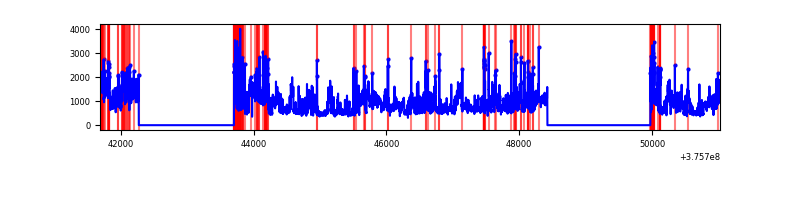 |
Top three noisy pixels from each quadrant. If the there are fewer than three noisy pixels in the level2.evt file, extra rows are filled as -1
| Pixel properties | Quadrant properties | ||||||
|---|---|---|---|---|---|---|---|
| Quadrant | DetID | PixID | Counts | Sigma | Mean | Median | Sigma |
| A | 15 | 169 | 92737 | 602.34 | 758 | 743 | 152.7 |
| A | 14 | 254 | 20148 | 127.06 | 758 | 743 | 152.7 |
| A | 13 | 6 | 13647 | 84.49 | 758 | 743 | 152.7 |
| B | 5 | 172 | 900195 | 6434.63 | 731 | 712 | 139.8 |
| B | 0 | 219 | 809271 | 5784.19 | 731 | 712 | 139.8 |
| B | 0 | 189 | 71286 | 504.87 | 731 | 712 | 139.8 |
| C | 15 | 214 | 275622 | 1618.69 | 732 | 737 | 169.8 |
| C | 0 | 10 | 130407 | 763.57 | 732 | 737 | 169.8 |
| C | 1 | 23 | 70245 | 409.3 | 732 | 737 | 169.8 |
| D | 8 | 195 | 2041161 | 10510.09 | 720 | 704 | 194.1 |
| D | 12 | 218 | 471020 | 2422.53 | 720 | 704 | 194.1 |
| D | 7 | 222 | 232158 | 1192.18 | 720 | 704 | 194.1 |
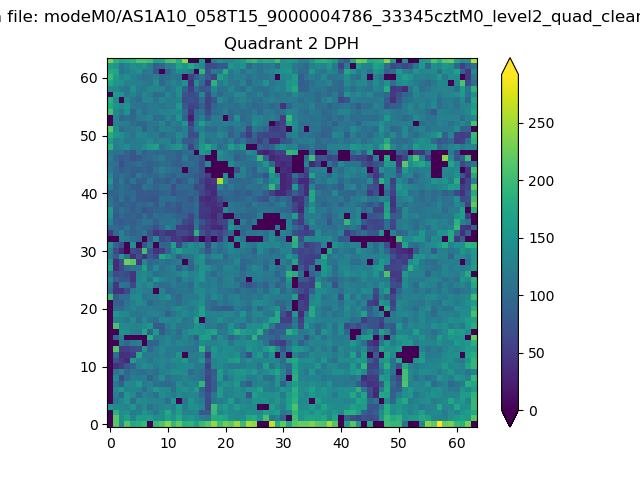
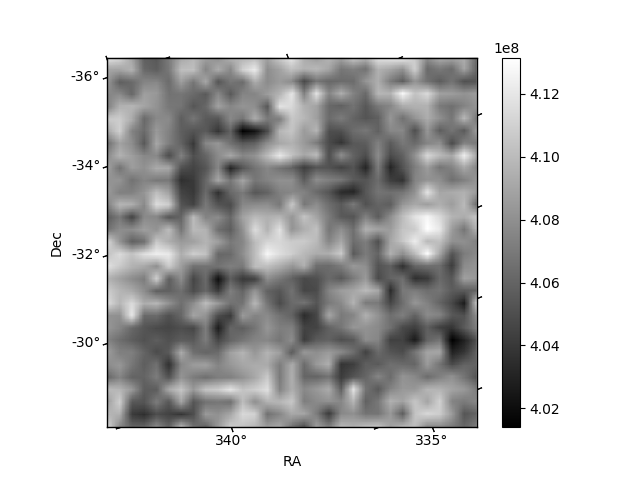
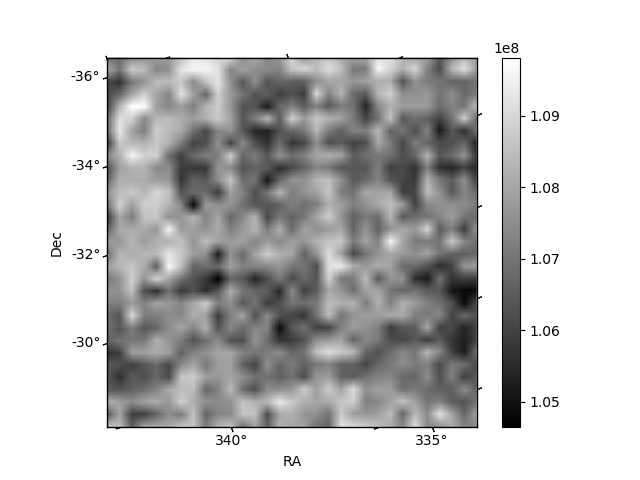
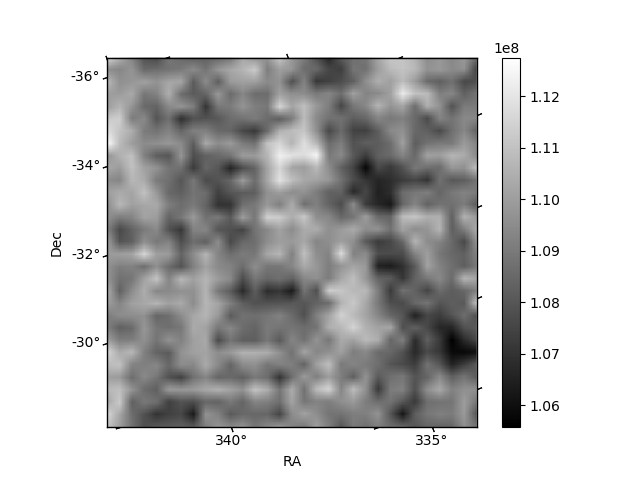
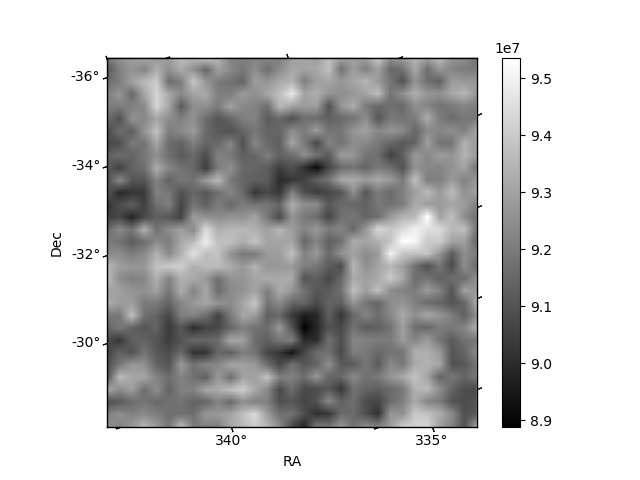
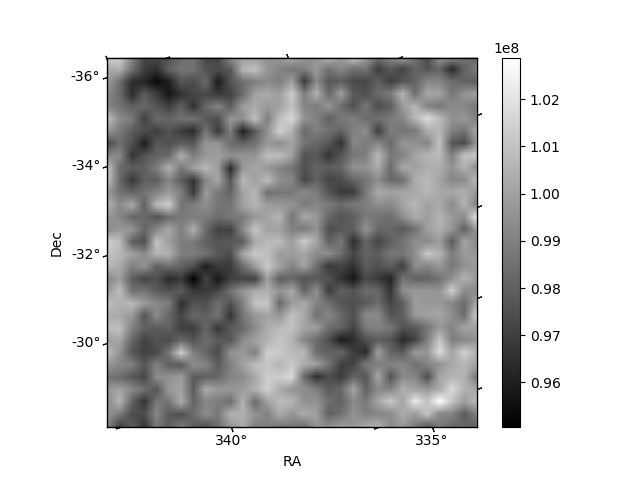
Histogram calculated using DETX and DETY for each event in the final _common_clean file
| Quadrant A | 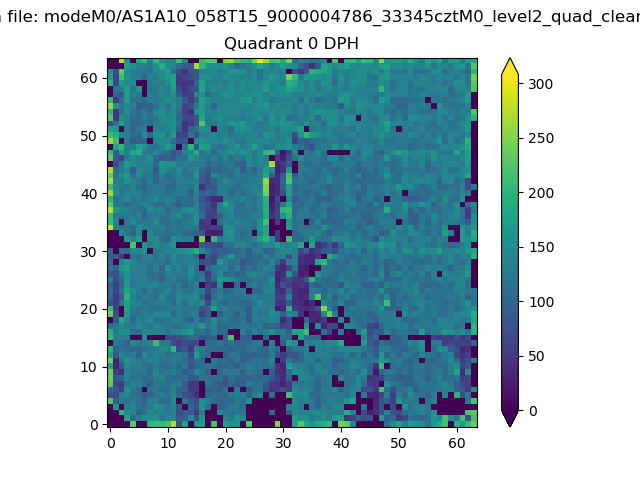 |
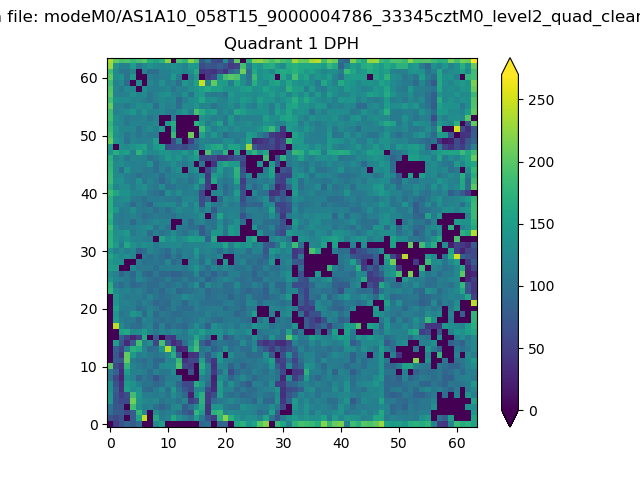 |
Quadrant B |
|---|---|---|---|
| Quadrant D | 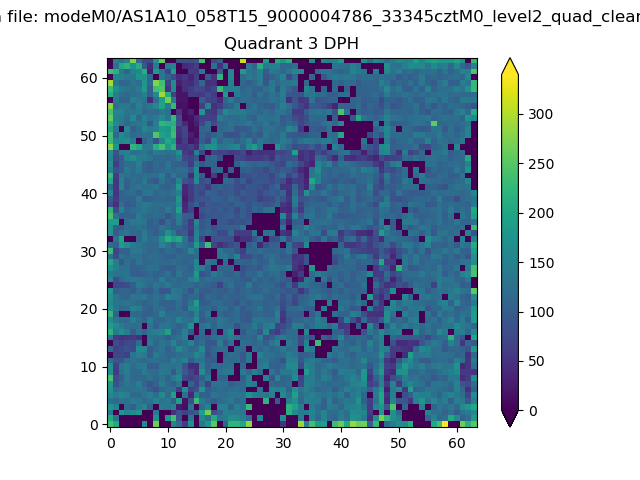 |
 |
Quadrant C |
| Plot type | Count rate plots | Images |
|---|---|---|
| Comparison with Poisson distribution Blue bars denote a histogram of data divided into 1 sec bins. Red curve is a Poisson curve with rate = median count rate of data. |
 |
 |
| Quadrant-wise count rates Data is divided into 100 sec bins |
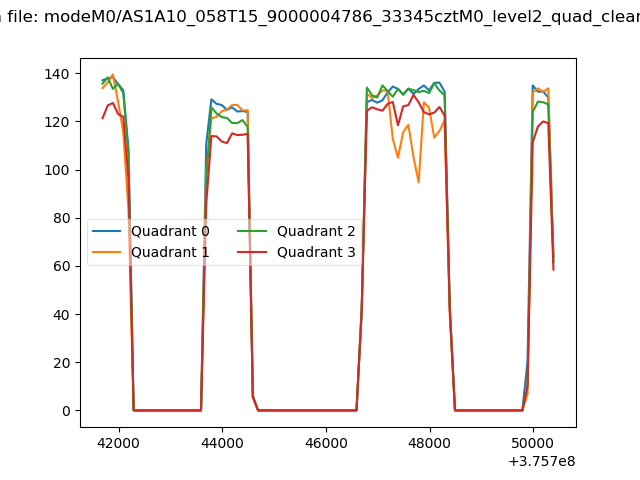 |
|
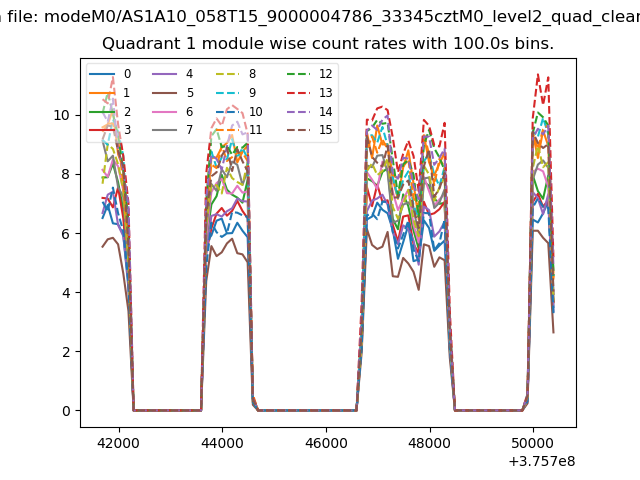
| Module-wise count rates for Quadrant A Data is divided into 100 sec bins |
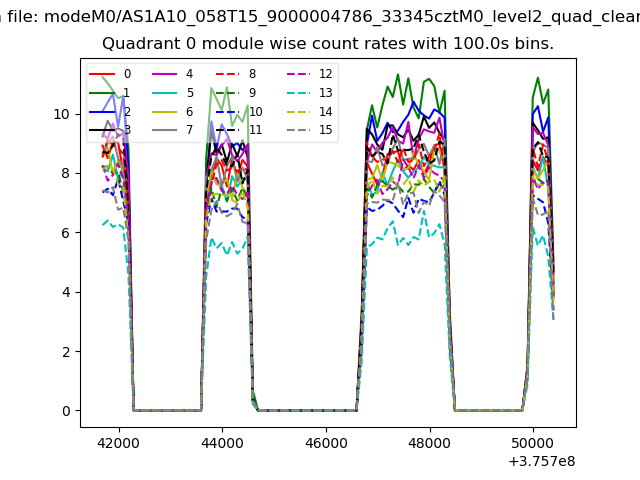 |
 |
| Module-wise count rates for Quadrant B Data is divided into 100 sec bins |
 |
 |
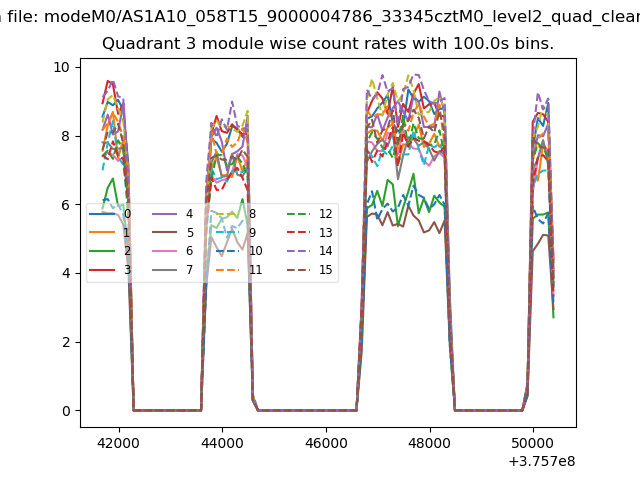
| Module-wise count rates for Quadrant C Data is divided into 100 sec bins |
 |
 |
| Module-wise count rates for Quadrant D Data is divided into 100 sec bins |
 |
 |
| Parameter | Plot |
|---|---|
| CZT HV Monitor |  |
| D_VDD | 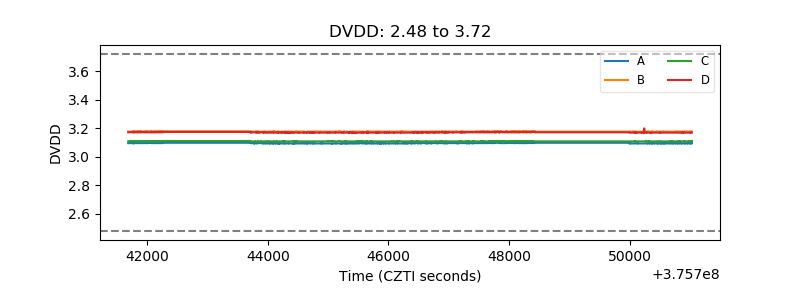 |
| Temperature 1 | 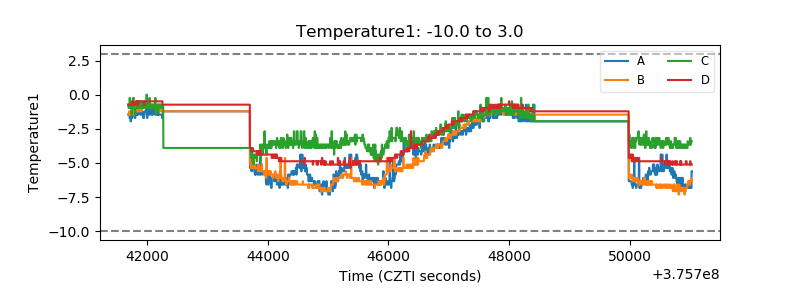 |
| Veto HV Monitor | 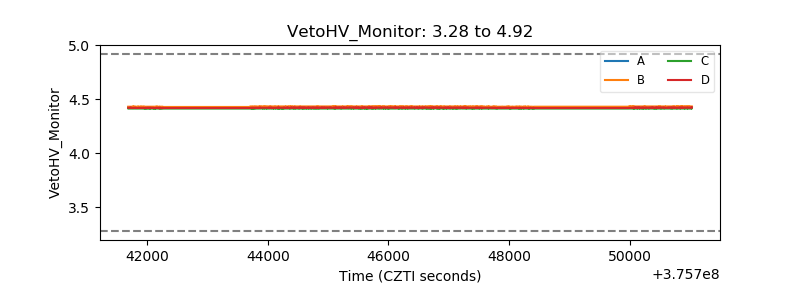 |
| Veto LLD | 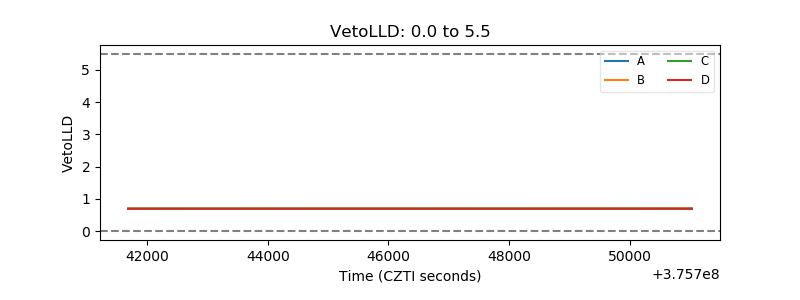 |
| Alpha Counter | 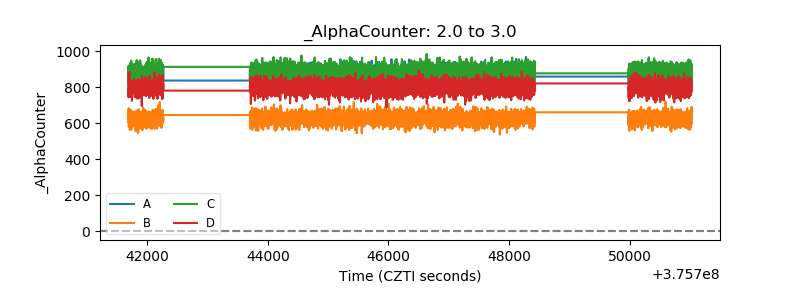 |
| _CPM_Rate | 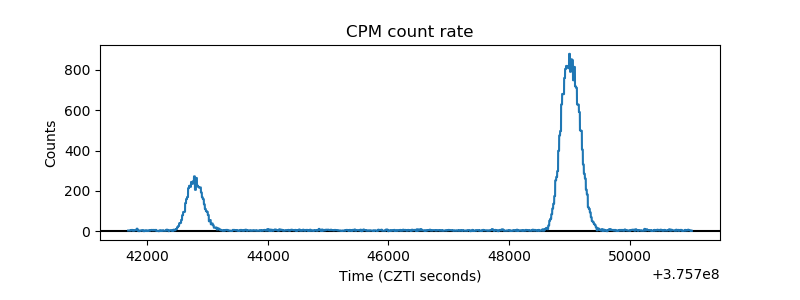 |
| CZT Counter | 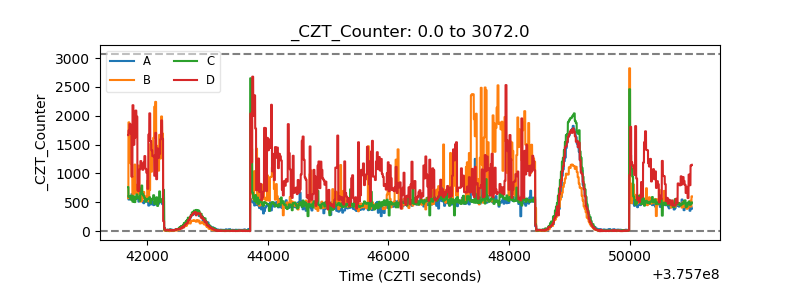 |
| +2.5 Volts monitor |  |
| +5 Volts monitor |  |
| _ROLL_ROT | 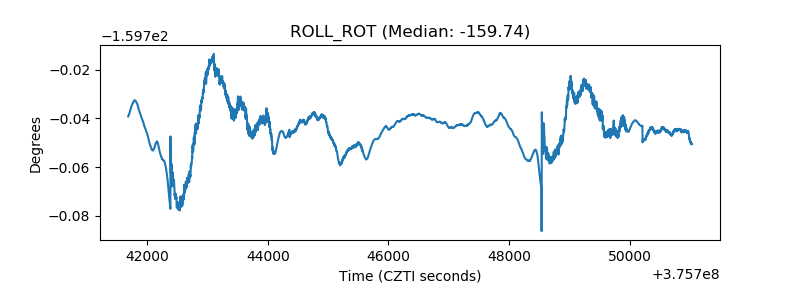 |
| _Roll_DEC | 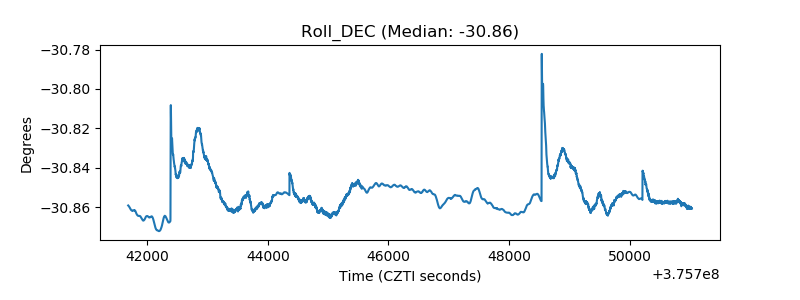 |
| _Roll_RA | 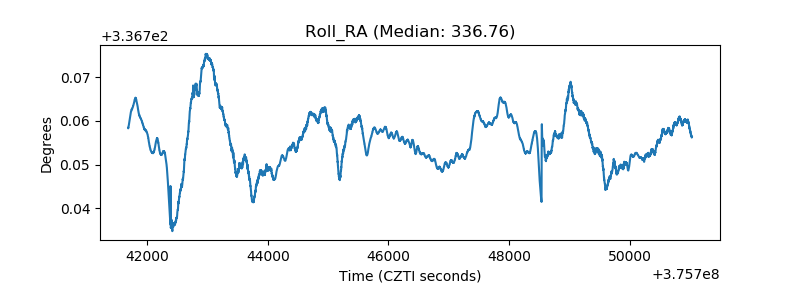 |
| Veto Counter | 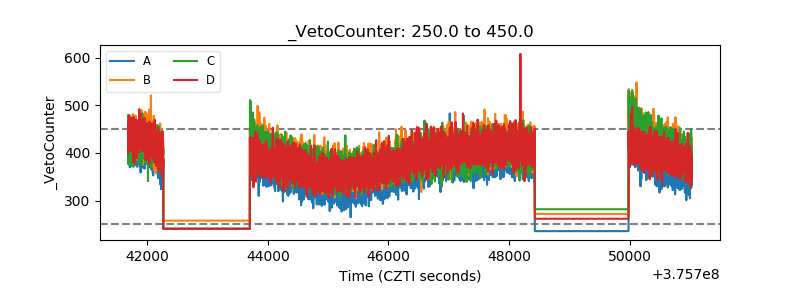 |