| Param | Original file | Final file |
|---|---|---|
| Filename | modeM0/AS1A10_058T15_9000004786_33348cztM0_level2.evt | modeM0/AS1A10_058T15_9000004786_33348cztM0_level2_quad_clean.evt |
| Size (bytes) | 538,174,080 | 51,877,440 |
| Size | 513.2 MB | 49.5 MB |
| Events in quadrant A | 3,165,282 | 308,270 |
| Events in quadrant B | 3,988,446 | 295,783 |
| Events in quadrant C | 3,592,778 | 304,323 |
| Events in quadrant D | 5,187,313 | 284,142 |
| Mode M0 | |||
|---|---|---|---|
| Quadrant | BADHDUFLAG | Total packets | Discarded packets |
| A | 0 | 12678 | 3 |
| B | 0 | 15221 | 2 |
| C | 0 | 13857 | 2 |
| D | 0 | 19121 | 2 |
| Mode M9 | |||
|---|---|---|---|
| Quadrant | BADHDUFLAG | Total packets | Discarded packets |
| A | 0 | 34 | 0 |
| B | 0 | 34 | 0 |
| C | 0 | 34 | 0 |
| D | 0 | 34 | 0 |
| Mode SS | |||
|---|---|---|---|
| Quadrant | BADHDUFLAG | Total packets | Discarded packets |
| A | 0 | 110 | 0 |
| B | 0 | 110 | 0 |
| C | 0 | 110 | 0 |
| D | 0 | 110 | 0 |
| Quadrant | Total seconds | Saturated seconds | Saturation percentage |
|---|---|---|---|
| A | 5393 | 34 | 0.630447% |
| B | 5393 | 429 | 7.954756% |
| C | 5393 | 182 | 3.374745% |
| D | 5393 | 256 | 4.746894% |
Noise dominated data is calculated using 1-second bins in cleaned event files. If a bin has >2000 counts, and if more than 50% of those come from <1% of pixels, then it is considered to be noise-dominated and hence unusable.
| Quadrant | # 1 sec bins | Bins with >0 counts | Bins with >2000 counts | High rate bins dominated by noise | Noise dominated (total time) | Noise dominated (detector-on time) | Marked lightcurve |
|---|---|---|---|---|---|---|---|
| A | 7186 | 5394 | 15 | 15 | 0.21% | 0.28% | 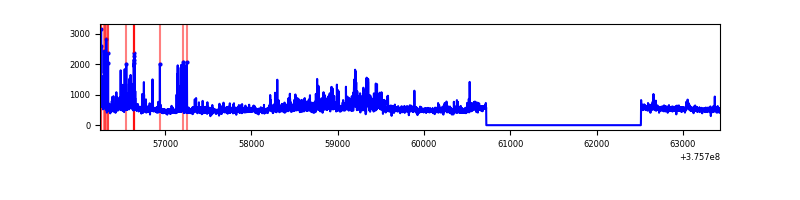 |
| B | 7186 | 5394 | 303 | 303 | 4.22% | 5.62% | 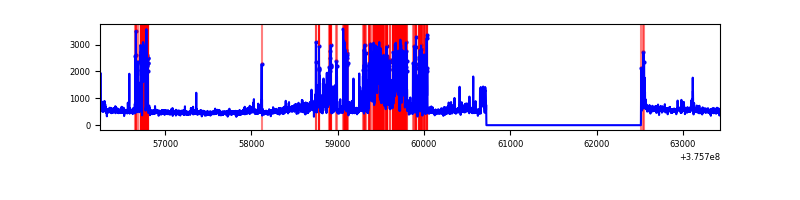 |
| C | 7186 | 5394 | 167 | 167 | 2.32% | 3.10% | 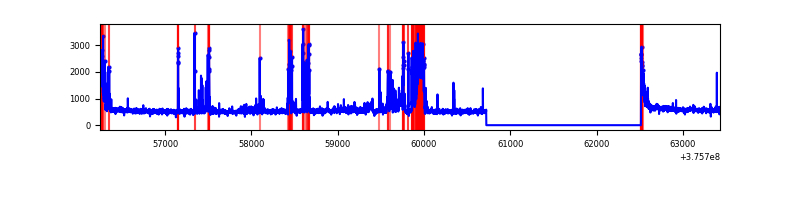 |
| D | 7186 | 5394 | 244 | 244 | 3.40% | 4.52% | 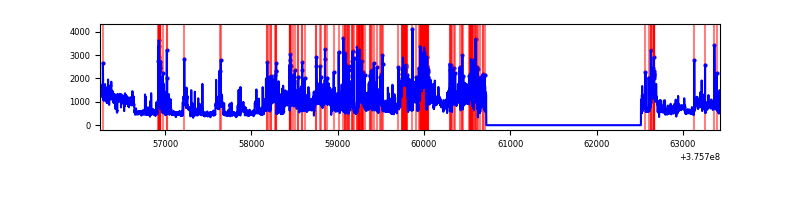 |
Top three noisy pixels from each quadrant. If the there are fewer than three noisy pixels in the level2.evt file, extra rows are filled as -1
| Pixel properties | Quadrant properties | ||||||
|---|---|---|---|---|---|---|---|
| Quadrant | DetID | PixID | Counts | Sigma | Mean | Median | Sigma |
| A | 15 | 169 | 578760 | 4327.58 | 668 | 657 | 133.6 |
| A | 13 | 254 | 7915 | 54.33 | 668 | 657 | 133.6 |
| A | 3 | 137 | 6180 | 41.34 | 668 | 657 | 133.6 |
| B | 5 | 172 | 843405 | 6760.27 | 653 | 636 | 124.7 |
| B | 0 | 219 | 193412 | 1546.35 | 653 | 636 | 124.7 |
| B | 5 | 200 | 170007 | 1358.61 | 653 | 636 | 124.7 |
| C | 1 | 23 | 372699 | 2521.27 | 646 | 651 | 147.6 |
| C | 15 | 214 | 235061 | 1588.54 | 646 | 651 | 147.6 |
| C | 14 | 254 | 213826 | 1444.63 | 646 | 651 | 147.6 |
| D | 8 | 195 | 1118901 | 6593.63 | 636 | 624 | 169.6 |
| D | 1 | 52 | 597494 | 3519.29 | 636 | 624 | 169.6 |
| D | 12 | 233 | 279385 | 1643.64 | 636 | 624 | 169.6 |
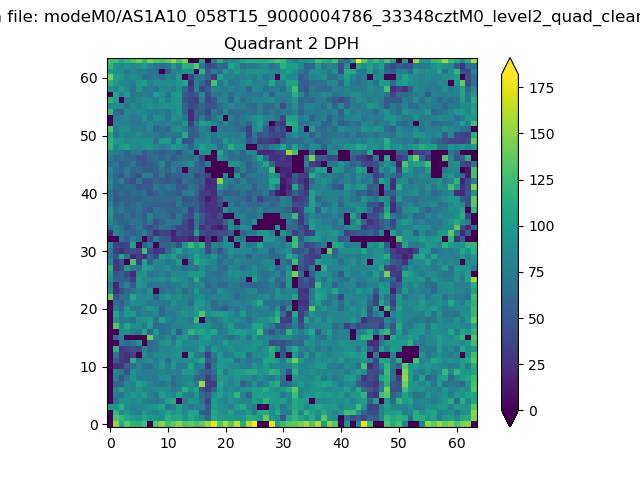
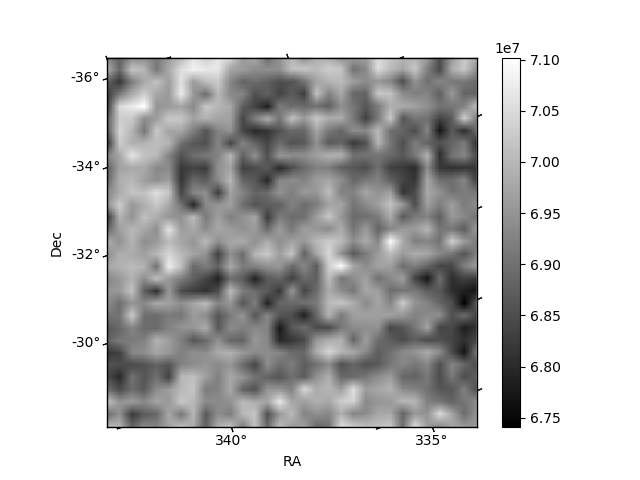
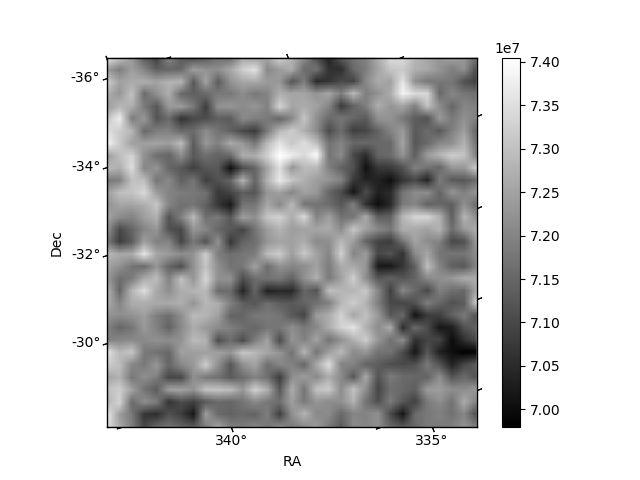
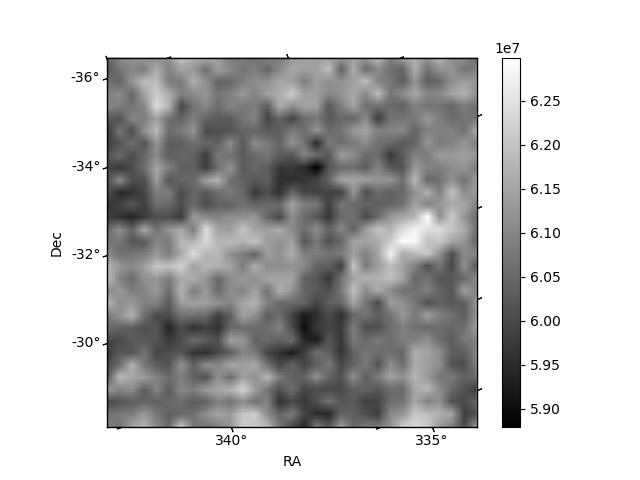
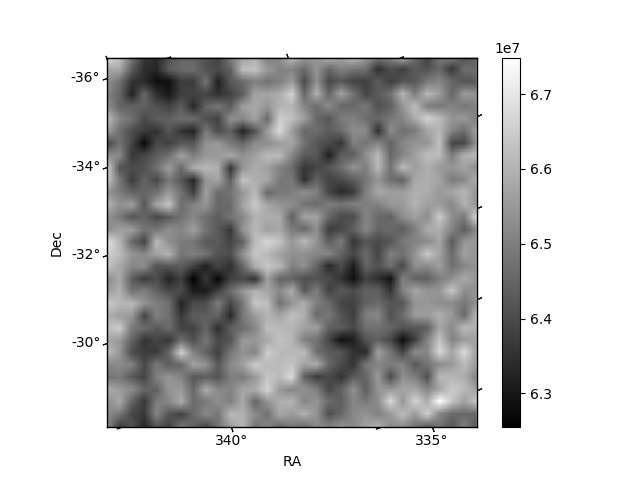
Histogram calculated using DETX and DETY for each event in the final _common_clean file
| Quadrant A | 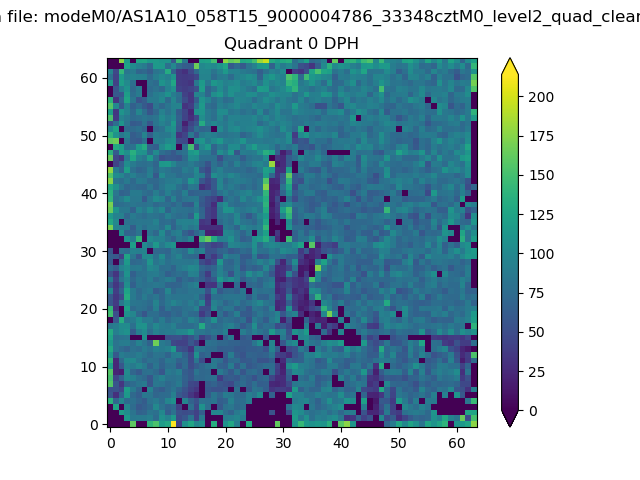 |
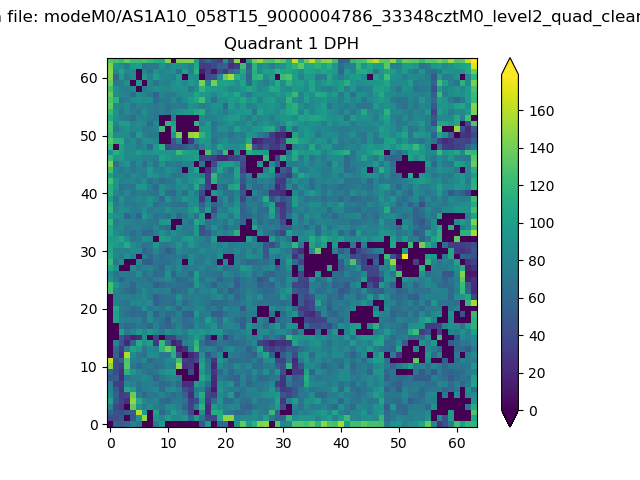 |
Quadrant B |
|---|---|---|---|
| Quadrant D | 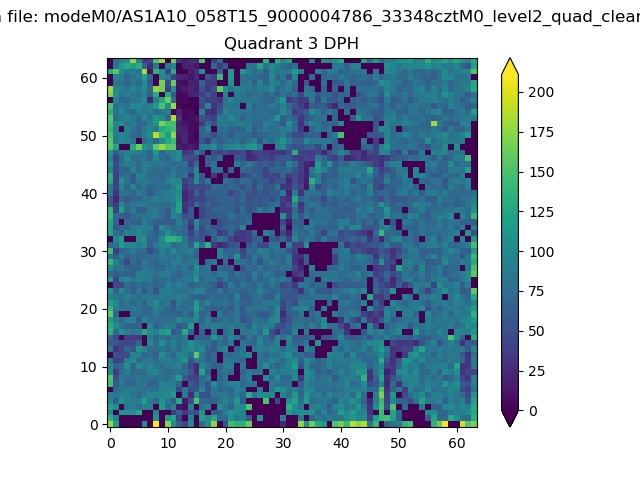 |
 |
Quadrant C |
| Plot type | Count rate plots | Images |
|---|---|---|
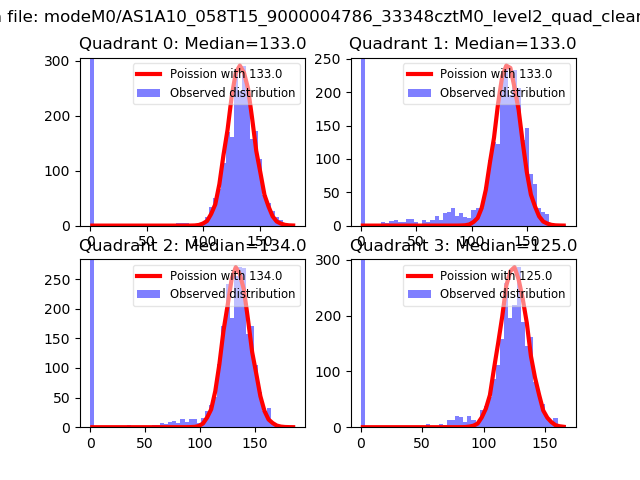
| Comparison with Poisson distribution Blue bars denote a histogram of data divided into 1 sec bins. Red curve is a Poisson curve with rate = median count rate of data. |
 |
 |
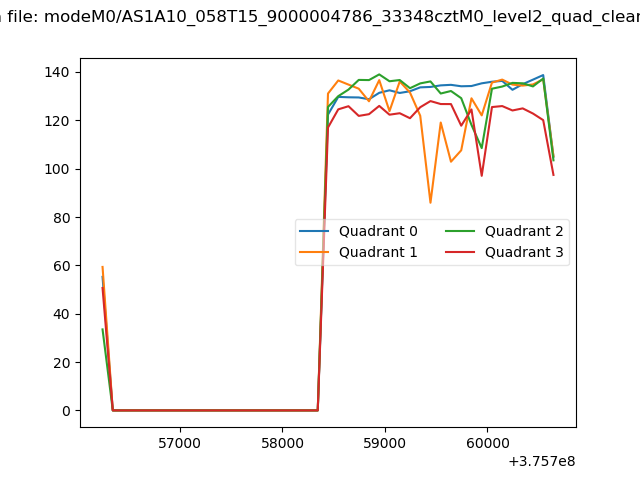
| Quadrant-wise count rates Data is divided into 100 sec bins |
 |
|
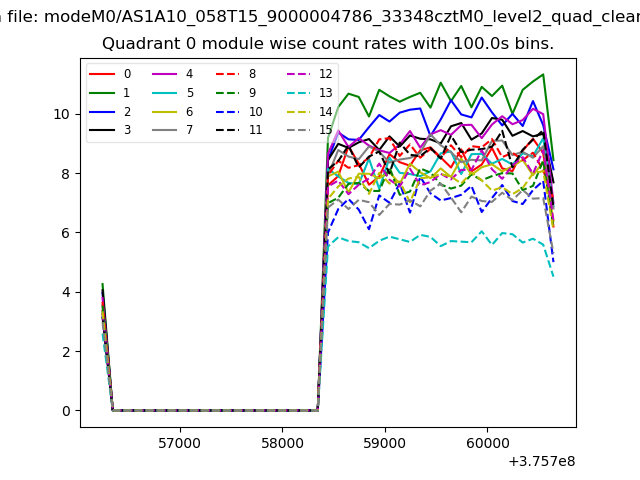
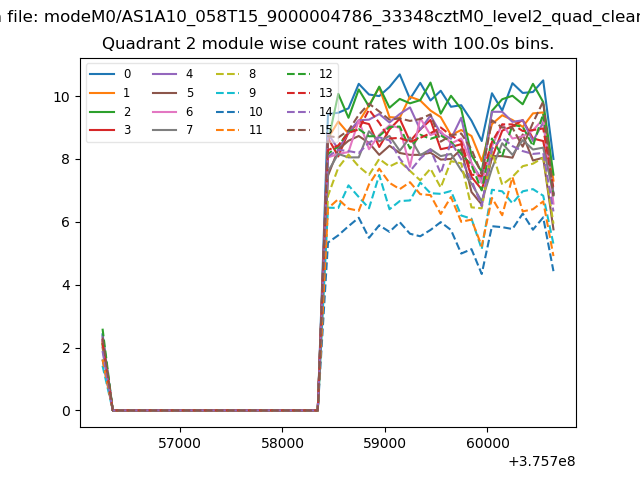
| Module-wise count rates for Quadrant A Data is divided into 100 sec bins |
 |
 |
| Module-wise count rates for Quadrant B Data is divided into 100 sec bins |
 |
 |
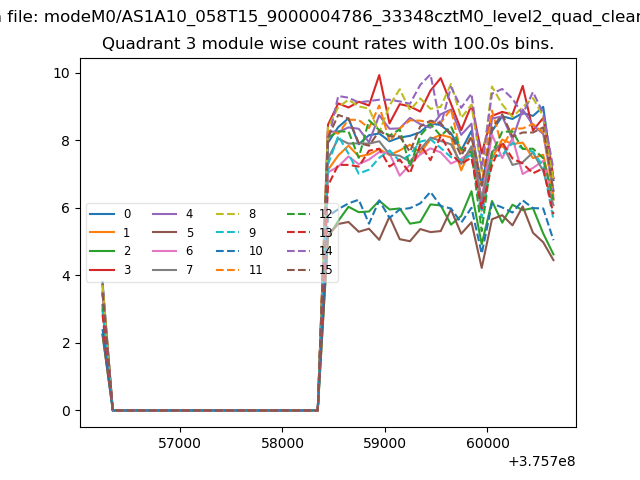
| Module-wise count rates for Quadrant C Data is divided into 100 sec bins |
 |
 |
| Module-wise count rates for Quadrant D Data is divided into 100 sec bins |
 |
 |
| Parameter | Plot |
|---|---|
| CZT HV Monitor | 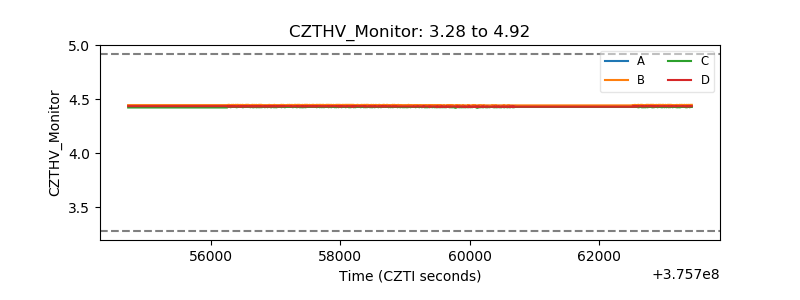 |
| D_VDD | 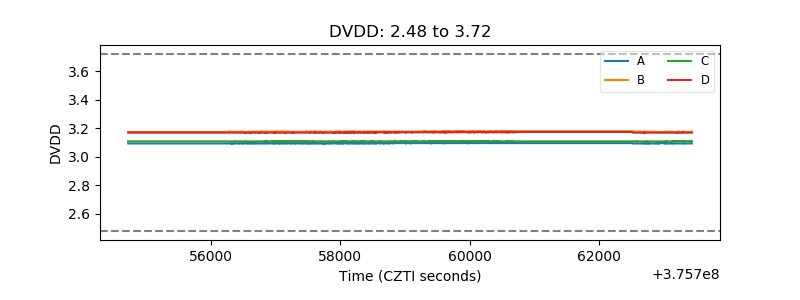 |
| Temperature 1 | 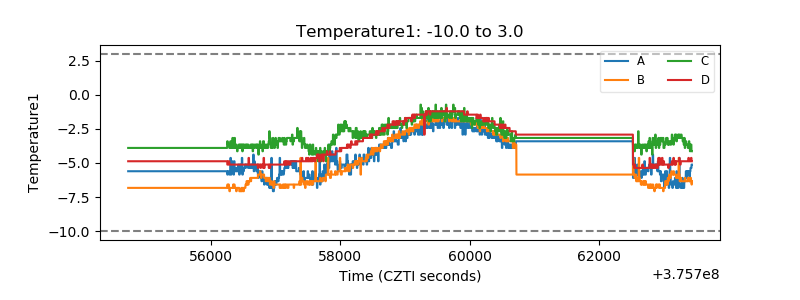 |
| Veto HV Monitor |  |
| Veto LLD | 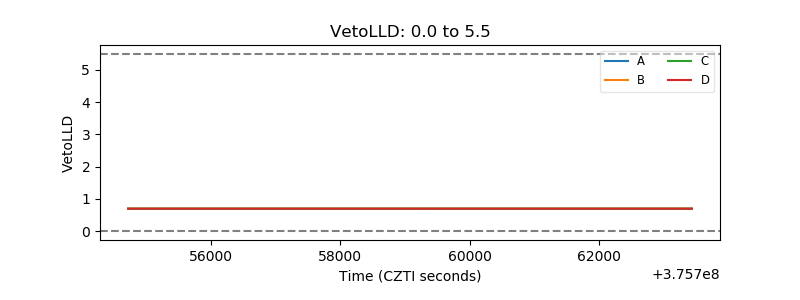 |
| Alpha Counter | 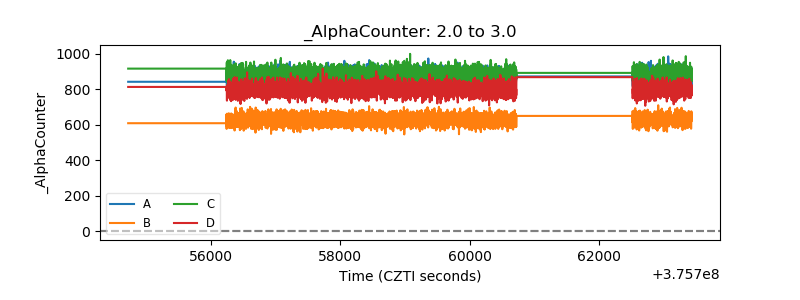 |
| _CPM_Rate | 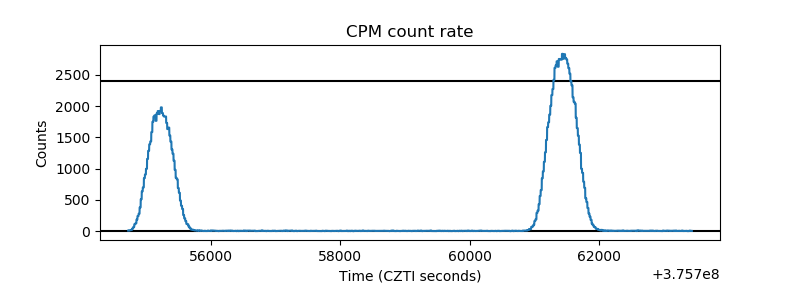 |
| CZT Counter | 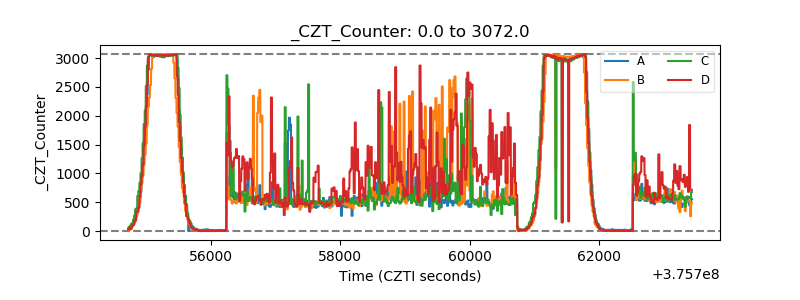 |
| +2.5 Volts monitor | 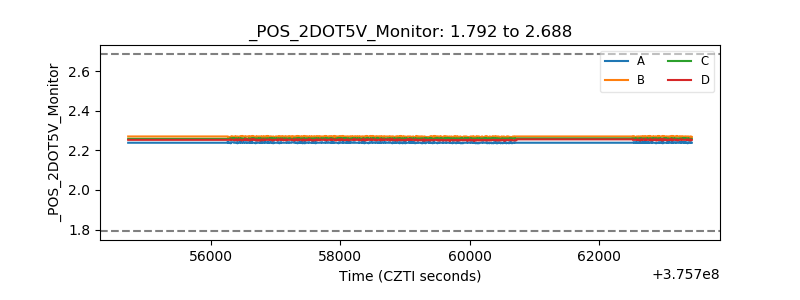 |
| +5 Volts monitor | 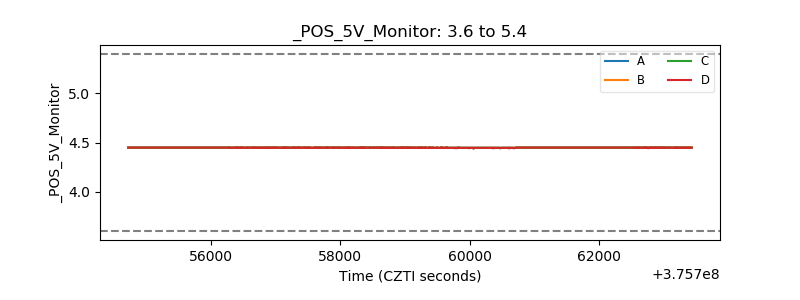 |
| _ROLL_ROT | 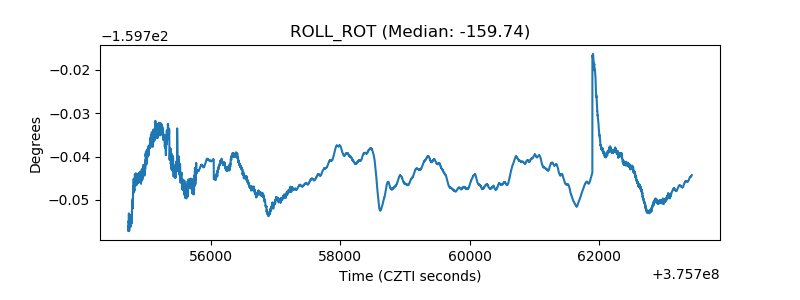 |
| _Roll_DEC | 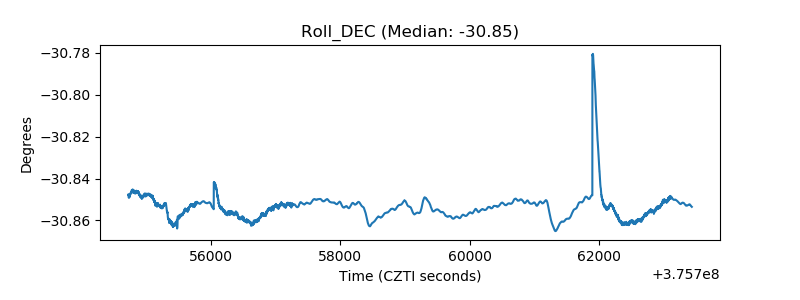 |
| _Roll_RA | 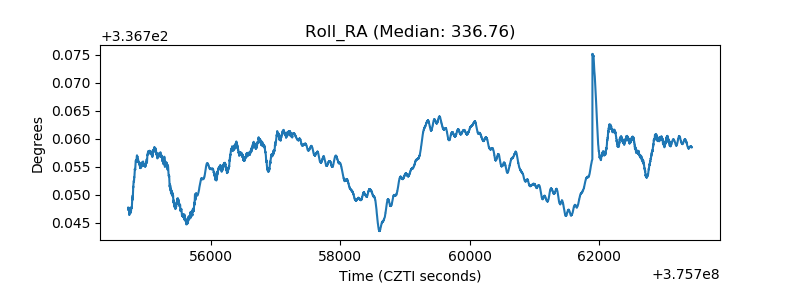 |
| Veto Counter | 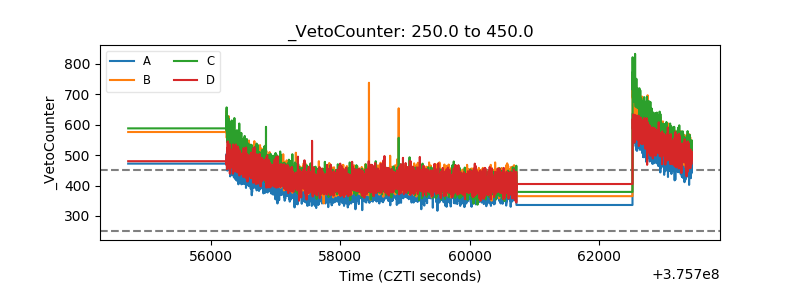 |