| Param | Original file | Final file |
|---|---|---|
| Filename | modeM0/AS1A10_058T15_9000004786_33349cztM0_level2.evt | modeM0/AS1A10_058T15_9000004786_33349cztM0_level2_quad_clean.evt |
| Size (bytes) | 531,046,080 | 57,689,280 |
| Size | 506.4 MB | 55.0 MB |
| Events in quadrant A | 2,941,965 | 358,051 |
| Events in quadrant B | 4,334,767 | 334,664 |
| Events in quadrant C | 3,262,759 | 361,823 |
| Events in quadrant D | 5,197,587 | 333,623 |
| Mode M0 | |||
|---|---|---|---|
| Quadrant | BADHDUFLAG | Total packets | Discarded packets |
| A | 0 | 11688 | 3 |
| B | 0 | 16287 | 2 |
| C | 0 | 13118 | 2 |
| D | 0 | 19026 | 2 |
| Mode M9 | |||
|---|---|---|---|
| Quadrant | BADHDUFLAG | Total packets | Discarded packets |
| A | 0 | 31 | 0 |
| B | 0 | 31 | 0 |
| C | 0 | 31 | 0 |
| D | 0 | 32 | 0 |
| Mode SS | |||
|---|---|---|---|
| Quadrant | BADHDUFLAG | Total packets | Discarded packets |
| A | 0 | 106 | 0 |
| B | 0 | 106 | 0 |
| C | 0 | 106 | 0 |
| D | 0 | 106 | 0 |
| Quadrant | Total seconds | Saturated seconds | Saturation percentage |
|---|---|---|---|
| A | 5105 | 111 | 2.174339% |
| B | 5105 | 451 | 8.834476% |
| C | 5105 | 52 | 1.018609% |
| D | 5105 | 384 | 7.522037% |
Noise dominated data is calculated using 1-second bins in cleaned event files. If a bin has >2000 counts, and if more than 50% of those come from <1% of pixels, then it is considered to be noise-dominated and hence unusable.
| Quadrant | # 1 sec bins | Bins with >0 counts | Bins with >2000 counts | High rate bins dominated by noise | Noise dominated (total time) | Noise dominated (detector-on time) | Marked lightcurve |
|---|---|---|---|---|---|---|---|
| A | 7045 | 5105 | 85 | 85 | 1.21% | 1.67% | 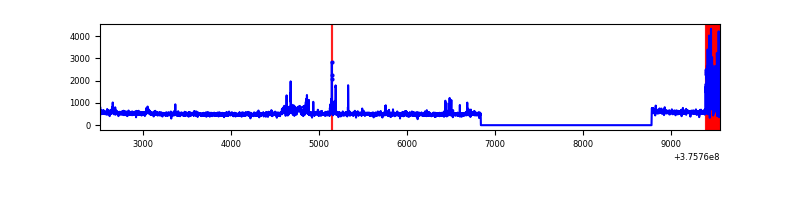 |
| B | 7046 | 5106 | 332 | 332 | 4.71% | 6.50% | 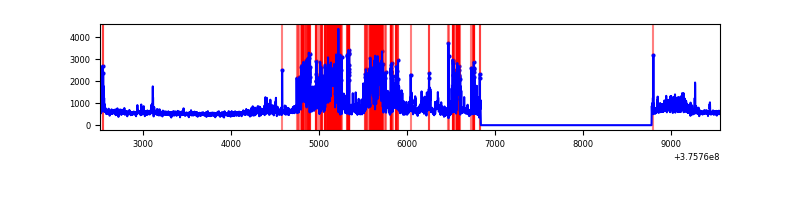 |
| C | 7046 | 5106 | 38 | 38 | 0.54% | 0.74% | 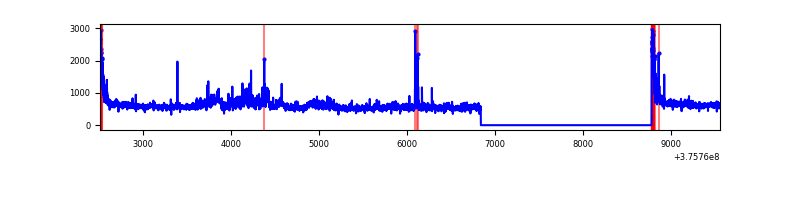 |
| D | 7046 | 5106 | 373 | 373 | 5.29% | 7.31% | 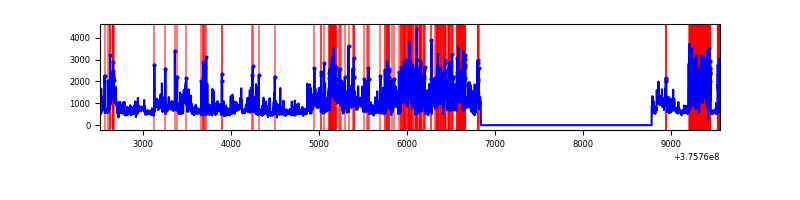 |
Top three noisy pixels from each quadrant. If the there are fewer than three noisy pixels in the level2.evt file, extra rows are filled as -1
| Pixel properties | Quadrant properties | ||||||
|---|---|---|---|---|---|---|---|
| Quadrant | DetID | PixID | Counts | Sigma | Mean | Median | Sigma |
| A | 15 | 169 | 365171 | 2787.25 | 663 | 650 | 130.8 |
| A | 13 | 254 | 7979 | 56.04 | 663 | 650 | 130.8 |
| A | 14 | 254 | 5894 | 40.09 | 663 | 650 | 130.8 |
| B | 5 | 172 | 912233 | 7481.14 | 650 | 635 | 121.9 |
| B | 0 | 190 | 509677 | 4177.52 | 650 | 635 | 121.9 |
| B | 0 | 219 | 295399 | 2419.02 | 650 | 635 | 121.9 |
| C | 10 | 49 | 269903 | 1820.34 | 653 | 659 | 147.9 |
| C | 15 | 214 | 223920 | 1509.45 | 653 | 659 | 147.9 |
| C | 0 | 10 | 145080 | 976.42 | 653 | 659 | 147.9 |
| D | 1 | 52 | 1010195 | 6489.92 | 640 | 623 | 155.6 |
| D | 8 | 195 | 849358 | 5455.99 | 640 | 623 | 155.6 |
| D | 2 | 250 | 493287 | 3167.03 | 640 | 623 | 155.6 |
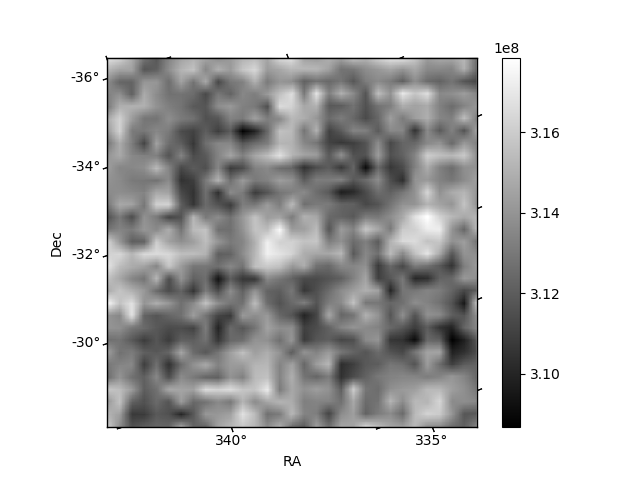
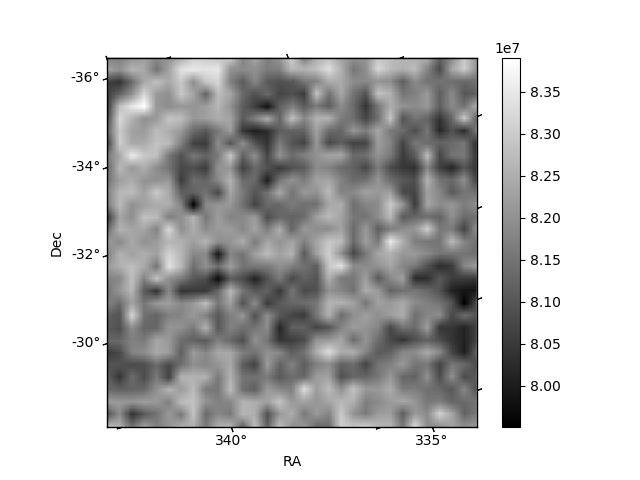
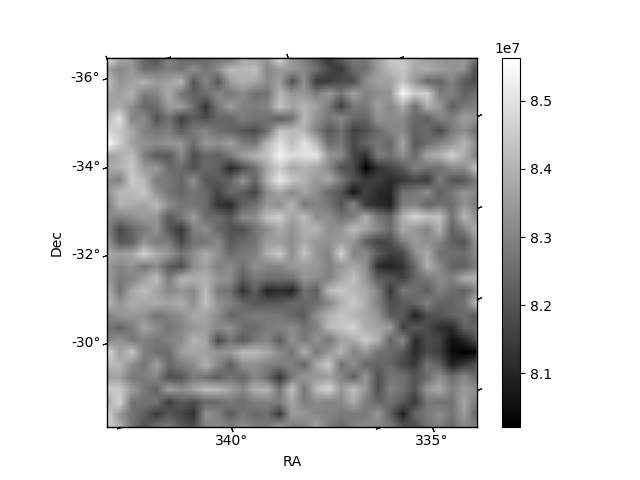
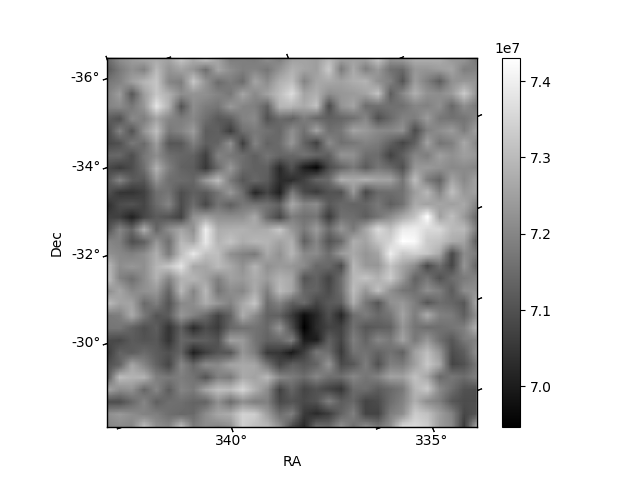
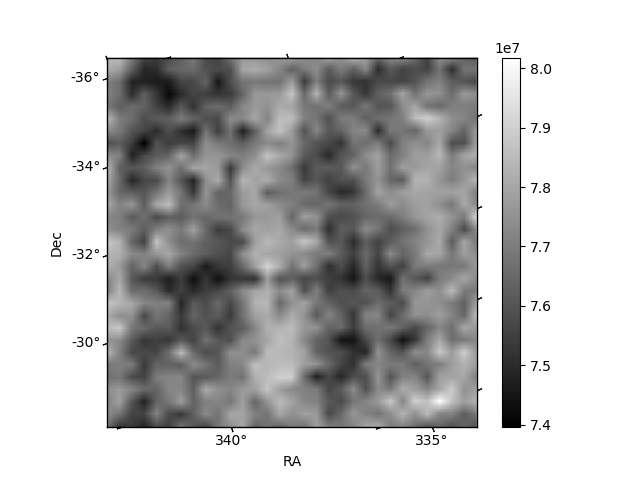
Histogram calculated using DETX and DETY for each event in the final _common_clean file
| Quadrant A | 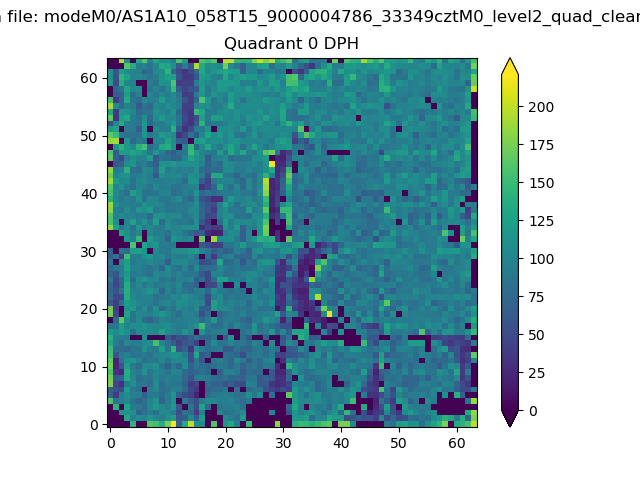 |
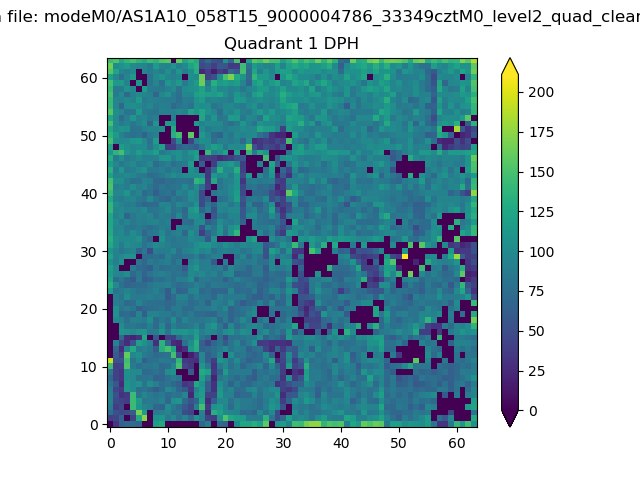 |
Quadrant B |
|---|---|---|---|
| Quadrant D | 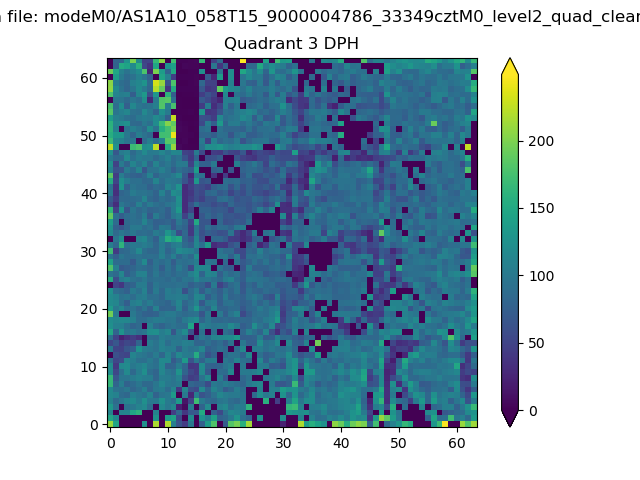 |
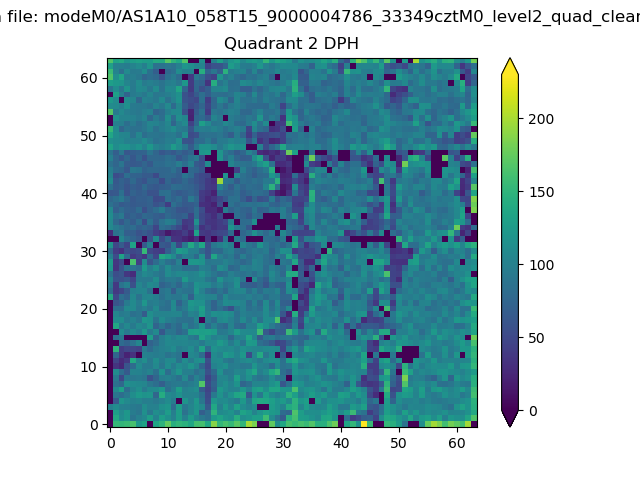 |
Quadrant C |
| Plot type | Count rate plots | Images |
|---|---|---|
| Comparison with Poisson distribution Blue bars denote a histogram of data divided into 1 sec bins. Red curve is a Poisson curve with rate = median count rate of data. |
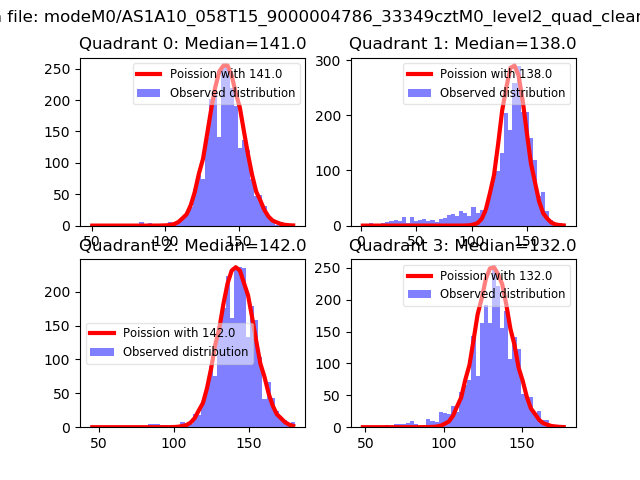 |
 |
| Quadrant-wise count rates Data is divided into 100 sec bins |
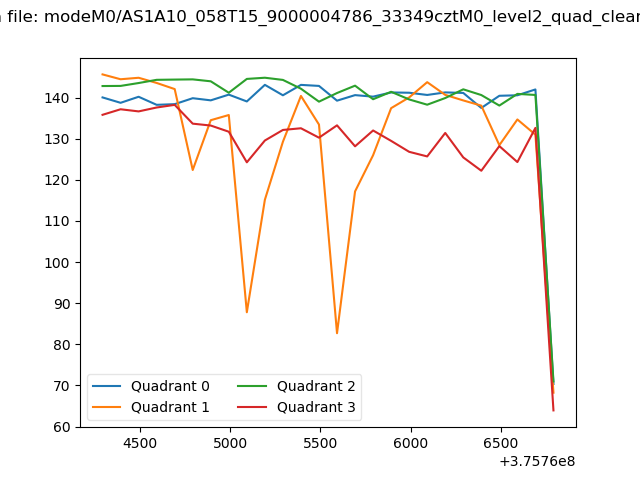 |
|
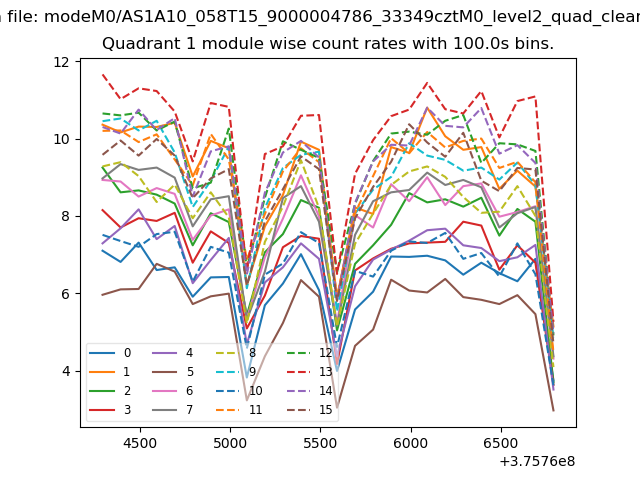
| Module-wise count rates for Quadrant A Data is divided into 100 sec bins |
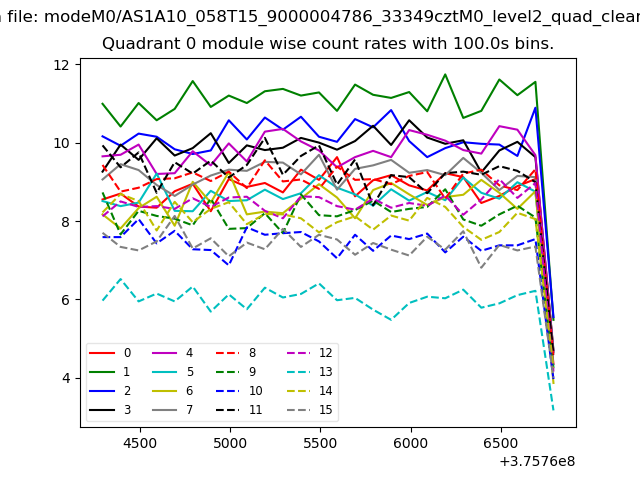 |
 |
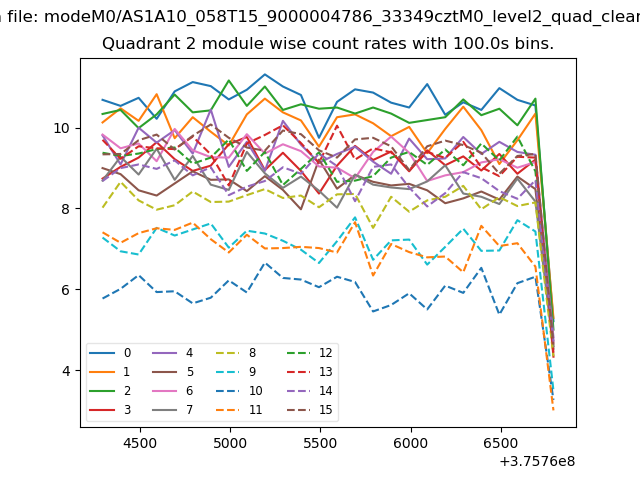
| Module-wise count rates for Quadrant B Data is divided into 100 sec bins |
 |
 |
| Module-wise count rates for Quadrant C Data is divided into 100 sec bins |
 |
 |
| Module-wise count rates for Quadrant D Data is divided into 100 sec bins |
 |
 |
| Parameter | Plot |
|---|---|
| CZT HV Monitor | 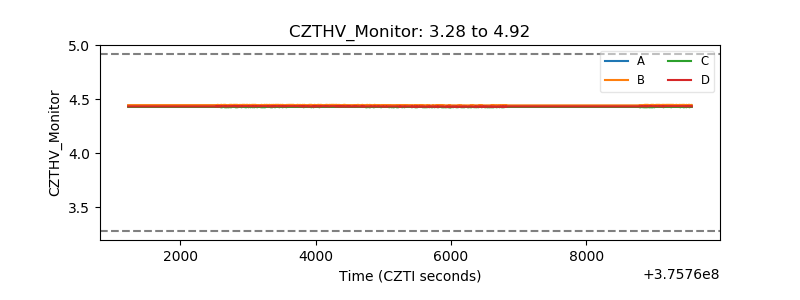 |
| D_VDD | 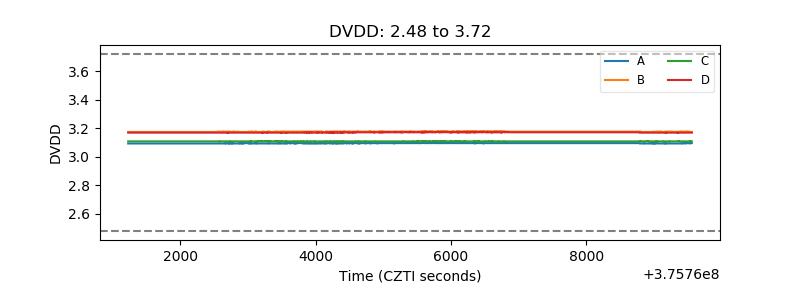 |
| Temperature 1 | 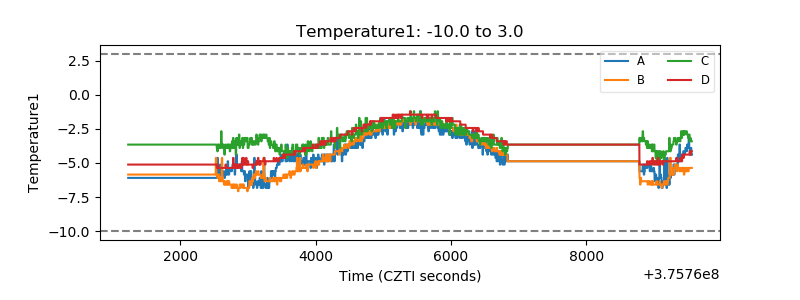 |
| Veto HV Monitor | 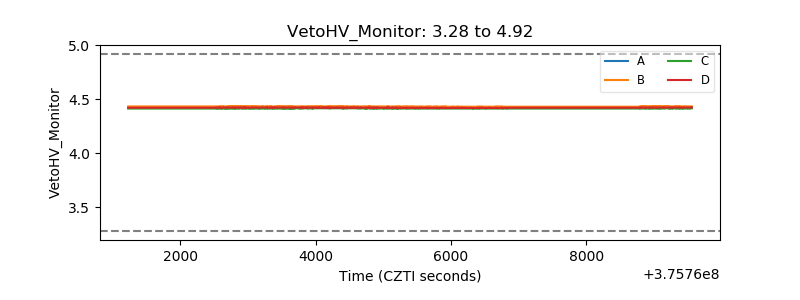 |
| Veto LLD | 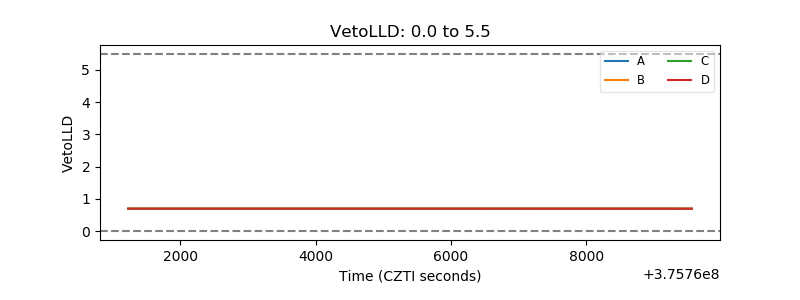 |
| Alpha Counter |  |
| _CPM_Rate | 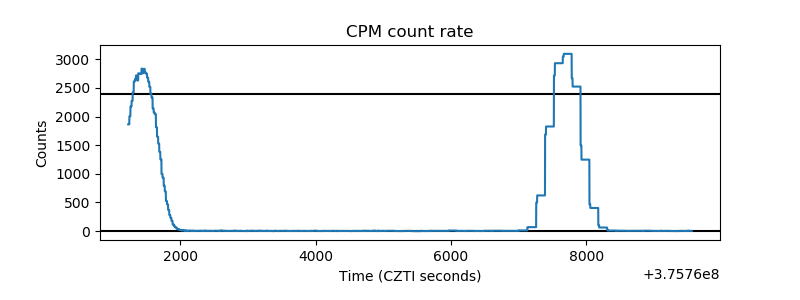 |
| CZT Counter | 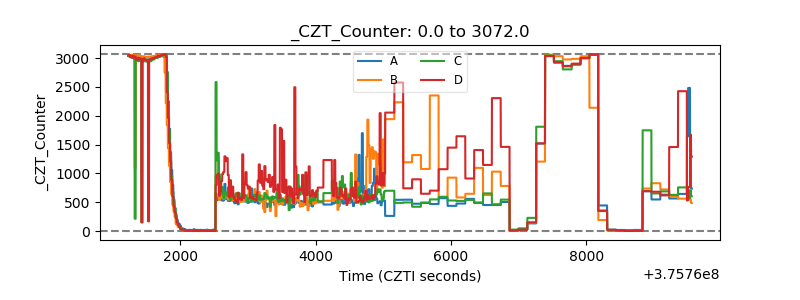 |
| +2.5 Volts monitor |  |
| +5 Volts monitor |  |
| _ROLL_ROT | 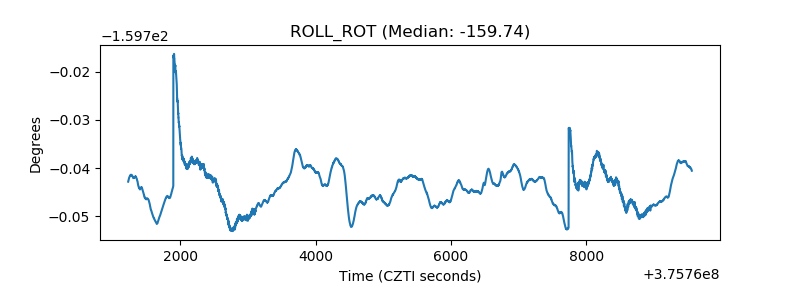 |
| _Roll_DEC |  |
| _Roll_RA | 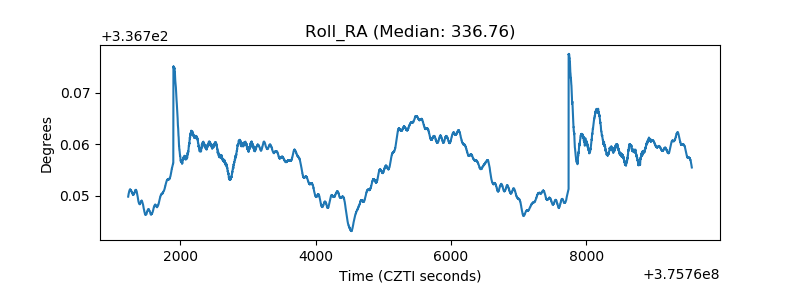 |
| Veto Counter | 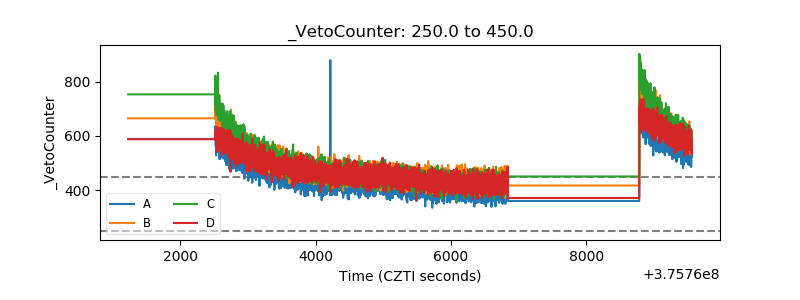 |