| Param | Original file | Final file |
|---|---|---|
| Filename | modeM0/AS1A10_058T15_9000004786_33351cztM0_level2.evt | modeM0/AS1A10_058T15_9000004786_33351cztM0_level2_quad_clean.evt |
| Size (bytes) | 589,881,600 | 81,478,080 |
| Size | 562.6 MB | 77.7 MB |
| Events in quadrant A | 2,813,386 | 548,585 |
| Events in quadrant B | 3,642,924 | 545,447 |
| Events in quadrant C | 3,724,605 | 546,402 |
| Events in quadrant D | 7,349,060 | 478,751 |
| Mode M0 | |||
|---|---|---|---|
| Quadrant | BADHDUFLAG | Total packets | Discarded packets |
| A | 0 | 11438 | 3 |
| B | 0 | 14221 | 2 |
| C | 0 | 14311 | 2 |
| D | 0 | 25373 | 2 |
| Mode M9 | |||
|---|---|---|---|
| Quadrant | BADHDUFLAG | Total packets | Discarded packets |
| A | 0 | 32 | 0 |
| B | 0 | 32 | 0 |
| C | 0 | 32 | 0 |
| D | 0 | 33 | 0 |
| Mode SS | |||
|---|---|---|---|
| Quadrant | BADHDUFLAG | Total packets | Discarded packets |
| A | 0 | 102 | 0 |
| B | 0 | 102 | 0 |
| C | 0 | 102 | 0 |
| D | 0 | 102 | 0 |
| Quadrant | Total seconds | Saturated seconds | Saturation percentage |
|---|---|---|---|
| A | 4959 | 21 | 0.423472% |
| B | 4959 | 220 | 4.436378% |
| C | 4959 | 113 | 2.278685% |
| D | 4959 | 1040 | 20.971970% |
Noise dominated data is calculated using 1-second bins in cleaned event files. If a bin has >2000 counts, and if more than 50% of those come from <1% of pixels, then it is considered to be noise-dominated and hence unusable.
| Quadrant | # 1 sec bins | Bins with >0 counts | Bins with >2000 counts | High rate bins dominated by noise | Noise dominated (total time) | Noise dominated (detector-on time) | Marked lightcurve |
|---|---|---|---|---|---|---|---|
| A | 7082 | 4960 | 8 | 8 | 0.11% | 0.16% | 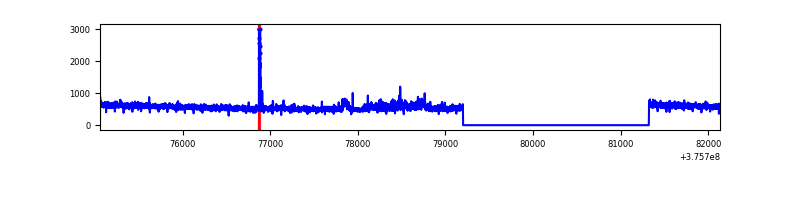 |
| B | 7082 | 4960 | 158 | 158 | 2.23% | 3.19% | 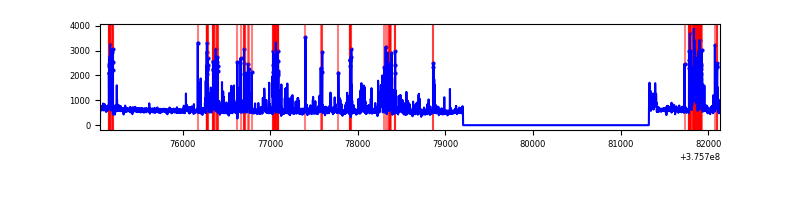 |
| C | 7082 | 4960 | 67 | 67 | 0.95% | 1.35% | 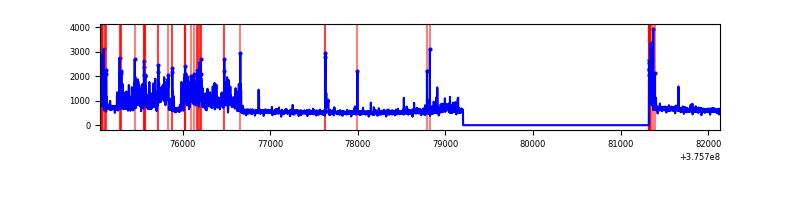 |
| D | 7082 | 4959 | 932 | 932 | 13.16% | 18.79% | 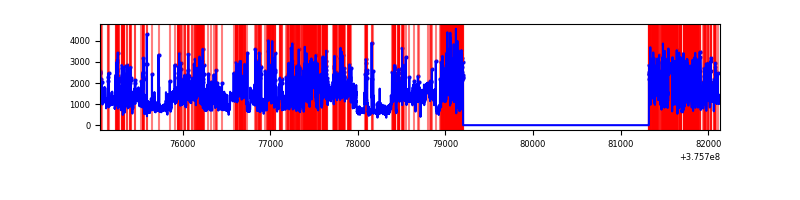 |
Top three noisy pixels from each quadrant. If the there are fewer than three noisy pixels in the level2.evt file, extra rows are filled as -1
| Pixel properties | Quadrant properties | ||||||
|---|---|---|---|---|---|---|---|
| Quadrant | DetID | PixID | Counts | Sigma | Mean | Median | Sigma |
| A | 15 | 169 | 146018 | 1070.62 | 689 | 679 | 135.8 |
| A | 13 | 254 | 7008 | 46.62 | 689 | 679 | 135.8 |
| A | 0 | 226 | 5880 | 38.31 | 689 | 679 | 135.8 |
| B | 5 | 172 | 400060 | 3209.68 | 674 | 662 | 124.4 |
| B | 15 | 201 | 206756 | 1656.23 | 674 | 662 | 124.4 |
| B | 0 | 219 | 134596 | 1076.33 | 674 | 662 | 124.4 |
| C | 10 | 49 | 664391 | 4461.02 | 659 | 667 | 148.8 |
| C | 15 | 214 | 218467 | 1463.87 | 659 | 667 | 148.8 |
| C | 0 | 10 | 124834 | 834.55 | 659 | 667 | 148.8 |
| D | 8 | 195 | 1882946 | 11186.83 | 620 | 608 | 168.3 |
| D | 1 | 52 | 1731209 | 10285.05 | 620 | 608 | 168.3 |
| D | 12 | 218 | 332152 | 1970.38 | 620 | 608 | 168.3 |
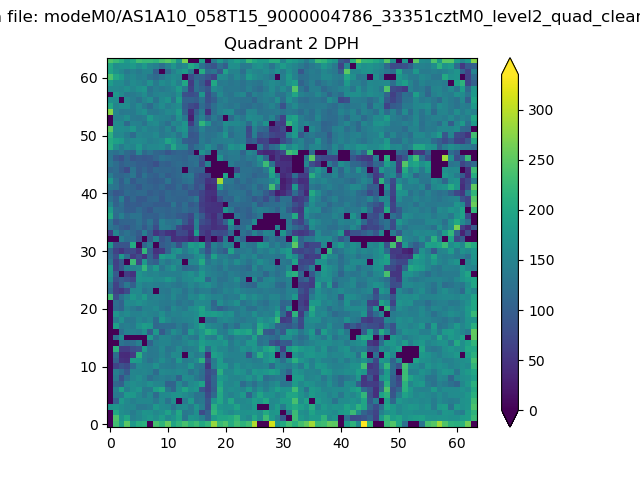
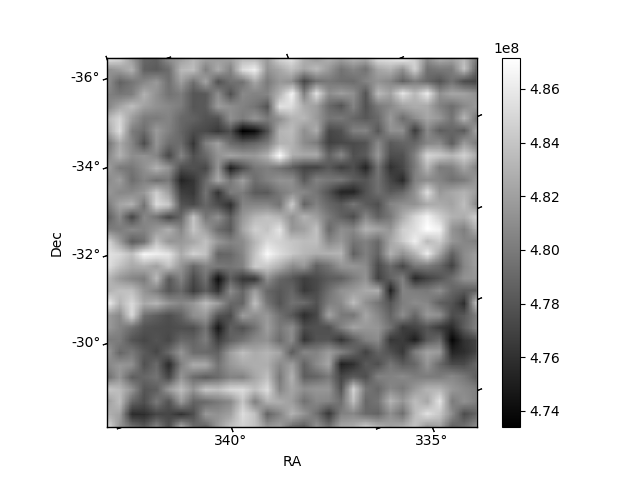
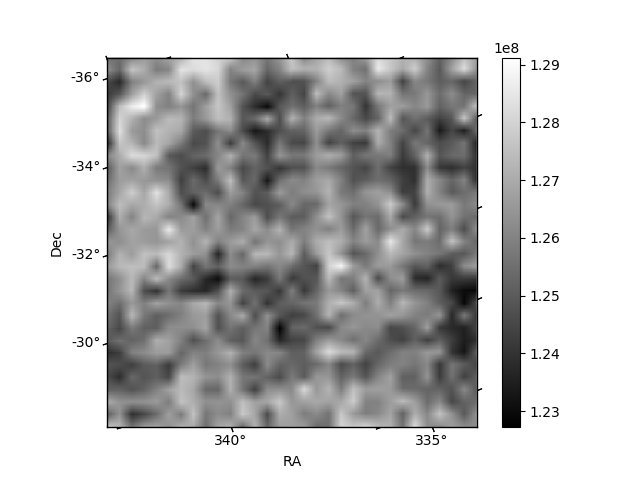
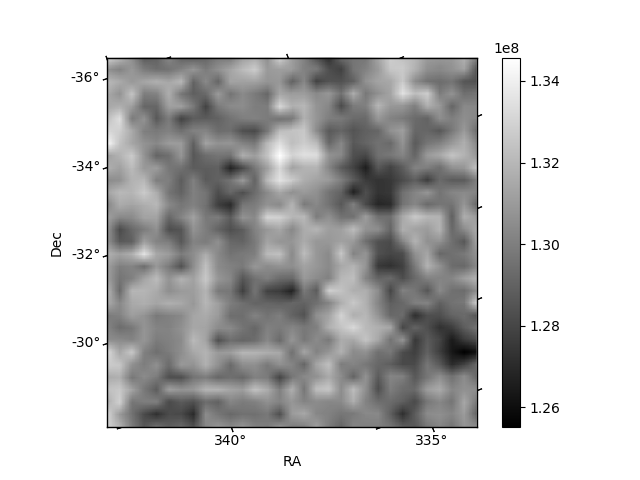
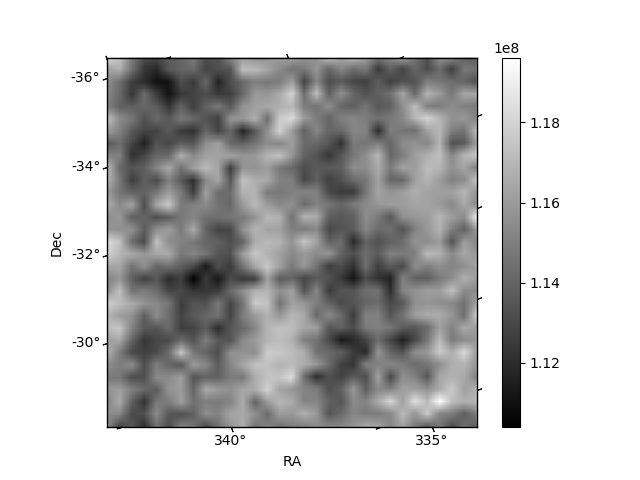
Histogram calculated using DETX and DETY for each event in the final _common_clean file
| Quadrant A | 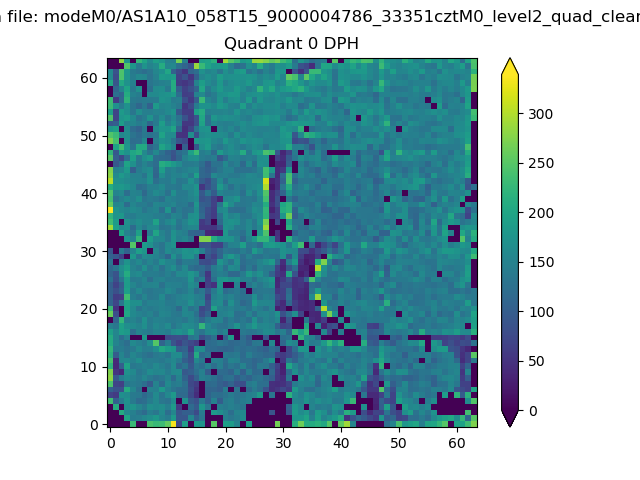 |
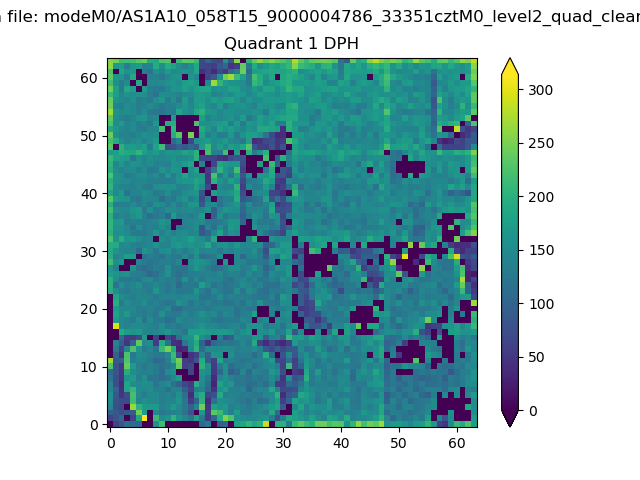 |
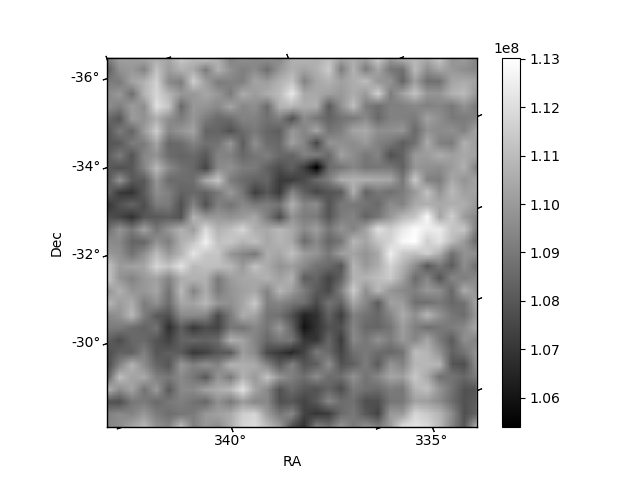
Quadrant B |
|---|---|---|---|
| Quadrant D | 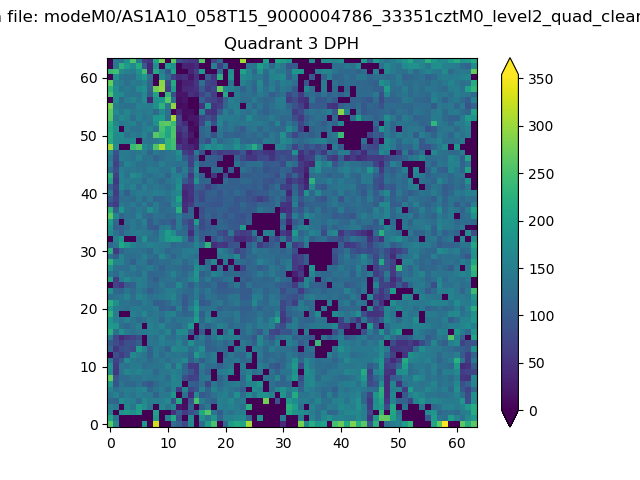 |
 |
Quadrant C |
| Plot type | Count rate plots | Images |
|---|---|---|
| Comparison with Poisson distribution Blue bars denote a histogram of data divided into 1 sec bins. Red curve is a Poisson curve with rate = median count rate of data. |
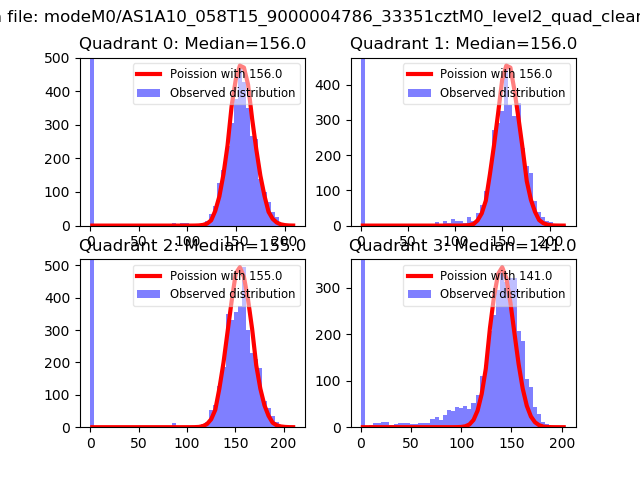 |
 |
| Quadrant-wise count rates Data is divided into 100 sec bins |
 |
|
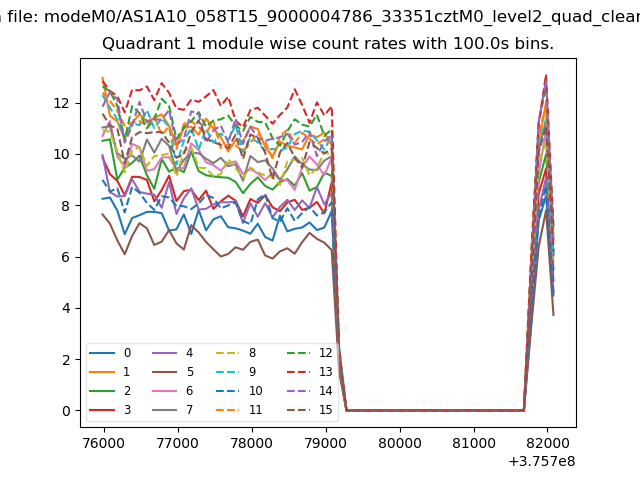
| Module-wise count rates for Quadrant A Data is divided into 100 sec bins |
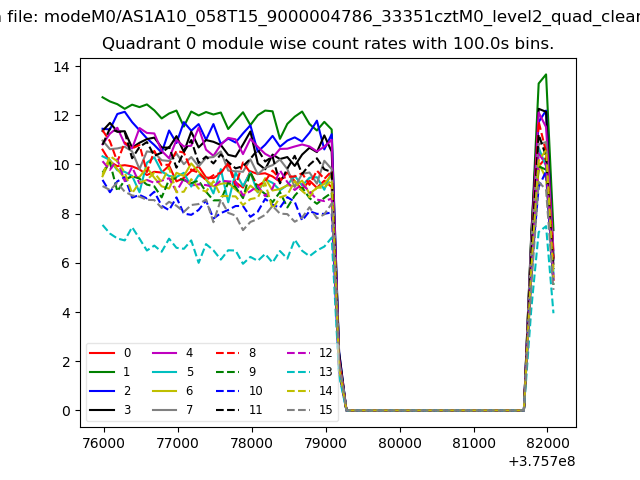 |
 |
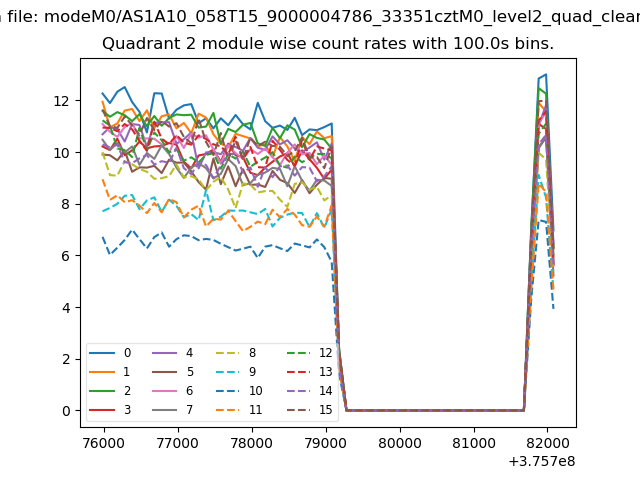
| Module-wise count rates for Quadrant B Data is divided into 100 sec bins |
 |
 |
| Module-wise count rates for Quadrant C Data is divided into 100 sec bins |
 |
 |
| Module-wise count rates for Quadrant D Data is divided into 100 sec bins |
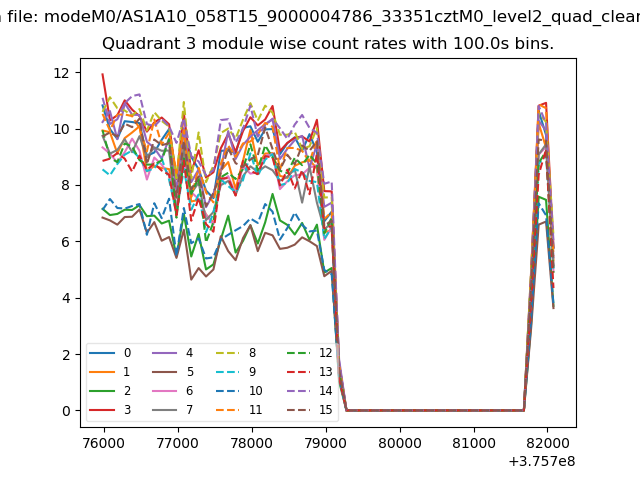 |
 |
| Parameter | Plot |
|---|---|
| CZT HV Monitor | 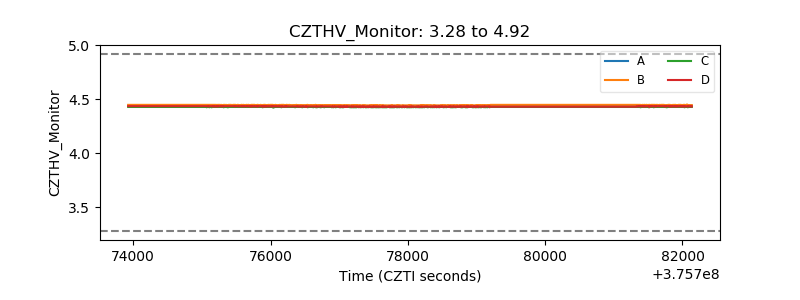 |
| D_VDD | 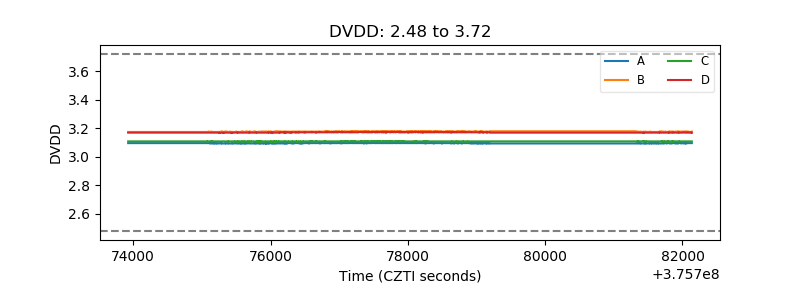 |
| Temperature 1 | 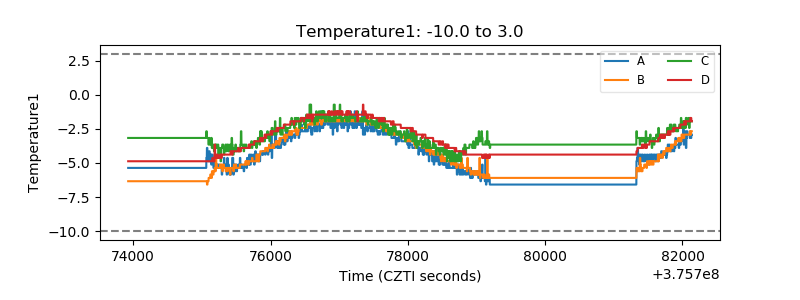 |
| Veto HV Monitor | 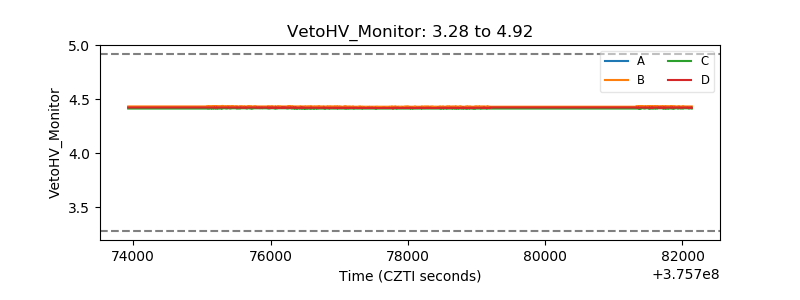 |
| Veto LLD | 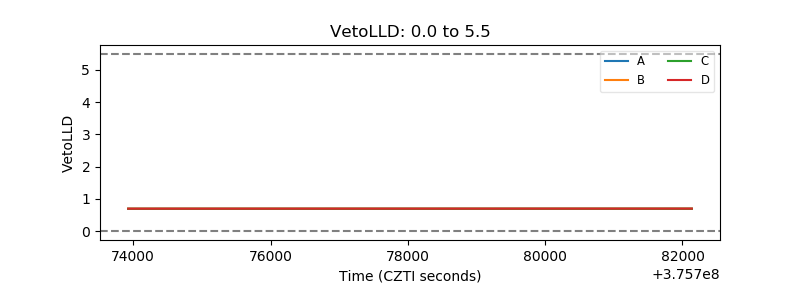 |
| Alpha Counter |  |
| _CPM_Rate | 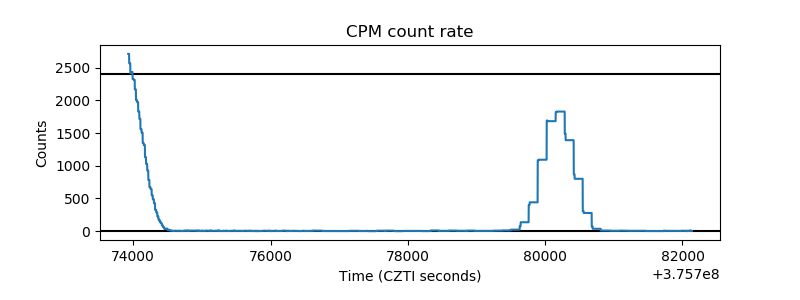 |
| CZT Counter | 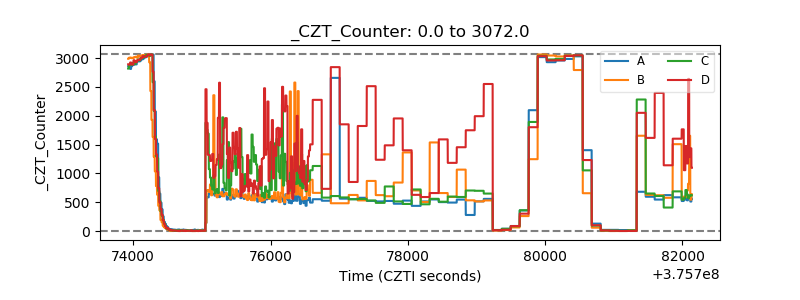 |
| +2.5 Volts monitor |  |
| +5 Volts monitor |  |
| _ROLL_ROT | 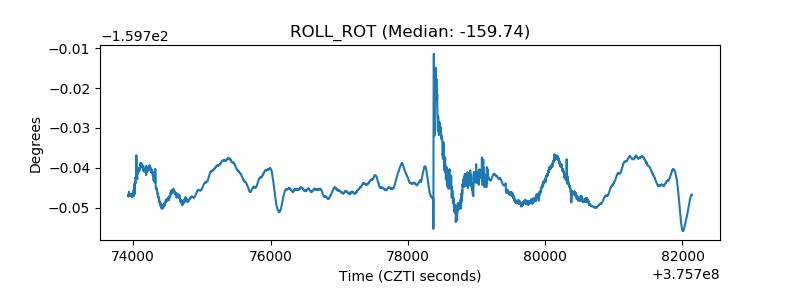 |
| _Roll_DEC | 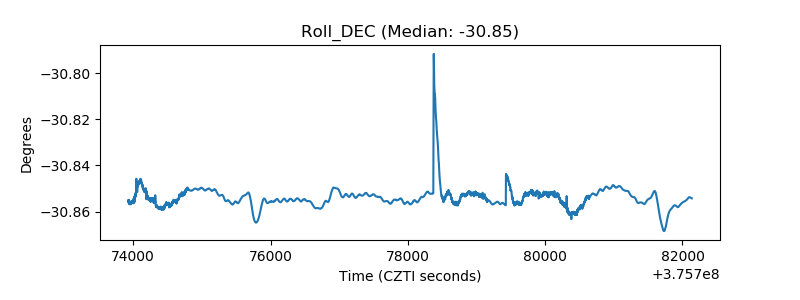 |
| _Roll_RA | 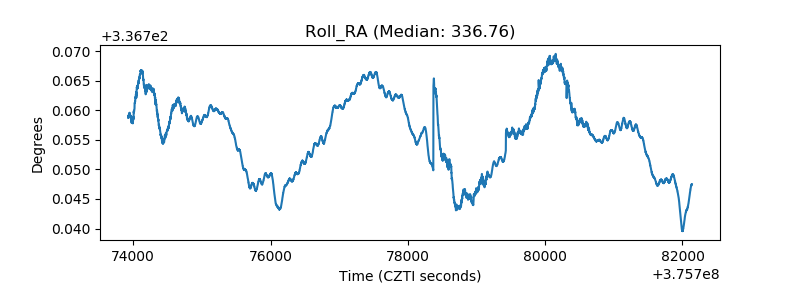 |
| Veto Counter | 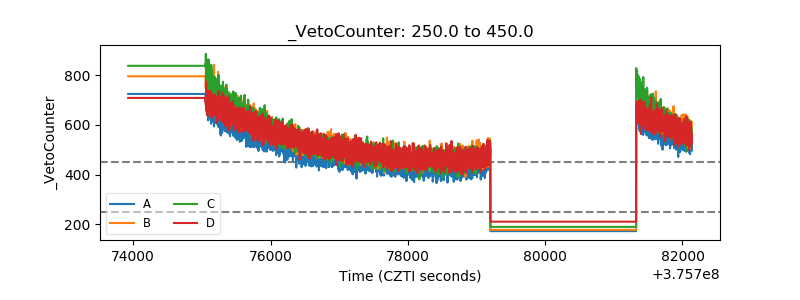 |