| Param | Original file | Final file |
|---|---|---|
| Filename | modeM0/AS1A10_058T15_9000004786_33353cztM0_level2.evt | modeM0/AS1A10_058T15_9000004786_33353cztM0_level2_quad_clean.evt |
| Size (bytes) | 573,048,000 | 93,732,480 |
| Size | 546.5 MB | 89.4 MB |
| Events in quadrant A | 2,490,656 | 650,069 |
| Events in quadrant B | 3,833,034 | 640,980 |
| Events in quadrant C | 3,495,885 | 634,873 |
| Events in quadrant D | 7,195,977 | 560,306 |
| Mode M0 | |||
|---|---|---|---|
| Quadrant | BADHDUFLAG | Total packets | Discarded packets |
| A | 0 | 10316 | 3 |
| B | 0 | 14652 | 2 |
| C | 0 | 13463 | 2 |
| D | 0 | 24911 | 2 |
| Mode M9 | |||
|---|---|---|---|
| Quadrant | BADHDUFLAG | Total packets | Discarded packets |
| A | 0 | 30 | 0 |
| B | 0 | 30 | 0 |
| C | 0 | 30 | 0 |
| D | 0 | 31 | 0 |
| Mode SS | |||
|---|---|---|---|
| Quadrant | BADHDUFLAG | Total packets | Discarded packets |
| A | 0 | 102 | 0 |
| B | 0 | 102 | 0 |
| C | 0 | 102 | 0 |
| D | 0 | 102 | 0 |
| Quadrant | Total seconds | Saturated seconds | Saturation percentage |
|---|---|---|---|
| A | 5021 | 6 | 0.119498% |
| B | 5021 | 275 | 5.476997% |
| C | 5021 | 234 | 4.660426% |
| D | 5021 | 981 | 19.537941% |
Noise dominated data is calculated using 1-second bins in cleaned event files. If a bin has >2000 counts, and if more than 50% of those come from <1% of pixels, then it is considered to be noise-dominated and hence unusable.
| Quadrant | # 1 sec bins | Bins with >0 counts | Bins with >2000 counts | High rate bins dominated by noise | Noise dominated (total time) | Noise dominated (detector-on time) | Marked lightcurve |
|---|---|---|---|---|---|---|---|
| A | 7084 | 5022 | 1 | 1 | 0.01% | 0.02% | 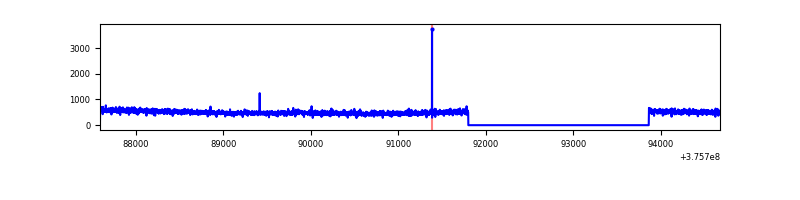 |
| B | 7084 | 5022 | 168 | 168 | 2.37% | 3.35% | 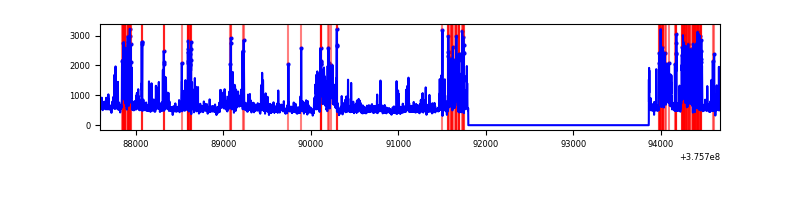 |
| C | 7084 | 5022 | 179 | 179 | 2.53% | 3.56% | 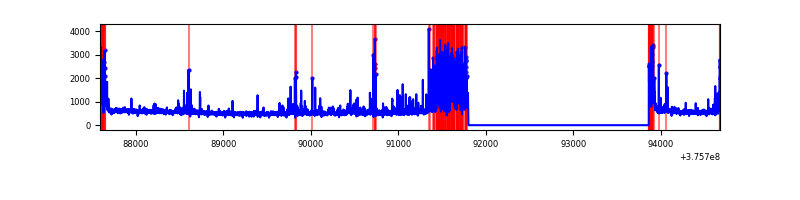 |
| D | 7084 | 5022 | 1003 | 1003 | 14.16% | 19.97% | 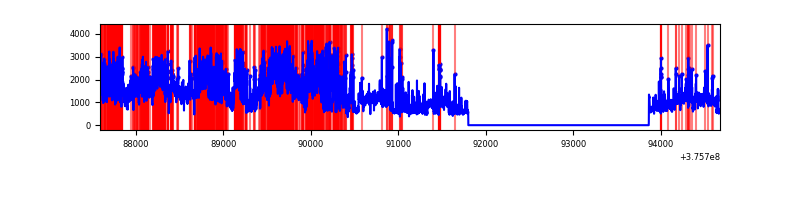 |
Top three noisy pixels from each quadrant. If the there are fewer than three noisy pixels in the level2.evt file, extra rows are filled as -1
| Pixel properties | Quadrant properties | ||||||
|---|---|---|---|---|---|---|---|
| Quadrant | DetID | PixID | Counts | Sigma | Mean | Median | Sigma |
| A | 15 | 169 | 26037 | 201.17 | 634 | 624 | 126.3 |
| A | 13 | 254 | 7454 | 54.07 | 634 | 624 | 126.3 |
| A | 0 | 254 | 6732 | 48.35 | 634 | 624 | 126.3 |
| B | 5 | 172 | 762895 | 6447.96 | 619 | 604 | 118.2 |
| B | 0 | 219 | 336139 | 2838.18 | 619 | 604 | 118.2 |
| B | 0 | 190 | 87378 | 733.99 | 619 | 604 | 118.2 |
| C | 1 | 23 | 603563 | 4431.86 | 593 | 599 | 136.1 |
| C | 0 | 10 | 218315 | 1600.24 | 593 | 599 | 136.1 |
| C | 15 | 214 | 218150 | 1599.03 | 593 | 599 | 136.1 |
| D | 8 | 195 | 1919154 | 12796.06 | 578 | 567 | 149.9 |
| D | 1 | 52 | 1423273 | 9488.77 | 578 | 567 | 149.9 |
| D | 12 | 218 | 849655 | 5663.01 | 578 | 567 | 149.9 |
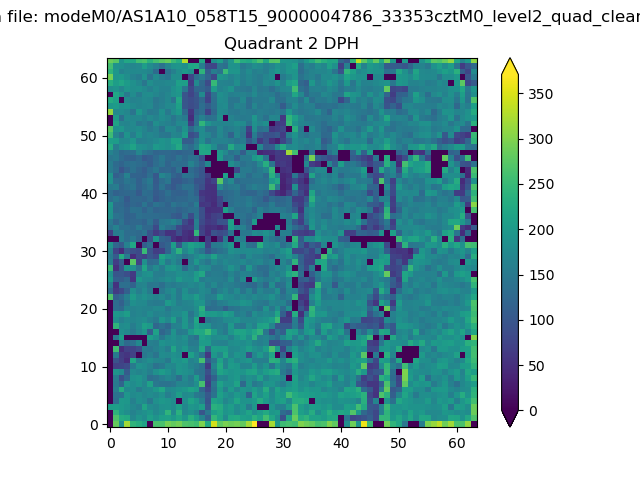
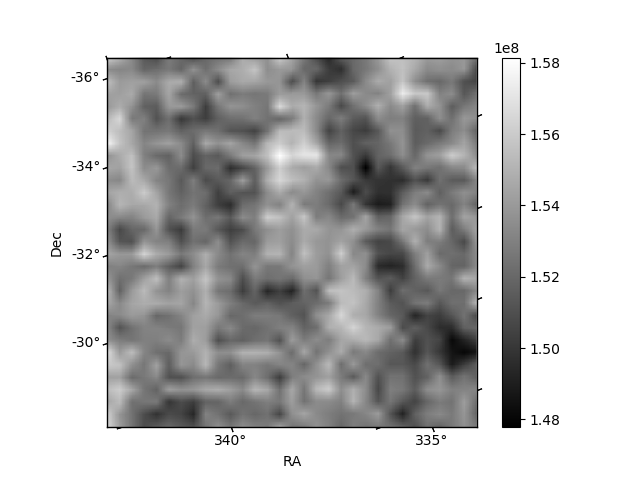
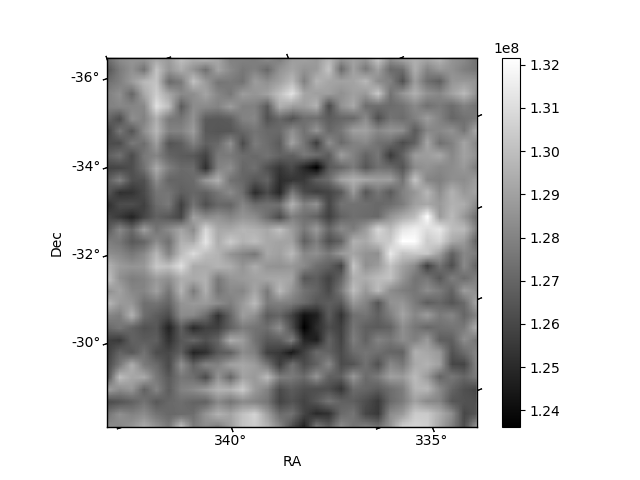
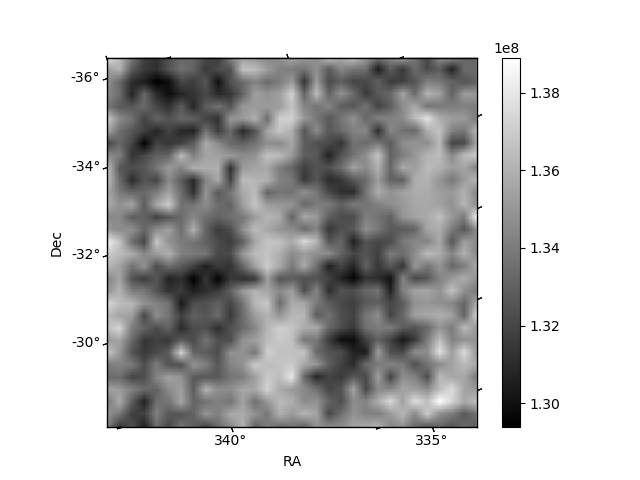
Histogram calculated using DETX and DETY for each event in the final _common_clean file
| Quadrant A | 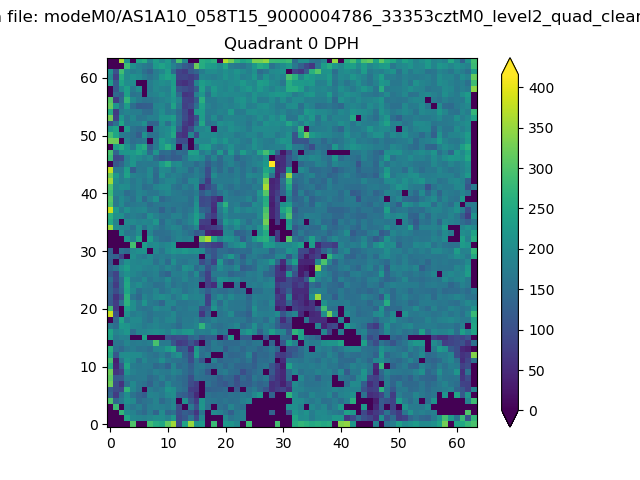 |
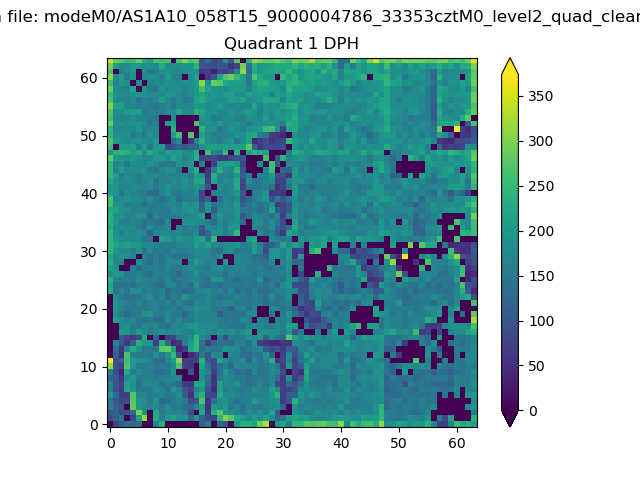 |
Quadrant B |
|---|---|---|---|
| Quadrant D | 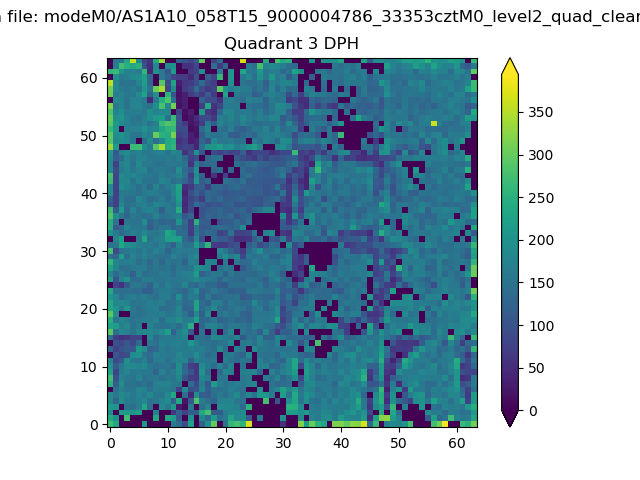 |
 |
Quadrant C |
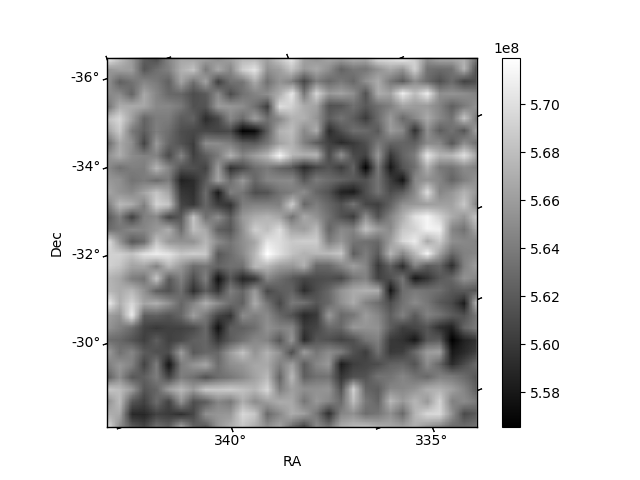
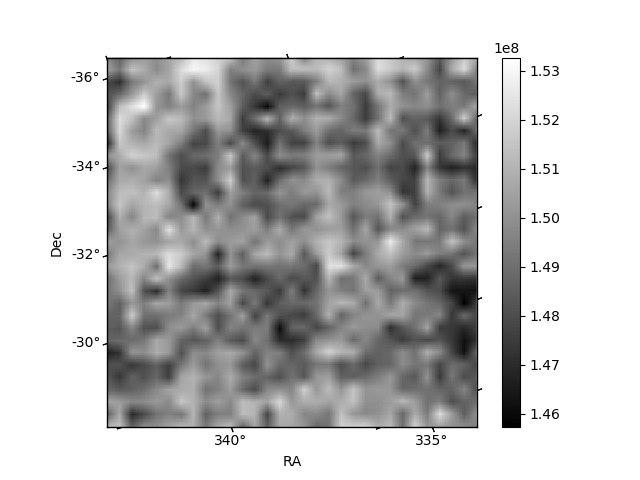
| Plot type | Count rate plots | Images |
|---|---|---|
| Comparison with Poisson distribution Blue bars denote a histogram of data divided into 1 sec bins. Red curve is a Poisson curve with rate = median count rate of data. |
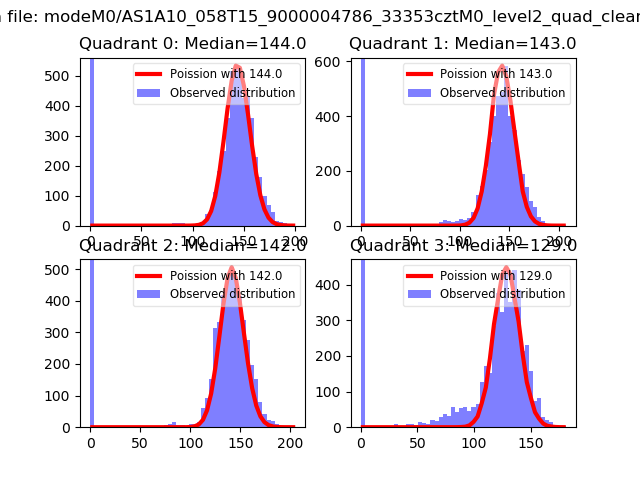 |
 |
| Quadrant-wise count rates Data is divided into 100 sec bins |
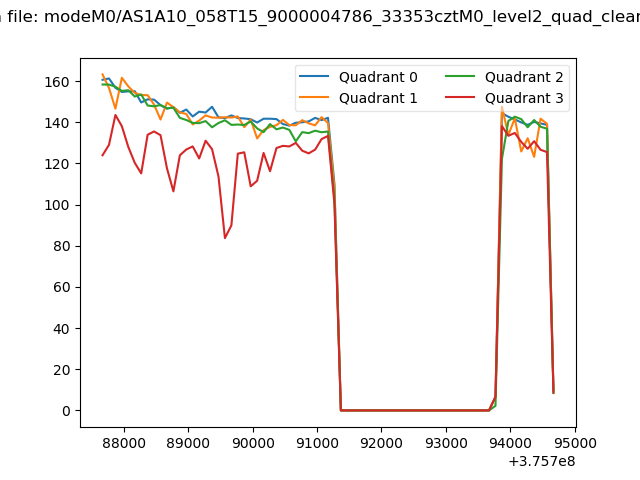 |
|
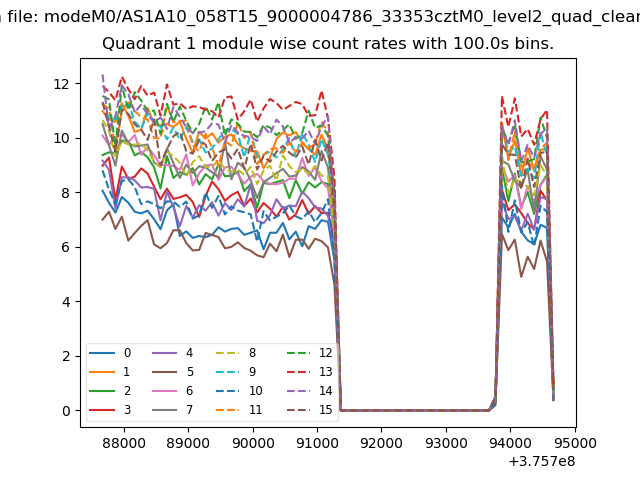
| Module-wise count rates for Quadrant A Data is divided into 100 sec bins |
 |
 |
| Module-wise count rates for Quadrant B Data is divided into 100 sec bins |
 |
 |
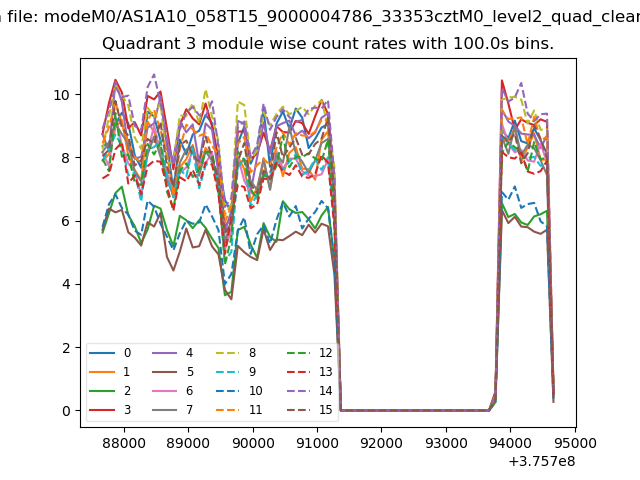
| Module-wise count rates for Quadrant C Data is divided into 100 sec bins |
 |
 |
| Module-wise count rates for Quadrant D Data is divided into 100 sec bins |
 |
 |
| Parameter | Plot |
|---|---|
| CZT HV Monitor |  |
| D_VDD | 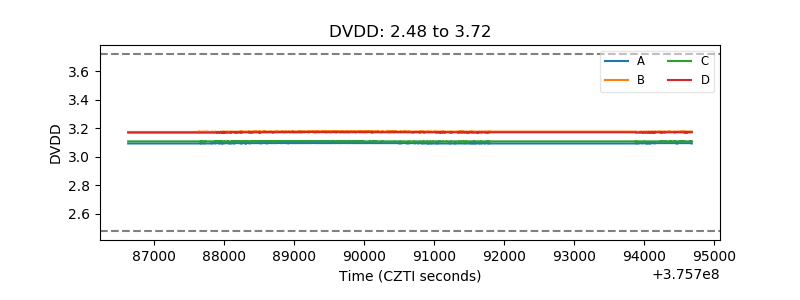 |
| Temperature 1 | 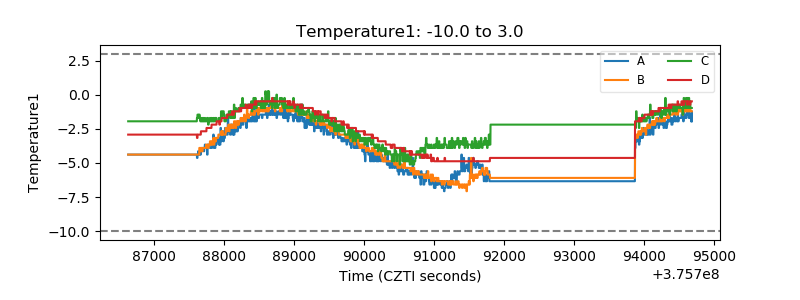 |
| Veto HV Monitor | 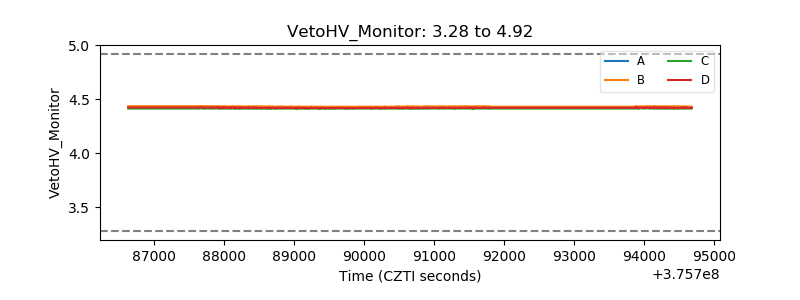 |
| Veto LLD | 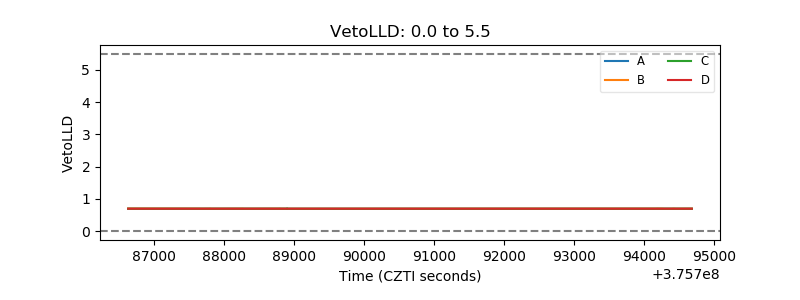 |
| Alpha Counter | 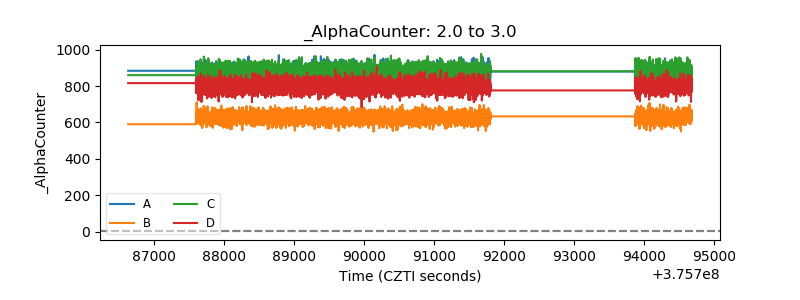 |
| _CPM_Rate | 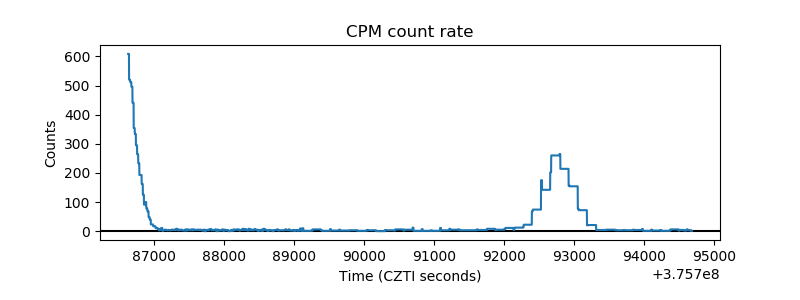 |
| CZT Counter | 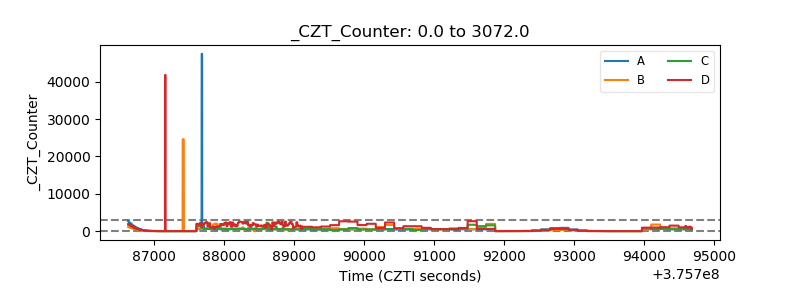 |
| +2.5 Volts monitor |  |
| +5 Volts monitor |  |
| _ROLL_ROT | 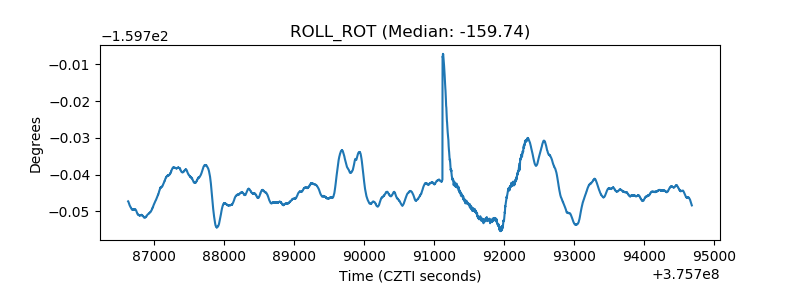 |
| _Roll_DEC | 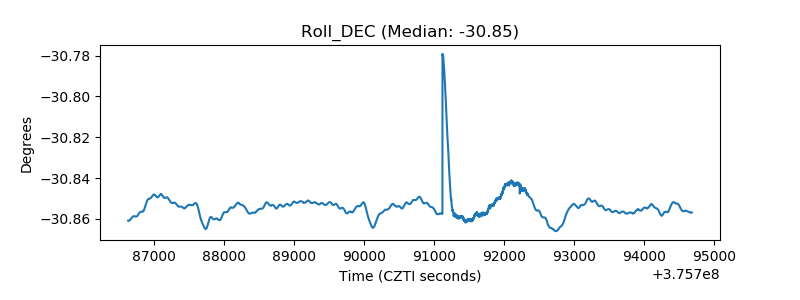 |
| _Roll_RA | 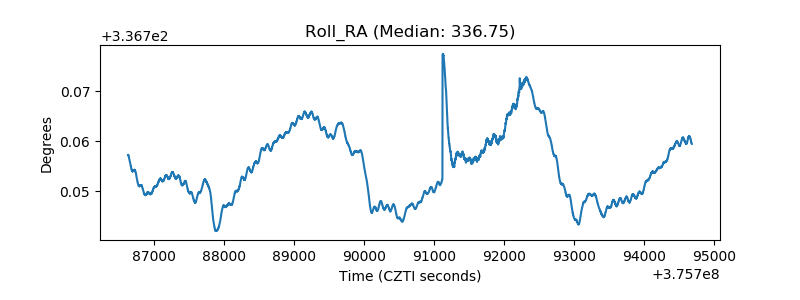 |
| Veto Counter | 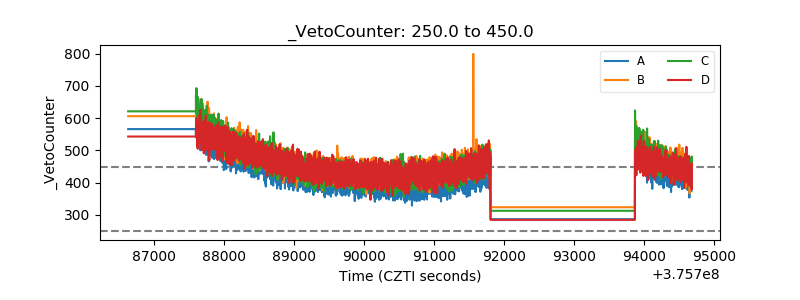 |