| Param | Original file | Final file |
|---|---|---|
| Filename | modeM0/AS1A10_058T15_9000004786_33355cztM0_level2.evt | modeM0/AS1A10_058T15_9000004786_33355cztM0_level2_quad_clean.evt |
| Size (bytes) | 603,449,280 | 74,684,160 |
| Size | 575.5 MB | 71.2 MB |
| Events in quadrant A | 2,899,486 | 488,620 |
| Events in quadrant B | 3,941,969 | 477,523 |
| Events in quadrant C | 4,169,284 | 472,474 |
| Events in quadrant D | 6,878,914 | 423,368 |
| Mode M0 | |||
|---|---|---|---|
| Quadrant | BADHDUFLAG | Total packets | Discarded packets |
| A | 0 | 12195 | 3 |
| B | 0 | 15357 | 2 |
| C | 0 | 16081 | 2 |
| D | 0 | 24499 | 2 |
| Mode M9 | |||
|---|---|---|---|
| Quadrant | BADHDUFLAG | Total packets | Discarded packets |
| A | 0 | 19 | 0 |
| B | 0 | 19 | 0 |
| C | 0 | 19 | 0 |
| D | 0 | 20 | 0 |
| Mode SS | |||
|---|---|---|---|
| Quadrant | BADHDUFLAG | Total packets | Discarded packets |
| A | 0 | 116 | 0 |
| B | 0 | 116 | 0 |
| C | 0 | 116 | 0 |
| D | 0 | 116 | 0 |
| Quadrant | Total seconds | Saturated seconds | Saturation percentage |
|---|---|---|---|
| A | 5708 | 19 | 0.332866% |
| B | 5708 | 257 | 4.502453% |
| C | 5708 | 364 | 6.377015% |
| D | 5708 | 950 | 16.643308% |
Noise dominated data is calculated using 1-second bins in cleaned event files. If a bin has >2000 counts, and if more than 50% of those come from <1% of pixels, then it is considered to be noise-dominated and hence unusable.
| Quadrant | # 1 sec bins | Bins with >0 counts | Bins with >2000 counts | High rate bins dominated by noise | Noise dominated (total time) | Noise dominated (detector-on time) | Marked lightcurve |
|---|---|---|---|---|---|---|---|
| A | 7172 | 5709 | 8 | 8 | 0.11% | 0.14% | 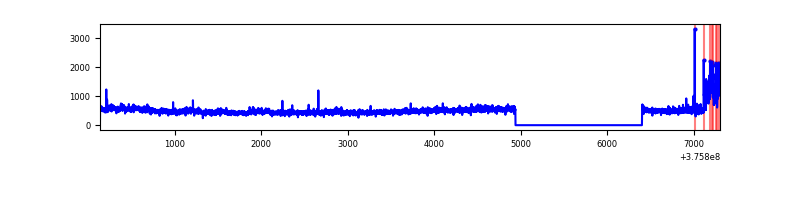 |
| B | 7172 | 5709 | 188 | 188 | 2.62% | 3.29% | 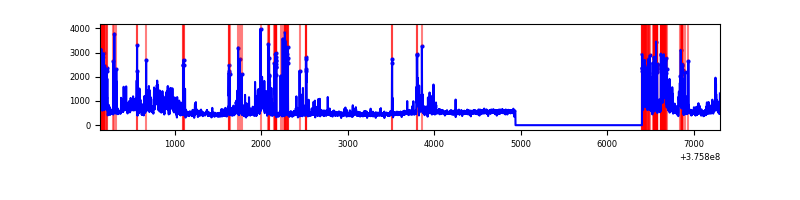 |
| C | 7172 | 5709 | 325 | 325 | 4.53% | 5.69% | 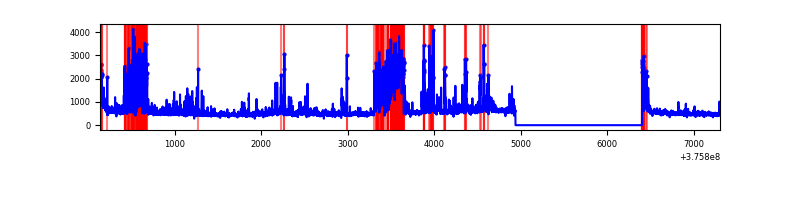 |
| D | 7172 | 5709 | 873 | 873 | 12.17% | 15.29% | 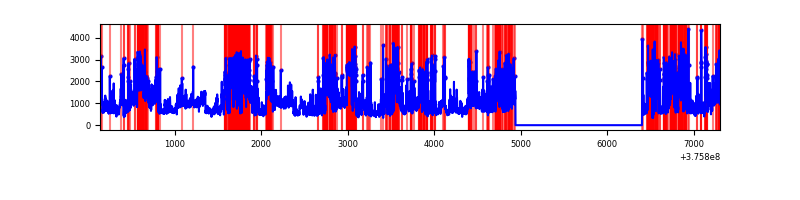 |
Top three noisy pixels from each quadrant. If the there are fewer than three noisy pixels in the level2.evt file, extra rows are filled as -1
| Pixel properties | Quadrant properties | ||||||
|---|---|---|---|---|---|---|---|
| Quadrant | DetID | PixID | Counts | Sigma | Mean | Median | Sigma |
| A | 15 | 169 | 255767 | 1864.88 | 677 | 665 | 136.8 |
| A | 13 | 6 | 10898 | 74.81 | 677 | 665 | 136.8 |
| A | 13 | 254 | 8291 | 55.75 | 677 | 665 | 136.8 |
| B | 5 | 172 | 674403 | 5288.84 | 664 | 648 | 127.4 |
| B | 0 | 219 | 290226 | 2273.13 | 664 | 648 | 127.4 |
| B | 0 | 245 | 106588 | 831.61 | 664 | 648 | 127.4 |
| C | 1 | 23 | 1087720 | 7385.24 | 635 | 641 | 147.2 |
| C | 15 | 214 | 245749 | 1665.18 | 635 | 641 | 147.2 |
| C | 0 | 10 | 159315 | 1077.98 | 635 | 641 | 147.2 |
| D | 8 | 195 | 1292392 | 8177.82 | 606 | 593 | 158.0 |
| D | 2 | 250 | 1171885 | 7414.95 | 606 | 593 | 158.0 |
| D | 1 | 52 | 500983 | 3167.75 | 606 | 593 | 158.0 |
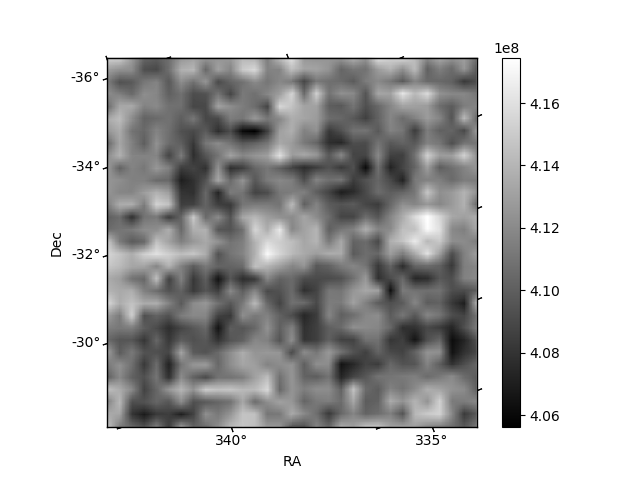
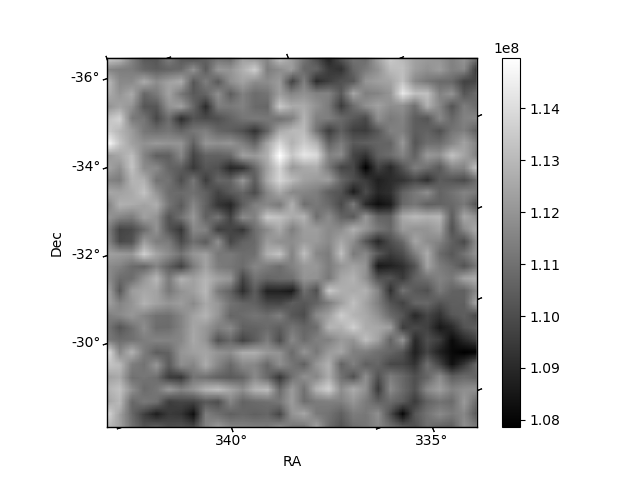
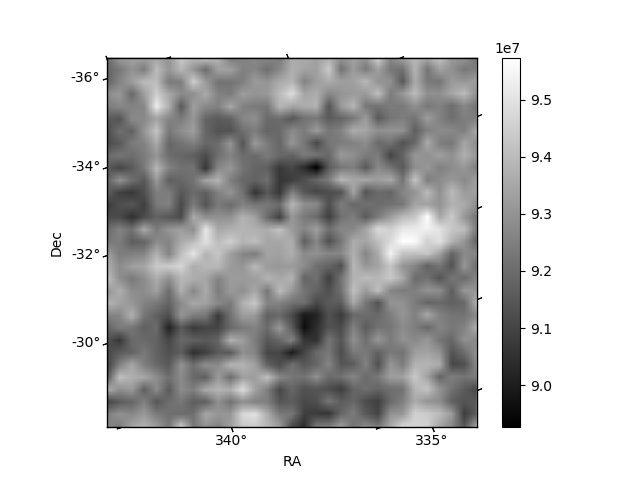
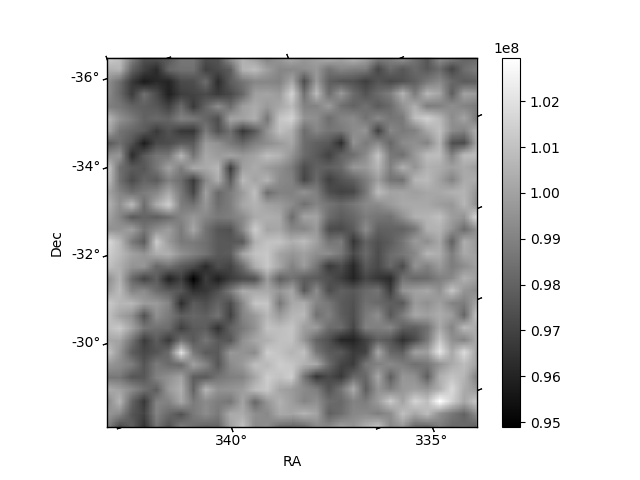
Histogram calculated using DETX and DETY for each event in the final _common_clean file
| Quadrant A | 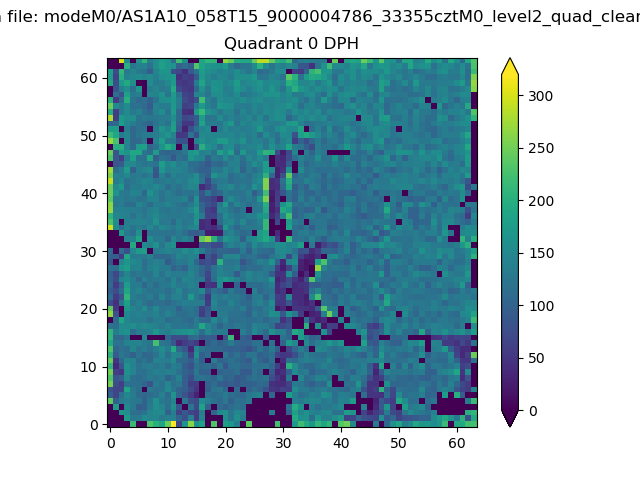 |
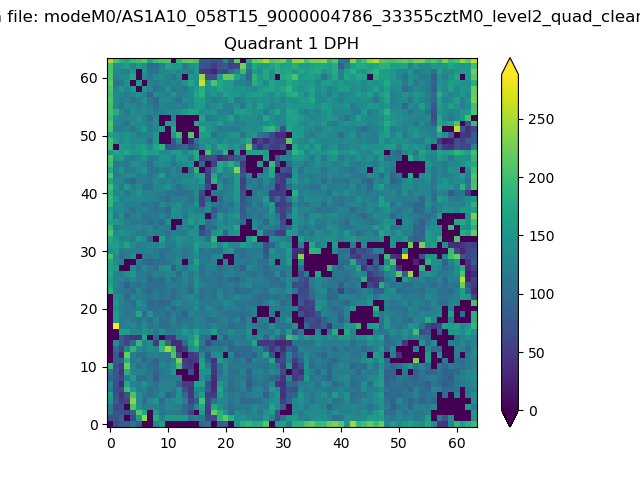 |
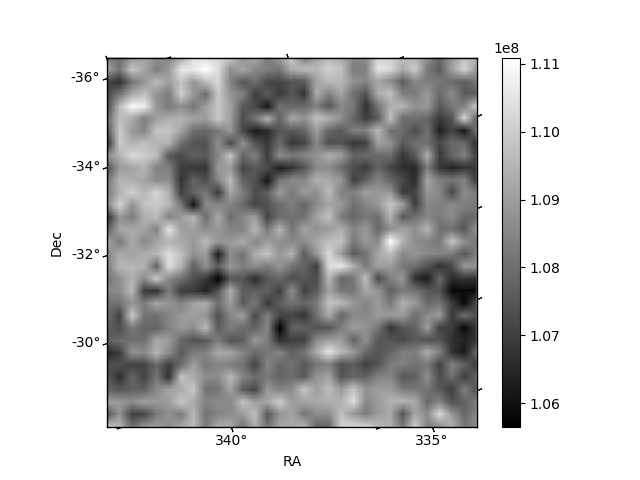
Quadrant B |
|---|---|---|---|
| Quadrant D | 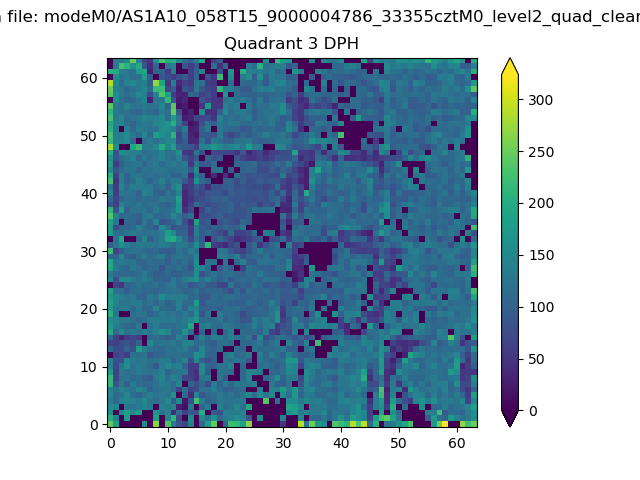 |
 |
Quadrant C |
| Plot type | Count rate plots | Images |
|---|---|---|
| Comparison with Poisson distribution Blue bars denote a histogram of data divided into 1 sec bins. Red curve is a Poisson curve with rate = median count rate of data. |
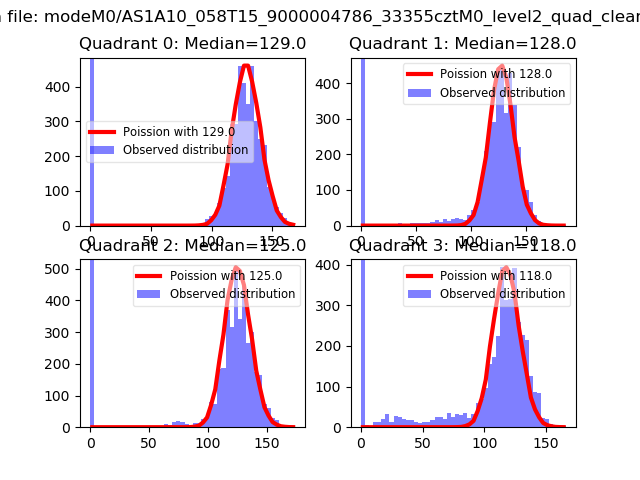 |
 |
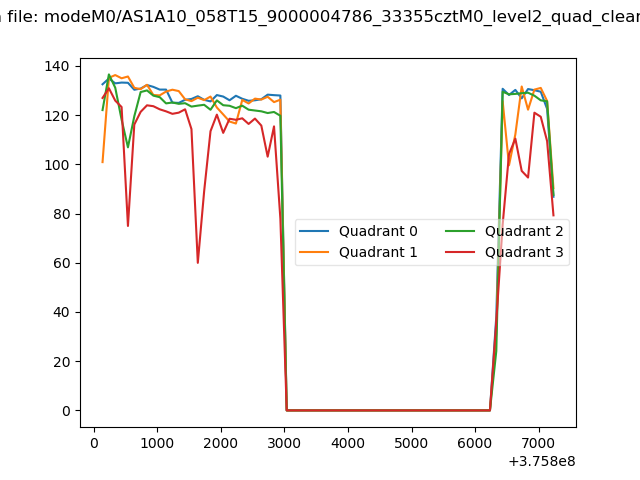
| Quadrant-wise count rates Data is divided into 100 sec bins |
 |
|
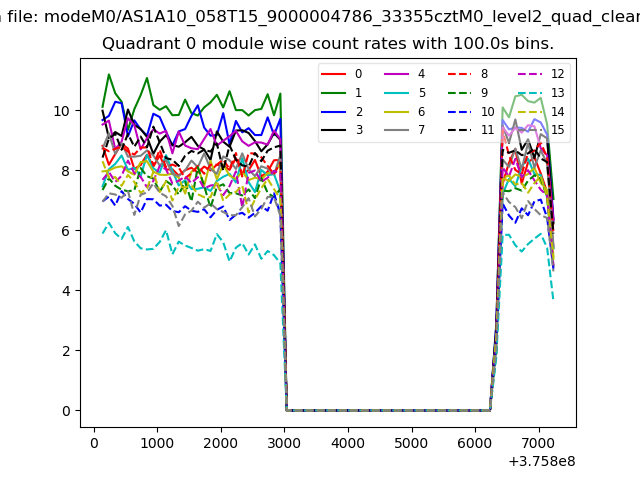
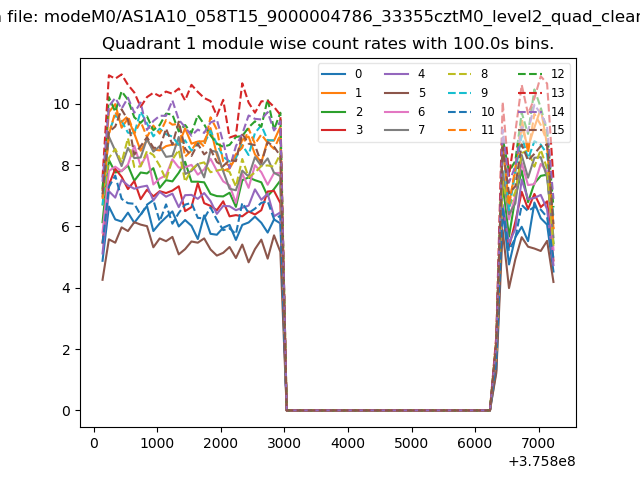
| Module-wise count rates for Quadrant A Data is divided into 100 sec bins |
 |
 |
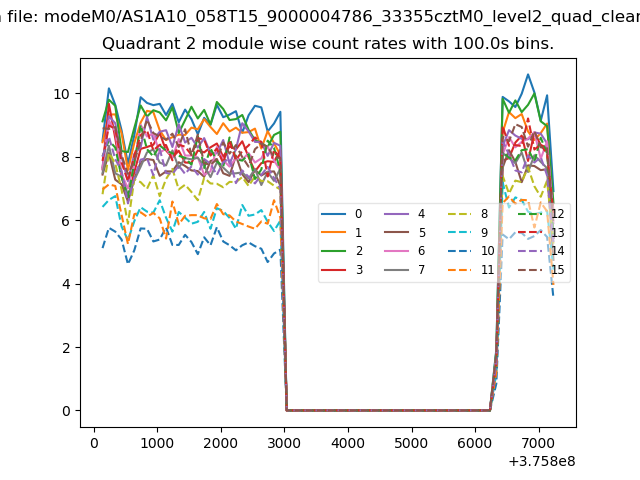
| Module-wise count rates for Quadrant B Data is divided into 100 sec bins |
 |
 |
| Module-wise count rates for Quadrant C Data is divided into 100 sec bins |
 |
 |
| Module-wise count rates for Quadrant D Data is divided into 100 sec bins |
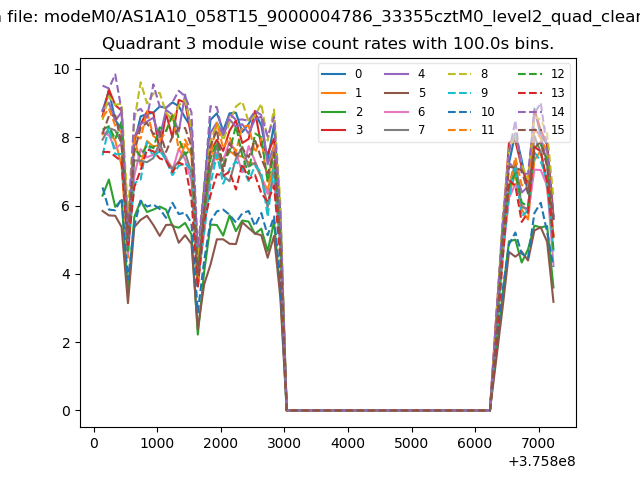 |
 |
| Parameter | Plot |
|---|---|
| CZT HV Monitor | 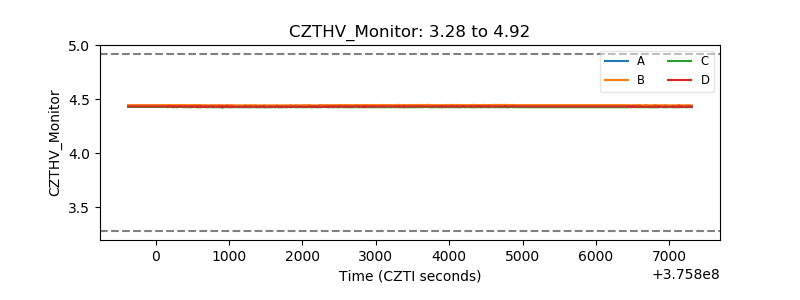 |
| D_VDD | 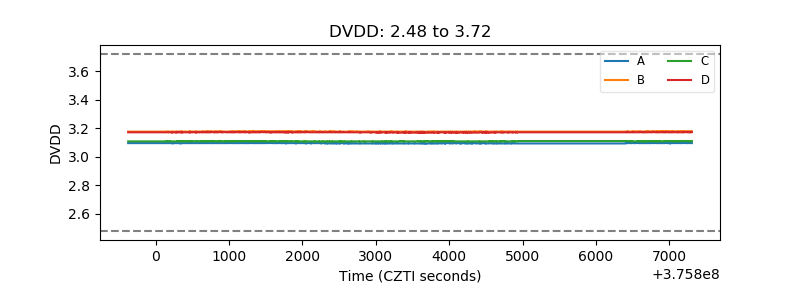 |
| Temperature 1 | 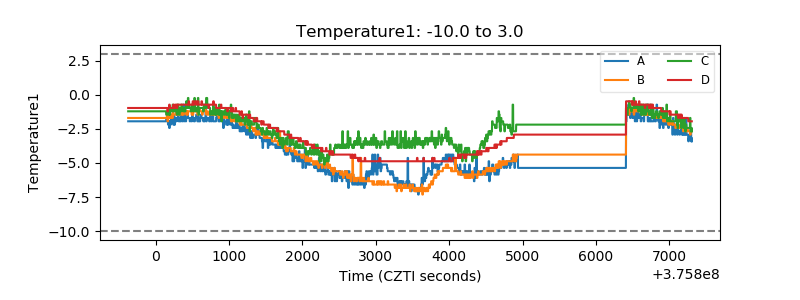 |
| Veto HV Monitor | 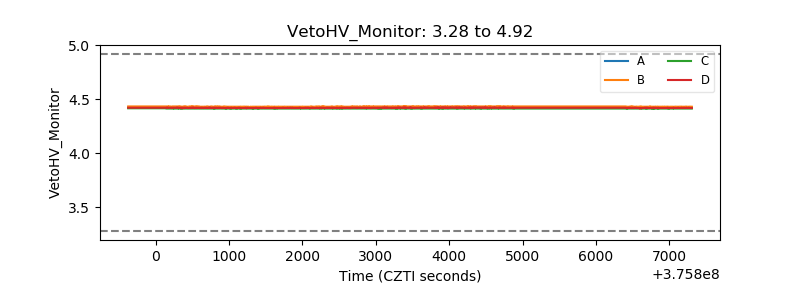 |
| Veto LLD | 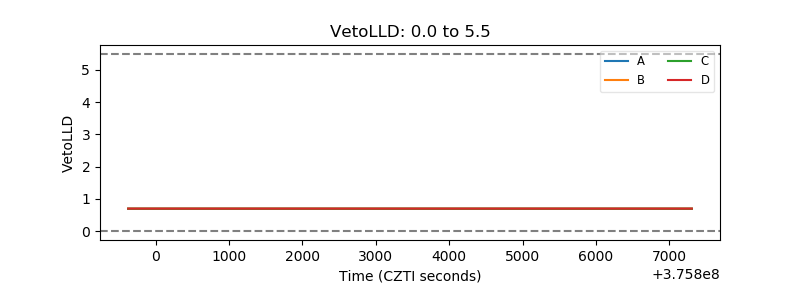 |
| Alpha Counter | 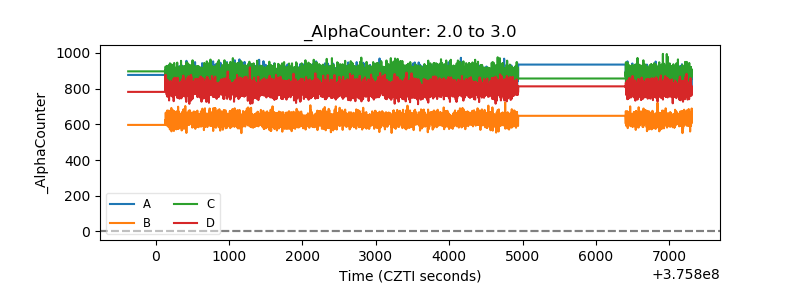 |
| _CPM_Rate | 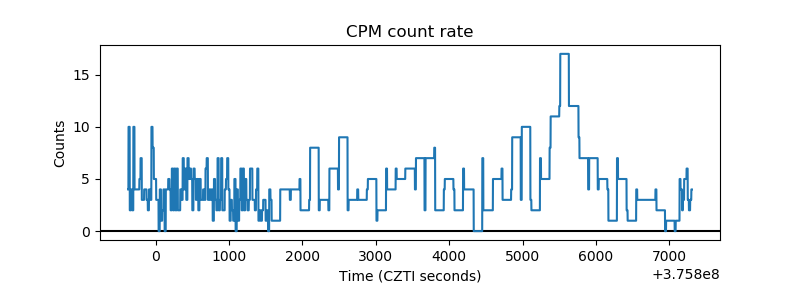 |
| CZT Counter | 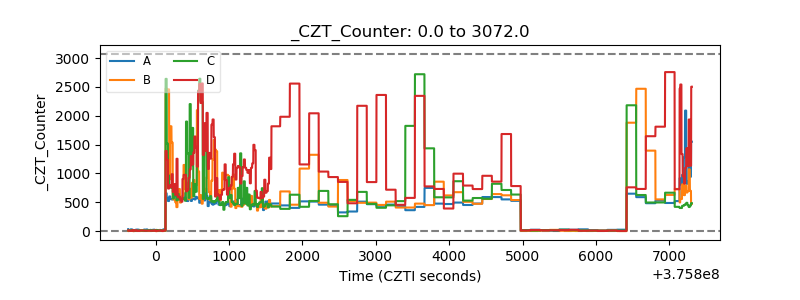 |
| +2.5 Volts monitor |  |
| +5 Volts monitor | 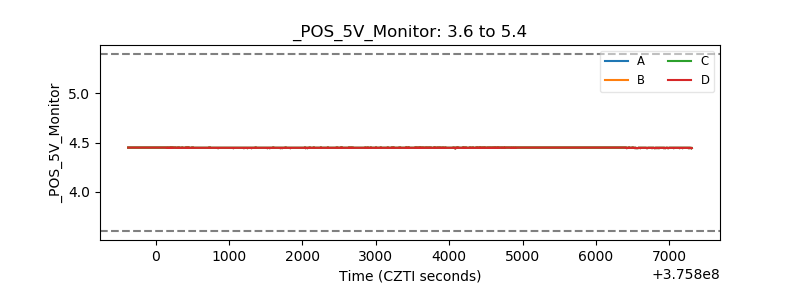 |
| _ROLL_ROT | 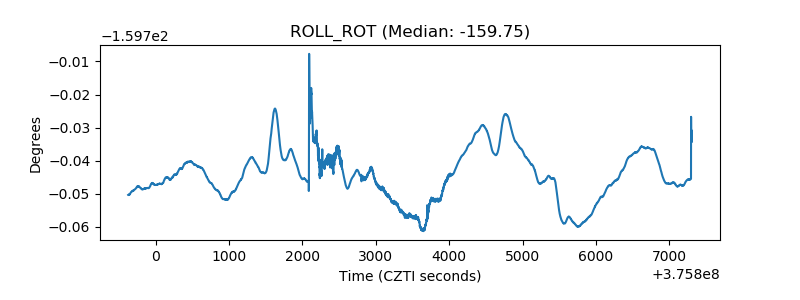 |
| _Roll_DEC | 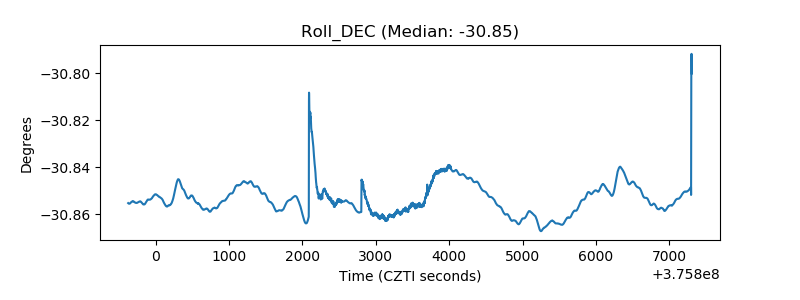 |
| _Roll_RA | 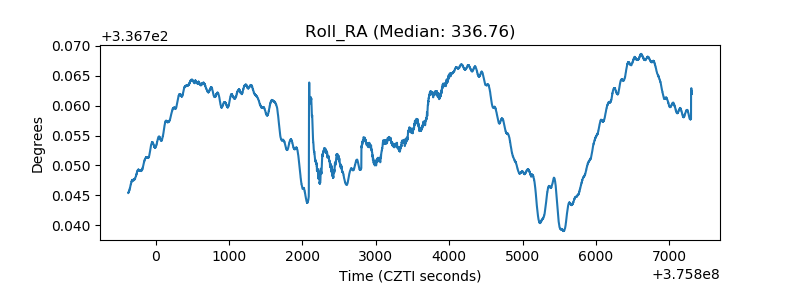 |
| Veto Counter | 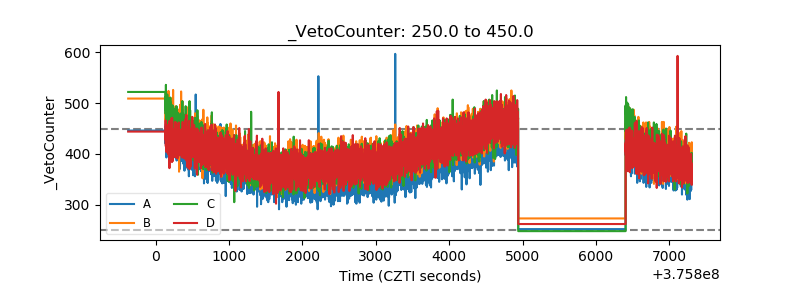 |