| Param | Original file | Final file |
|---|---|---|
| Filename | modeM0/AS1A10_058T15_9000004786_33359cztM0_level2.evt | modeM0/AS1A10_058T15_9000004786_33359cztM0_level2_quad_clean.evt |
| Size (bytes) | 1,740,559,680 | 178,056,000 |
| Size | 1.6 GB | 169.8 MB |
| Events in quadrant A | 9,712,597 | 1,127,246 |
| Events in quadrant B | 11,638,567 | 1,109,225 |
| Events in quadrant C | 9,634,266 | 1,105,509 |
| Events in quadrant D | 20,678,372 | 971,048 |
| Mode M0 | |||
|---|---|---|---|
| Quadrant | BADHDUFLAG | Total packets | Discarded packets |
| A | 0 | 39386 | 5 |
| B | 0 | 44955 | 4 |
| C | 0 | 38173 | 4 |
| D | 0 | 72321 | 4 |
| Mode M9 | |||
|---|---|---|---|
| Quadrant | BADHDUFLAG | Total packets | Discarded packets |
| A | 0 | 46 | 0 |
| B | 0 | 46 | 0 |
| C | 0 | 46 | 0 |
| D | 0 | 47 | 0 |
| Mode SS | |||
|---|---|---|---|
| Quadrant | BADHDUFLAG | Total packets | Discarded packets |
| A | 0 | 320 | 0 |
| B | 0 | 320 | 0 |
| C | 0 | 320 | 0 |
| D | 0 | 320 | 0 |
| Quadrant | Total seconds | Saturated seconds | Saturation percentage |
|---|---|---|---|
| A | 15619 | 356 | 2.279275% |
| B | 15619 | 1023 | 6.549715% |
| C | 15619 | 436 | 2.791472% |
| D | 15619 | 3531 | 22.607081% |
Noise dominated data is calculated using 1-second bins in cleaned event files. If a bin has >2000 counts, and if more than 50% of those come from <1% of pixels, then it is considered to be noise-dominated and hence unusable.
| Quadrant | # 1 sec bins | Bins with >0 counts | Bins with >2000 counts | High rate bins dominated by noise | Noise dominated (total time) | Noise dominated (detector-on time) | Marked lightcurve |
|---|---|---|---|---|---|---|---|
| A | 19798 | 15622 | 189 | 189 | 0.95% | 1.21% | 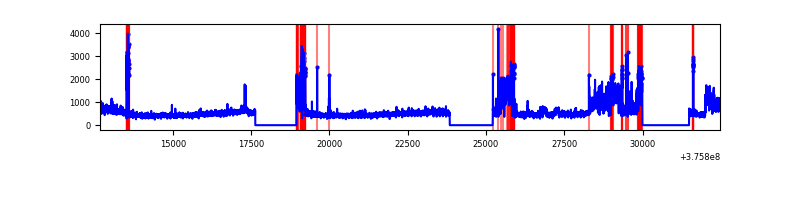 |
| B | 19798 | 15621 | 546 | 546 | 2.76% | 3.50% | 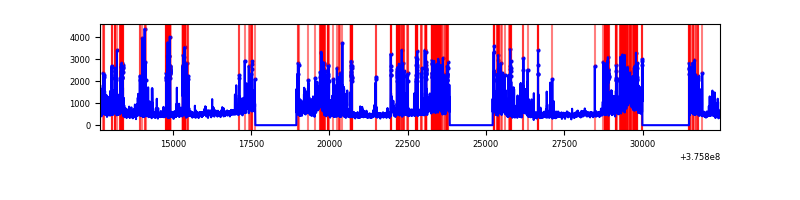 |
| C | 19798 | 15622 | 391 | 391 | 1.97% | 2.50% | 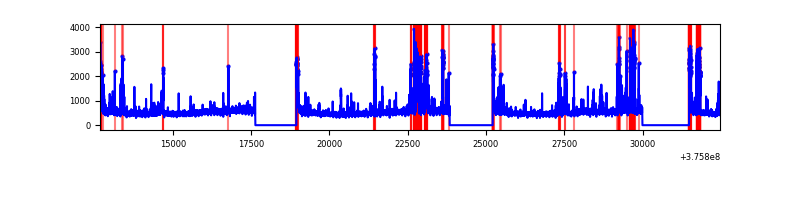 |
| D | 19798 | 15622 | 2937 | 2937 | 14.83% | 18.80% | 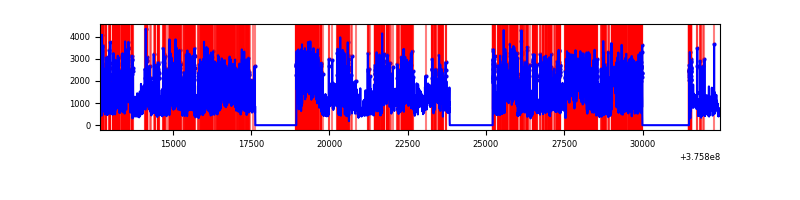 |
Top three noisy pixels from each quadrant. If the there are fewer than three noisy pixels in the level2.evt file, extra rows are filled as -1
| Pixel properties | Quadrant properties | ||||||
|---|---|---|---|---|---|---|---|
| Quadrant | DetID | PixID | Counts | Sigma | Mean | Median | Sigma |
| A | 15 | 169 | 2554484 | 6944.82 | 1842 | 1805 | 367.6 |
| A | 13 | 254 | 25028 | 63.18 | 1842 | 1805 | 367.6 |
| A | 13 | 6 | 24642 | 62.13 | 1842 | 1805 | 367.6 |
| B | 0 | 219 | 1610460 | 4686.47 | 1815 | 1766 | 343.3 |
| B | 5 | 172 | 1171131 | 3406.61 | 1815 | 1766 | 343.3 |
| B | 5 | 200 | 384040 | 1113.65 | 1815 | 1766 | 343.3 |
| C | 1 | 23 | 1101373 | 2681.91 | 1776 | 1796 | 410.0 |
| C | 15 | 214 | 669461 | 1628.46 | 1776 | 1796 | 410.0 |
| C | 0 | 10 | 447831 | 1087.9 | 1776 | 1796 | 410.0 |
| D | 8 | 195 | 4664924 | 10903.18 | 1627 | 1593 | 427.7 |
| D | 12 | 218 | 2405699 | 5620.96 | 1627 | 1593 | 427.7 |
| D | 2 | 250 | 2243852 | 5242.55 | 1627 | 1593 | 427.7 |
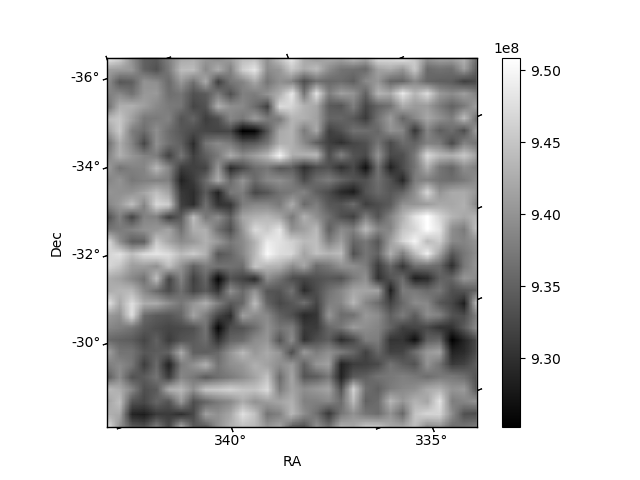
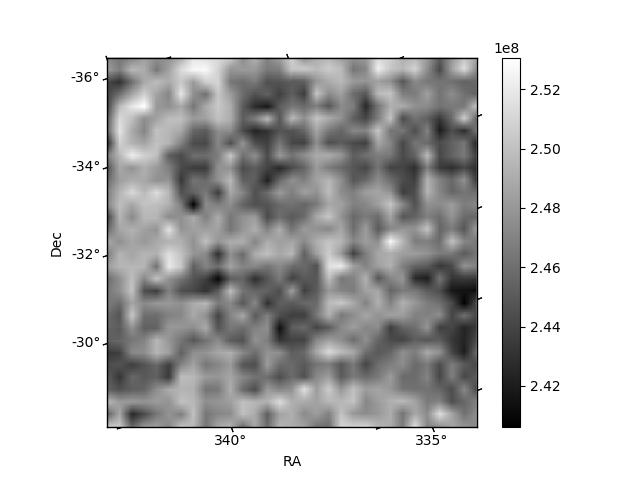
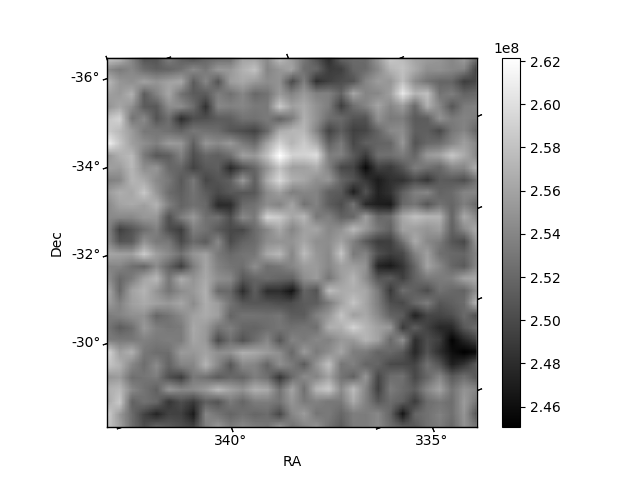
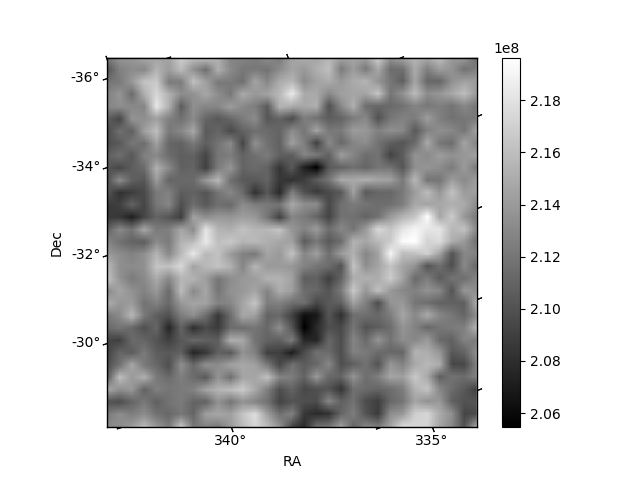
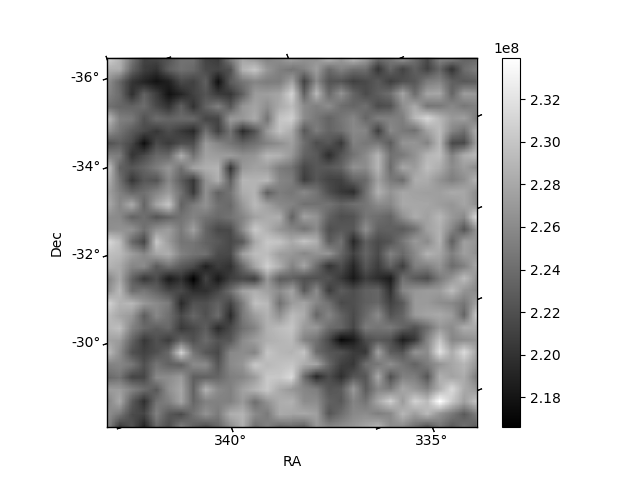
Histogram calculated using DETX and DETY for each event in the final _common_clean file
| Quadrant A | 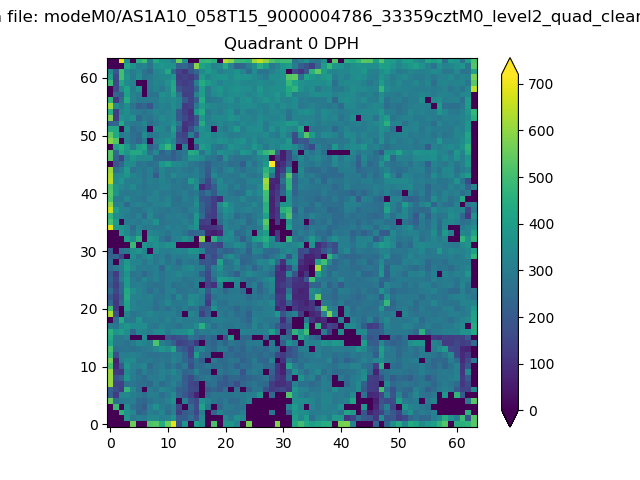 |
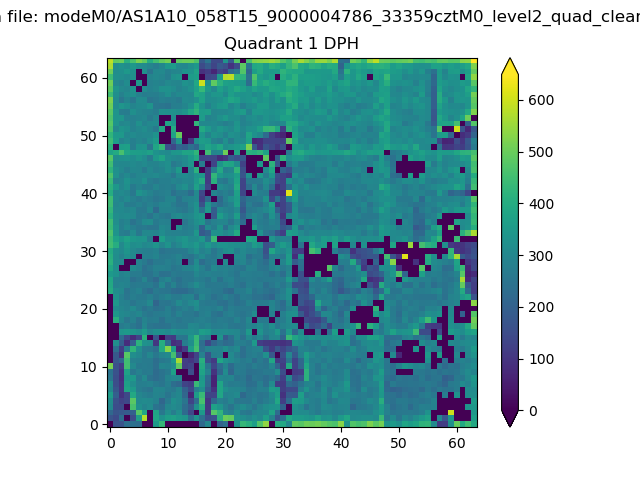 |
Quadrant B |
|---|---|---|---|
| Quadrant D | 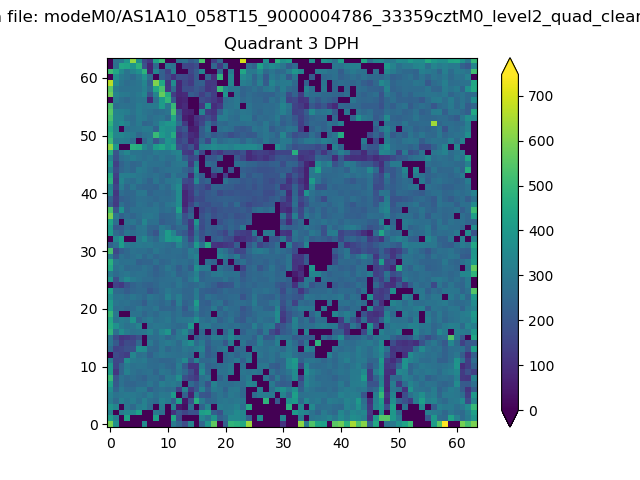 |
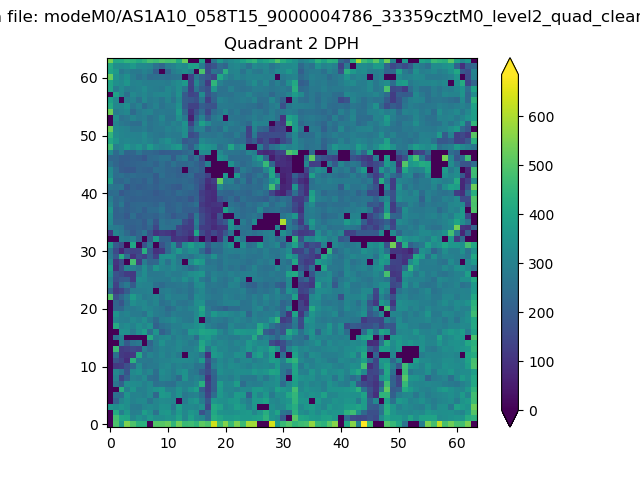 |
Quadrant C |
| Plot type | Count rate plots | Images |
|---|---|---|
| Comparison with Poisson distribution Blue bars denote a histogram of data divided into 1 sec bins. Red curve is a Poisson curve with rate = median count rate of data. |
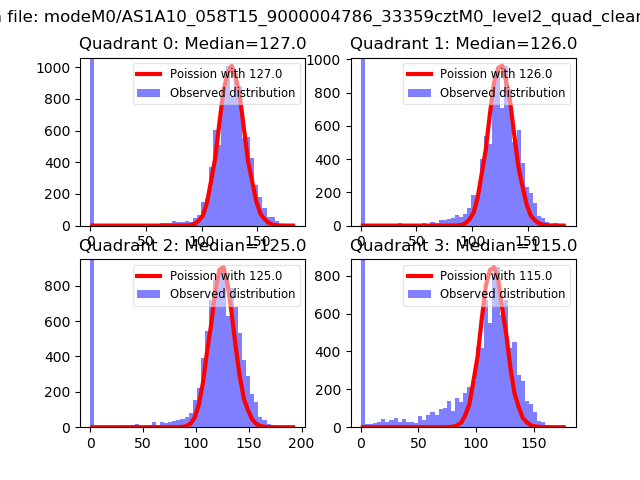 |
 |
| Quadrant-wise count rates Data is divided into 100 sec bins |
 |
|
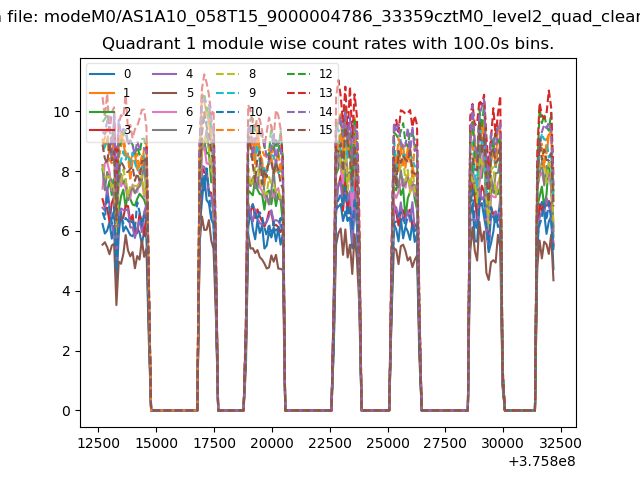
| Module-wise count rates for Quadrant A Data is divided into 100 sec bins |
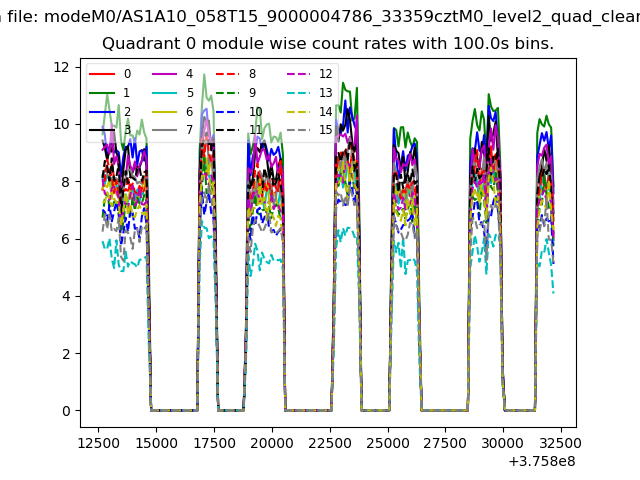 |
 |
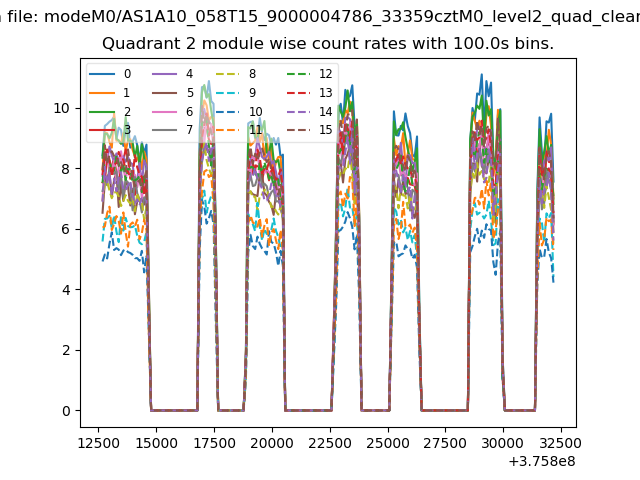
| Module-wise count rates for Quadrant B Data is divided into 100 sec bins |
 |
 |
| Module-wise count rates for Quadrant C Data is divided into 100 sec bins |
 |
 |
| Module-wise count rates for Quadrant D Data is divided into 100 sec bins |
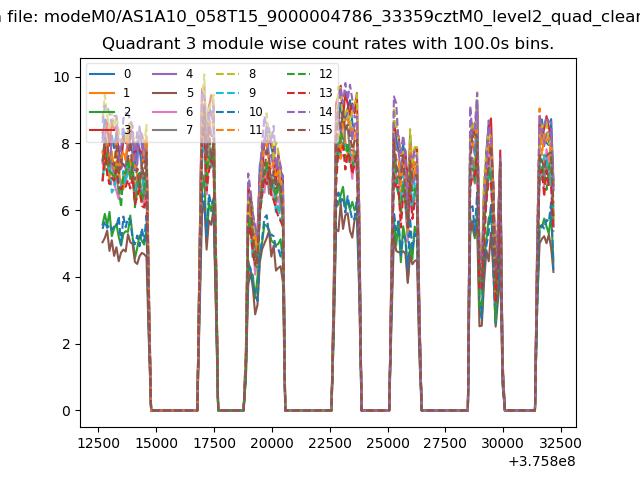 |
 |
| Parameter | Plot |
|---|---|
| CZT HV Monitor | 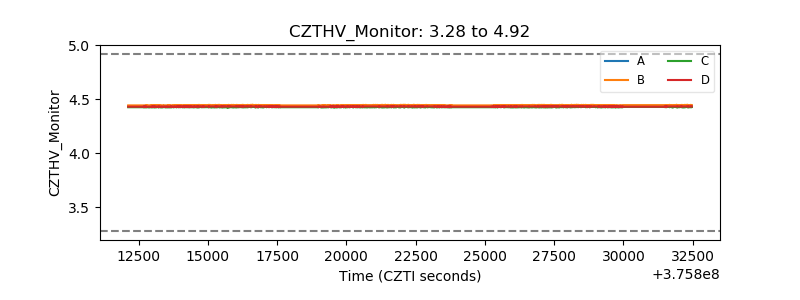 |
| D_VDD | 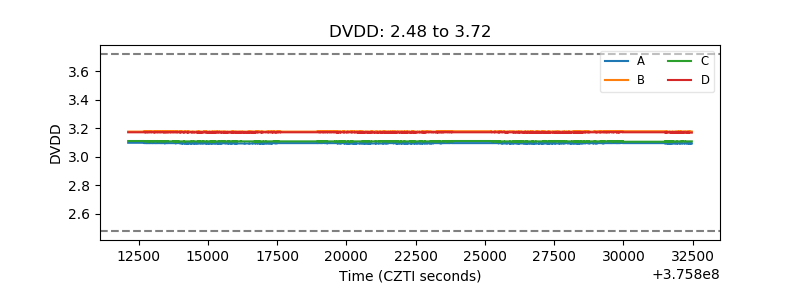 |
| Temperature 1 | 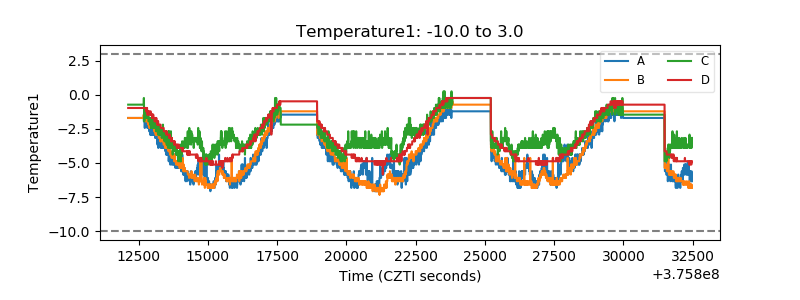 |
| Veto HV Monitor | 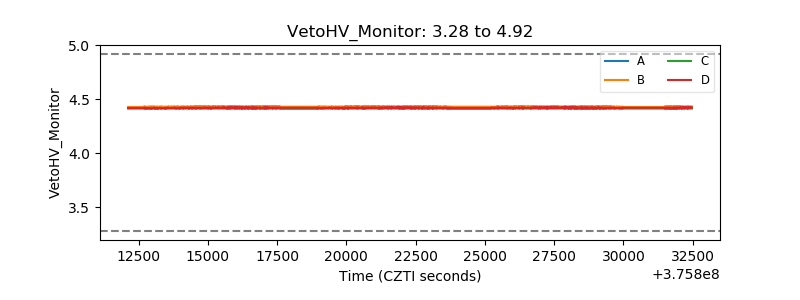 |
| Veto LLD | 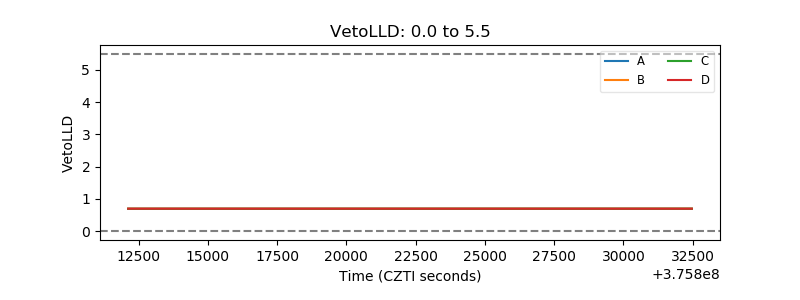 |
| Alpha Counter |  |
| _CPM_Rate |  |
| CZT Counter | 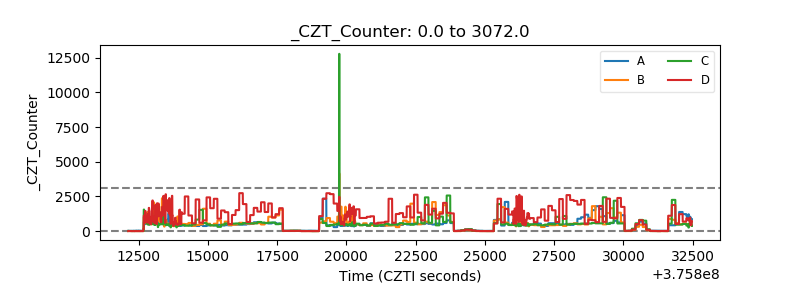 |
| +2.5 Volts monitor |  |
| +5 Volts monitor |  |
| _ROLL_ROT | 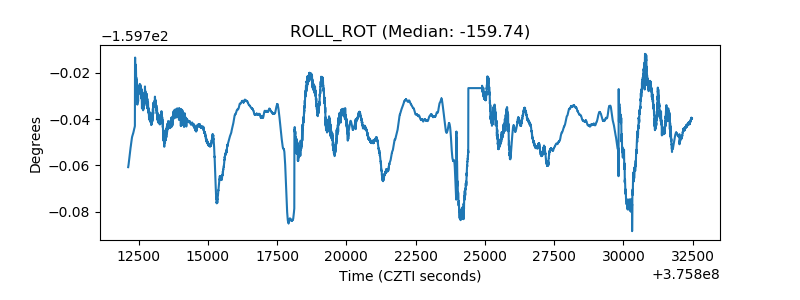 |
| _Roll_DEC | 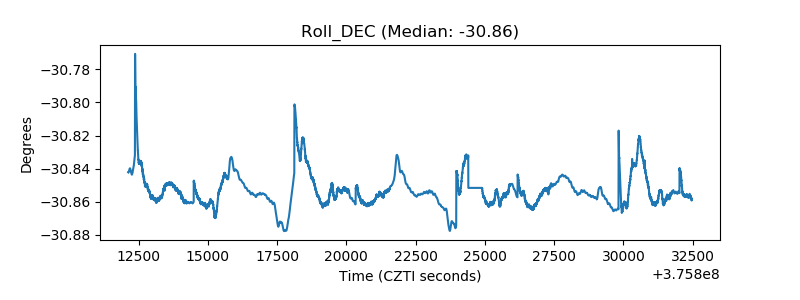 |
| _Roll_RA | 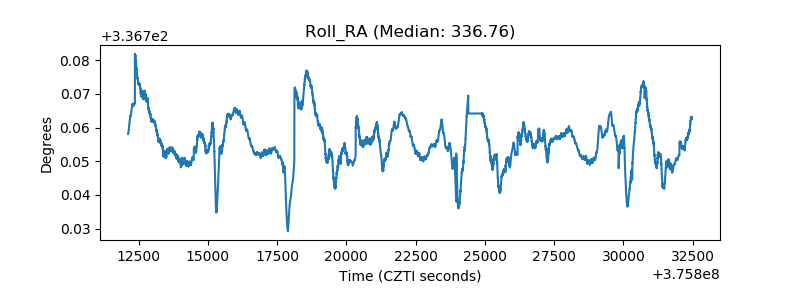 |
| Veto Counter | 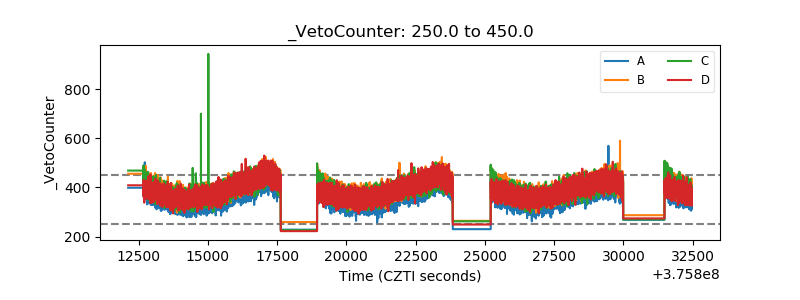 |