| Param | Original file | Final file |
|---|---|---|
| Filename | modeM0/AS1A10_058T15_9000004786_33360cztM0_level2.evt | modeM0/AS1A10_058T15_9000004786_33360cztM0_level2_quad_clean.evt |
| Size (bytes) | 576,403,200 | 60,143,040 |
| Size | 549.7 MB | 57.4 MB |
| Events in quadrant A | 3,882,979 | 368,826 |
| Events in quadrant B | 4,247,474 | 347,498 |
| Events in quadrant C | 3,951,566 | 362,065 |
| Events in quadrant D | 4,991,869 | 346,712 |
| Mode M0 | |||
|---|---|---|---|
| Quadrant | BADHDUFLAG | Total packets | Discarded packets |
| A | 0 | 15124 | 3 |
| B | 0 | 16344 | 2 |
| C | 0 | 15028 | 2 |
| D | 0 | 18704 | 2 |
| Mode M9 | |||
|---|---|---|---|
| Quadrant | BADHDUFLAG | Total packets | Discarded packets |
| A | 0 | 22 | 0 |
| B | 0 | 22 | 0 |
| C | 0 | 22 | 0 |
| D | 0 | 23 | 0 |
| Mode SS | |||
|---|---|---|---|
| Quadrant | BADHDUFLAG | Total packets | Discarded packets |
| A | 0 | 116 | 0 |
| B | 0 | 116 | 0 |
| C | 0 | 116 | 0 |
| D | 0 | 116 | 0 |
| Quadrant | Total seconds | Saturated seconds | Saturation percentage |
|---|---|---|---|
| A | 5650 | 113 | 2.000000% |
| B | 5650 | 570 | 10.088496% |
| C | 5650 | 335 | 5.929204% |
| D | 5650 | 399 | 7.061947% |
Noise dominated data is calculated using 1-second bins in cleaned event files. If a bin has >2000 counts, and if more than 50% of those come from <1% of pixels, then it is considered to be noise-dominated and hence unusable.
| Quadrant | # 1 sec bins | Bins with >0 counts | Bins with >2000 counts | High rate bins dominated by noise | Noise dominated (total time) | Noise dominated (detector-on time) | Marked lightcurve |
|---|---|---|---|---|---|---|---|
| A | 7262 | 5650 | 83 | 83 | 1.14% | 1.47% | 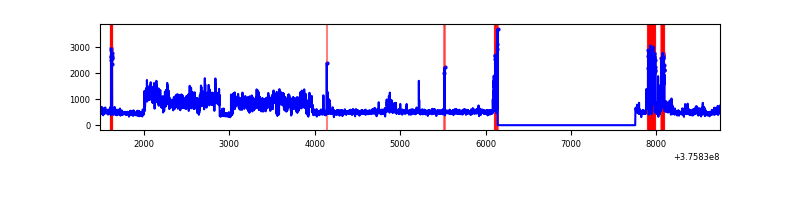 |
| B | 7262 | 5651 | 351 | 351 | 4.83% | 6.21% | 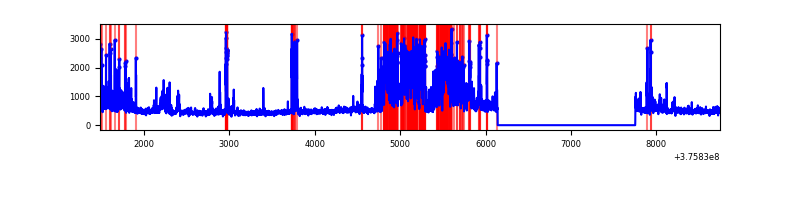 |
| C | 7262 | 5651 | 318 | 318 | 4.38% | 5.63% | 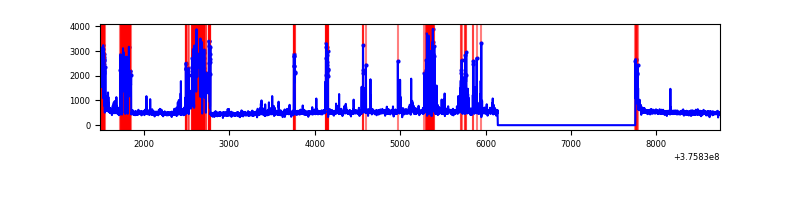 |
| D | 7262 | 5651 | 344 | 344 | 4.74% | 6.09% | 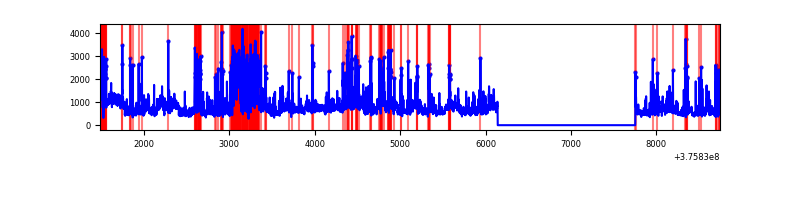 |
Top three noisy pixels from each quadrant. If the there are fewer than three noisy pixels in the level2.evt file, extra rows are filled as -1
| Pixel properties | Quadrant properties | ||||||
|---|---|---|---|---|---|---|---|
| Quadrant | DetID | PixID | Counts | Sigma | Mean | Median | Sigma |
| A | 15 | 169 | 1303662 | 9718.51 | 664 | 651 | 134.1 |
| A | 13 | 254 | 8160 | 56.01 | 664 | 651 | 134.1 |
| A | 3 | 137 | 6333 | 42.38 | 664 | 651 | 134.1 |
| B | 5 | 172 | 825512 | 6653.52 | 645 | 629 | 124.0 |
| B | 0 | 219 | 457598 | 3685.92 | 645 | 629 | 124.0 |
| B | 5 | 200 | 149355 | 1199.63 | 645 | 629 | 124.0 |
| C | 1 | 23 | 854728 | 5746.29 | 637 | 641 | 148.6 |
| C | 15 | 214 | 244237 | 1638.91 | 637 | 641 | 148.6 |
| C | 15 | 208 | 224178 | 1503.96 | 637 | 641 | 148.6 |
| D | 8 | 195 | 962504 | 5558.97 | 630 | 617 | 173.0 |
| D | 2 | 250 | 580750 | 3352.72 | 630 | 617 | 173.0 |
| D | 14 | 173 | 352973 | 2036.35 | 630 | 617 | 173.0 |
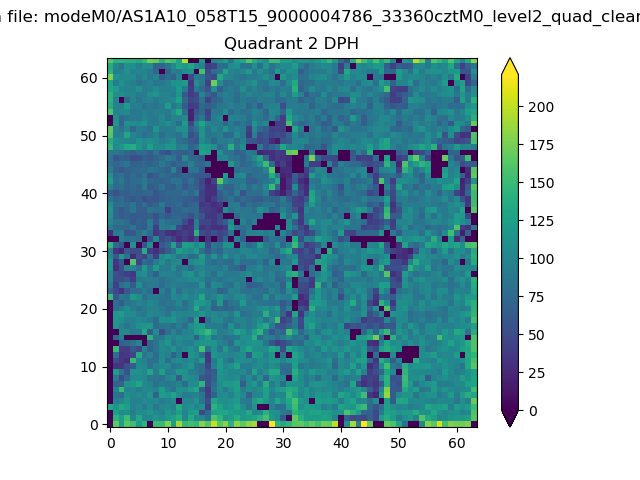
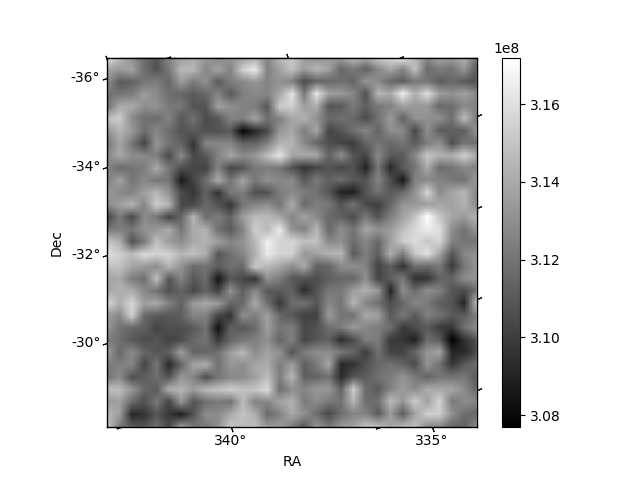
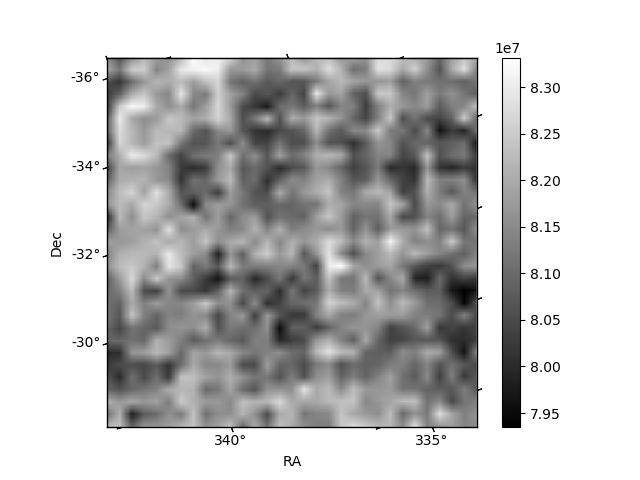
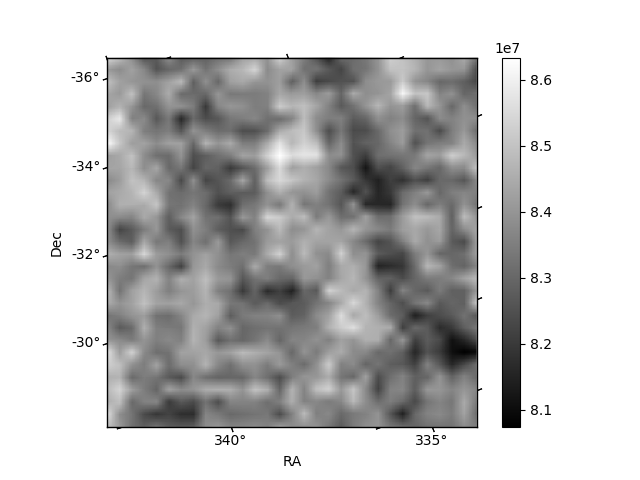
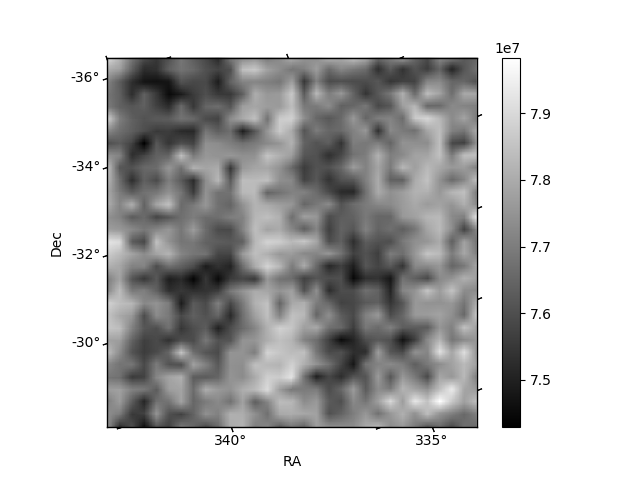
Histogram calculated using DETX and DETY for each event in the final _common_clean file
| Quadrant A | 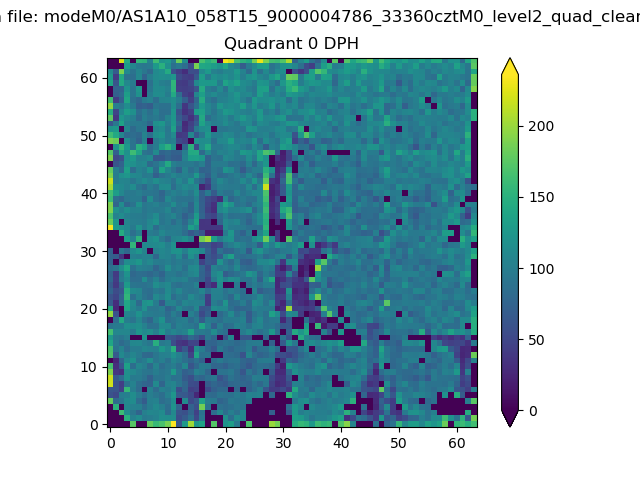 |
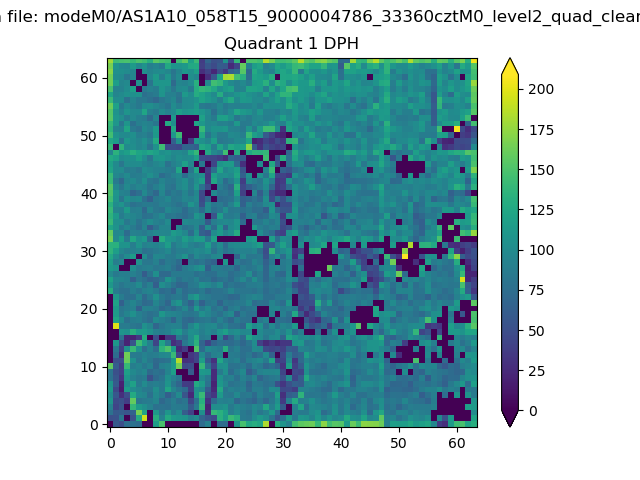 |
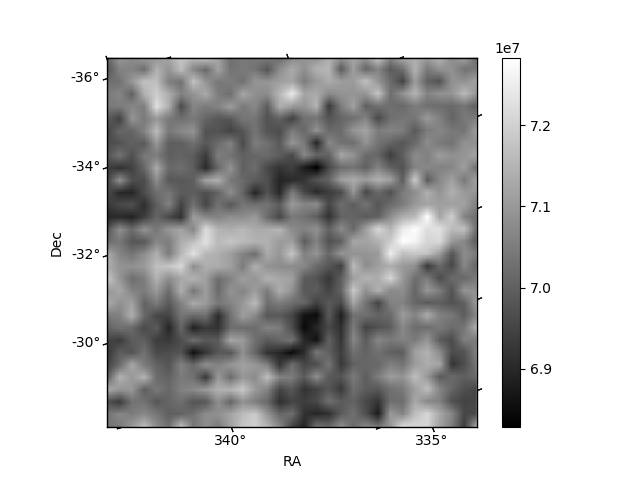
Quadrant B |
|---|---|---|---|
| Quadrant D | 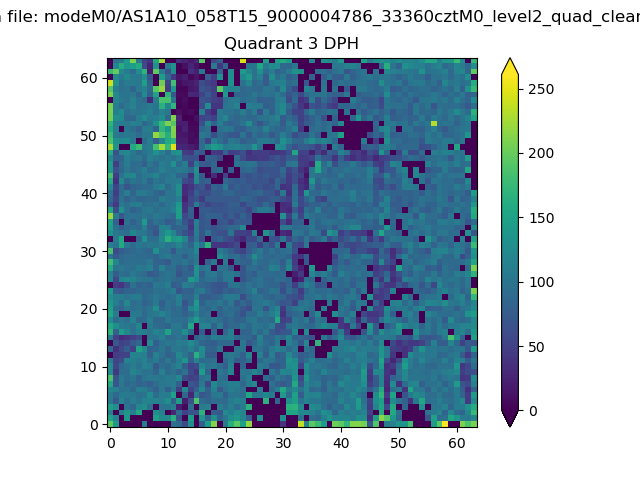 |
 |
Quadrant C |
| Plot type | Count rate plots | Images |
|---|---|---|
| Comparison with Poisson distribution Blue bars denote a histogram of data divided into 1 sec bins. Red curve is a Poisson curve with rate = median count rate of data. |
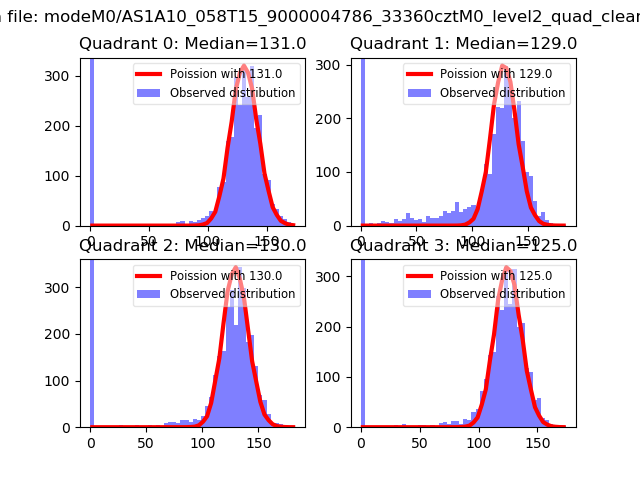 |
 |
| Quadrant-wise count rates Data is divided into 100 sec bins |
 |
|
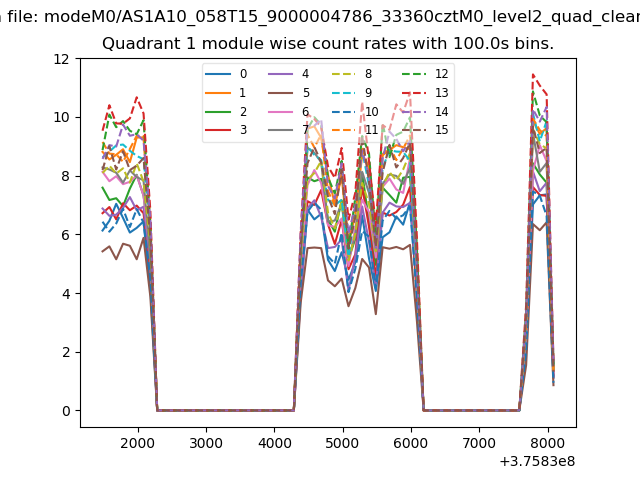
| Module-wise count rates for Quadrant A Data is divided into 100 sec bins |
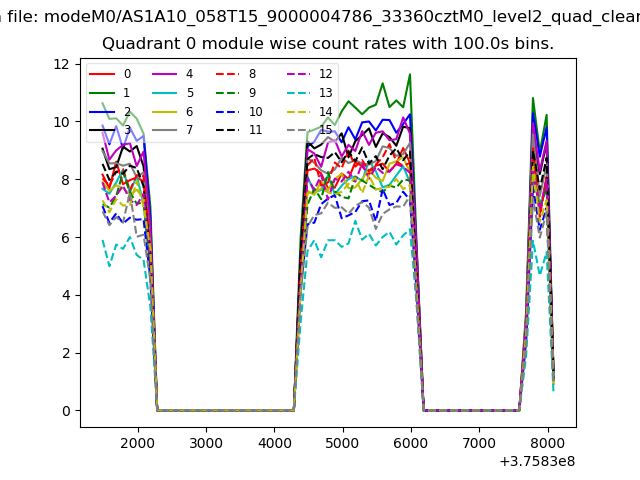 |
 |
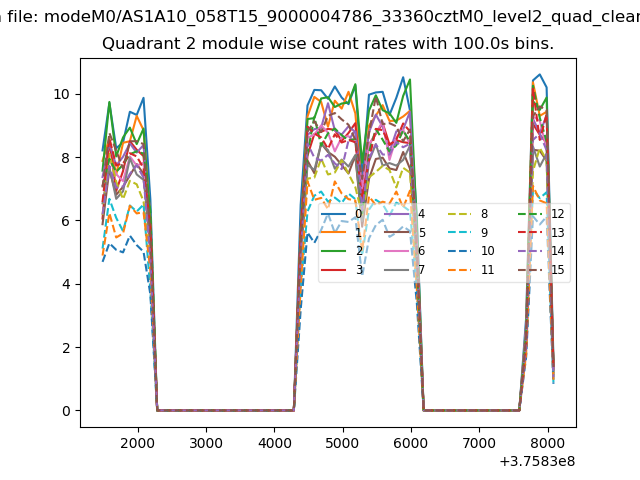
| Module-wise count rates for Quadrant B Data is divided into 100 sec bins |
 |
 |
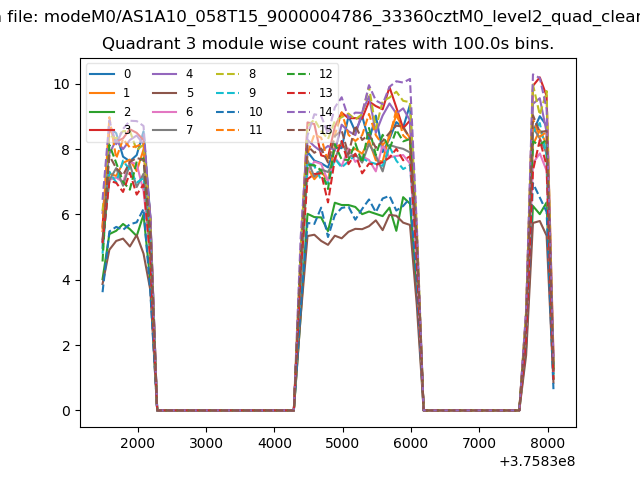
| Module-wise count rates for Quadrant C Data is divided into 100 sec bins |
 |
 |
| Module-wise count rates for Quadrant D Data is divided into 100 sec bins |
 |
 |
| Parameter | Plot |
|---|---|
| CZT HV Monitor | 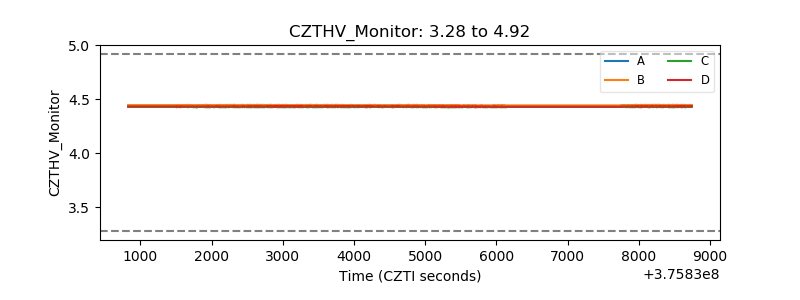 |
| D_VDD | 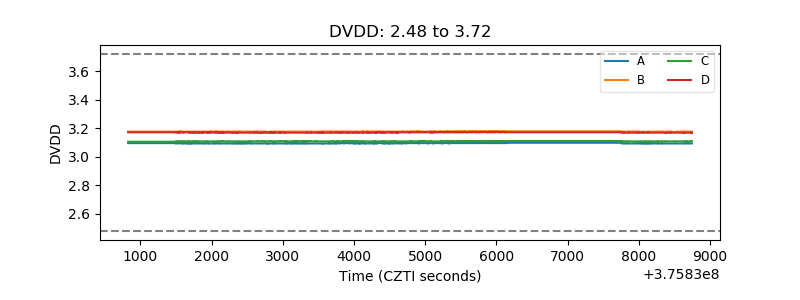 |
| Temperature 1 | 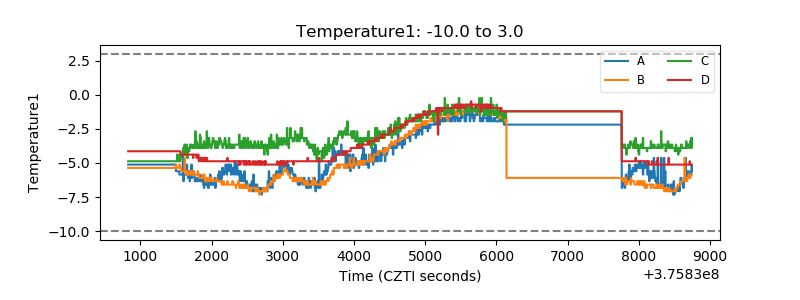 |
| Veto HV Monitor | 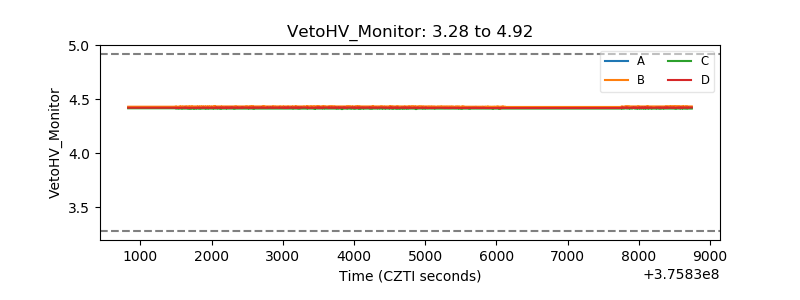 |
| Veto LLD | 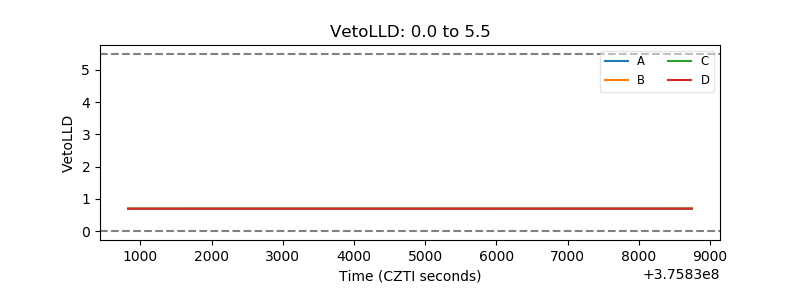 |
| Alpha Counter | 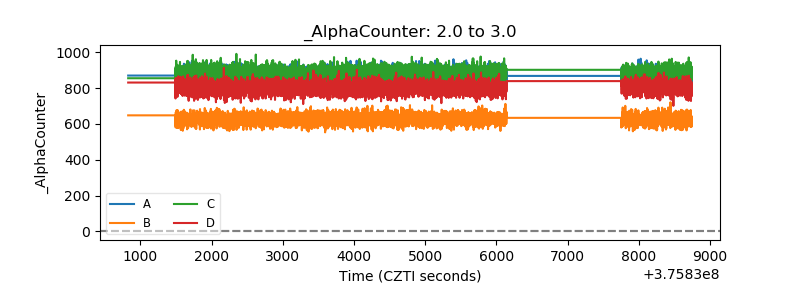 |
| _CPM_Rate | 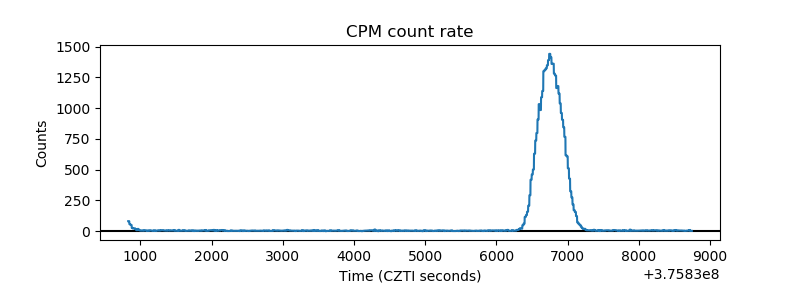 |
| CZT Counter | 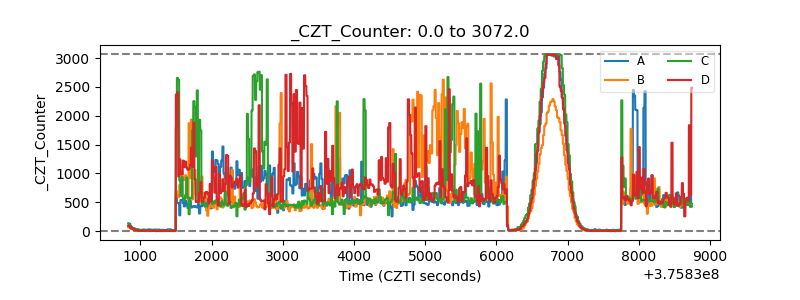 |
| +2.5 Volts monitor |  |
| +5 Volts monitor | 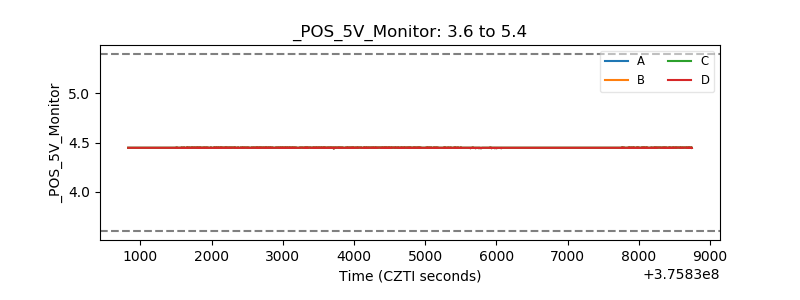 |
| _ROLL_ROT | 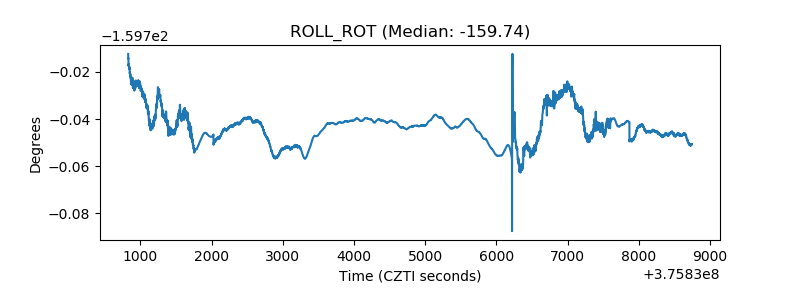 |
| _Roll_DEC | 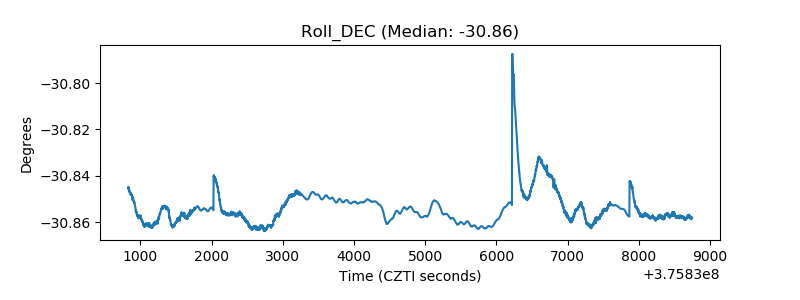 |
| _Roll_RA | 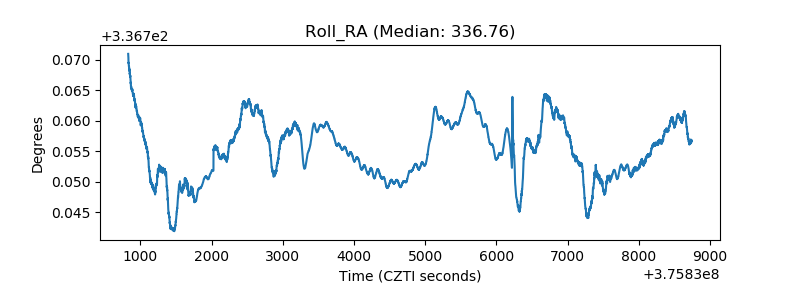 |
| Veto Counter | 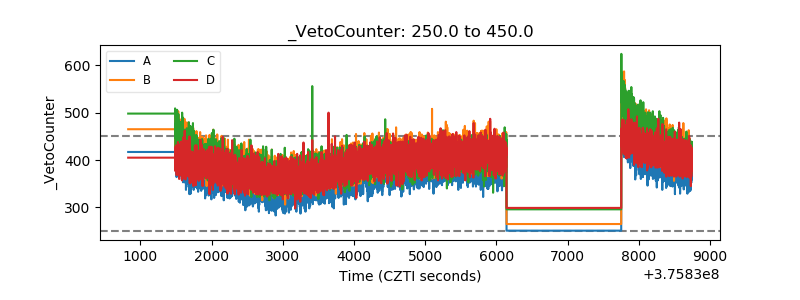 |