| Param | Original file | Final file |
|---|---|---|
| Filename | modeM0/AS1A10_058T15_9000004786_33363cztM0_level2.evt | modeM0/AS1A10_058T15_9000004786_33363cztM0_level2_quad_clean.evt |
| Size (bytes) | 555,888,960 | 52,110,720 |
| Size | 530.1 MB | 49.7 MB |
| Events in quadrant A | 3,378,607 | 311,524 |
| Events in quadrant B | 3,771,520 | 301,615 |
| Events in quadrant C | 3,228,787 | 315,523 |
| Events in quadrant D | 6,103,471 | 283,142 |
| Mode M0 | |||
|---|---|---|---|
| Quadrant | BADHDUFLAG | Total packets | Discarded packets |
| A | 0 | 13518 | 3 |
| B | 0 | 14433 | 2 |
| C | 0 | 12677 | 2 |
| D | 0 | 21860 | 2 |
| Mode M9 | |||
|---|---|---|---|
| Quadrant | BADHDUFLAG | Total packets | Discarded packets |
| A | 0 | 30 | 0 |
| B | 0 | 30 | 0 |
| C | 0 | 30 | 0 |
| D | 0 | 31 | 0 |
| Mode SS | |||
|---|---|---|---|
| Quadrant | BADHDUFLAG | Total packets | Discarded packets |
| A | 0 | 106 | 0 |
| B | 0 | 106 | 0 |
| C | 0 | 106 | 0 |
| D | 0 | 106 | 0 |
| Quadrant | Total seconds | Saturated seconds | Saturation percentage |
|---|---|---|---|
| A | 5217 | 26 | 0.498371% |
| B | 5217 | 338 | 6.478819% |
| C | 5217 | 62 | 1.188422% |
| D | 5217 | 688 | 13.187656% |
Noise dominated data is calculated using 1-second bins in cleaned event files. If a bin has >2000 counts, and if more than 50% of those come from <1% of pixels, then it is considered to be noise-dominated and hence unusable.
| Quadrant | # 1 sec bins | Bins with >0 counts | Bins with >2000 counts | High rate bins dominated by noise | Noise dominated (total time) | Noise dominated (detector-on time) | Marked lightcurve |
|---|---|---|---|---|---|---|---|
| A | 7070 | 5218 | 10 | 10 | 0.14% | 0.19% | 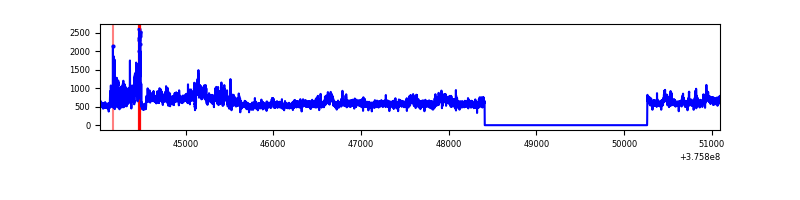 |
| B | 7070 | 5218 | 150 | 150 | 2.12% | 2.87% | 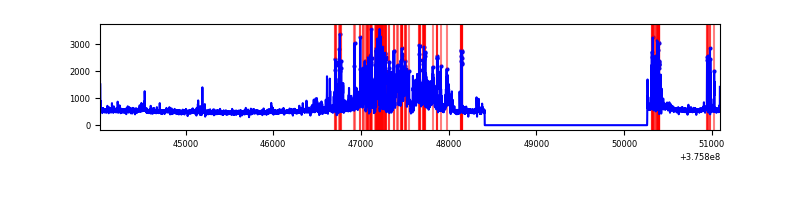 |
| C | 7070 | 5218 | 57 | 57 | 0.81% | 1.09% | 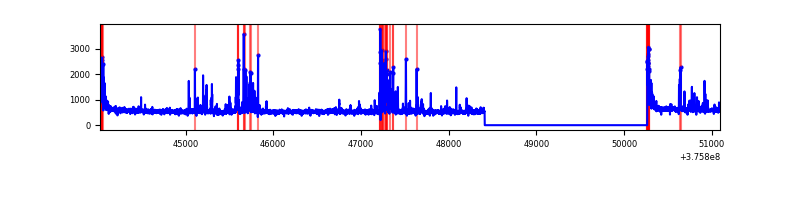 |
| D | 7070 | 5218 | 651 | 651 | 9.21% | 12.48% | 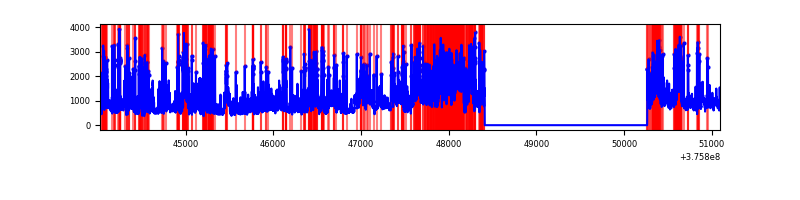 |
Top three noisy pixels from each quadrant. If the there are fewer than three noisy pixels in the level2.evt file, extra rows are filled as -1
| Pixel properties | Quadrant properties | ||||||
|---|---|---|---|---|---|---|---|
| Quadrant | DetID | PixID | Counts | Sigma | Mean | Median | Sigma |
| A | 15 | 169 | 816848 | 6217.83 | 657 | 646 | 131.3 |
| A | 8 | 205 | 21060 | 155.51 | 657 | 646 | 131.3 |
| A | 13 | 254 | 7785 | 54.38 | 657 | 646 | 131.3 |
| B | 5 | 172 | 560481 | 4590.32 | 650 | 634 | 122.0 |
| B | 0 | 219 | 453766 | 3715.34 | 650 | 634 | 122.0 |
| B | 5 | 200 | 46865 | 379.06 | 650 | 634 | 122.0 |
| C | 1 | 23 | 271232 | 1837.64 | 644 | 651 | 147.2 |
| C | 15 | 214 | 229578 | 1554.74 | 644 | 651 | 147.2 |
| C | 0 | 10 | 131321 | 887.44 | 644 | 651 | 147.2 |
| D | 1 | 52 | 994002 | 6573.17 | 617 | 601 | 151.1 |
| D | 8 | 195 | 793024 | 5243.33 | 617 | 601 | 151.1 |
| D | 13 | 249 | 673396 | 4451.77 | 617 | 601 | 151.1 |
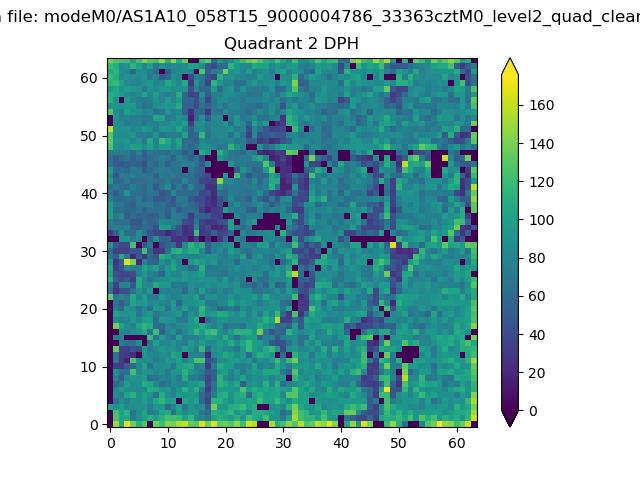
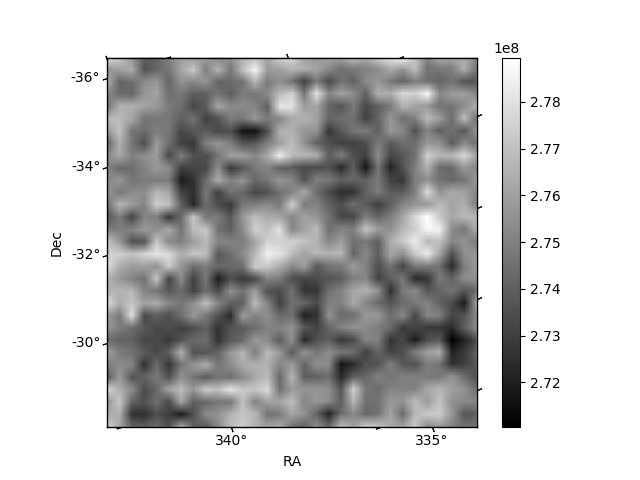
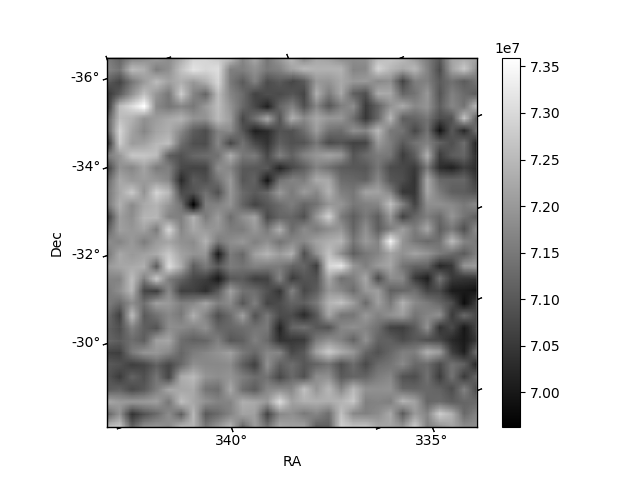
Histogram calculated using DETX and DETY for each event in the final _common_clean file
| Quadrant A | 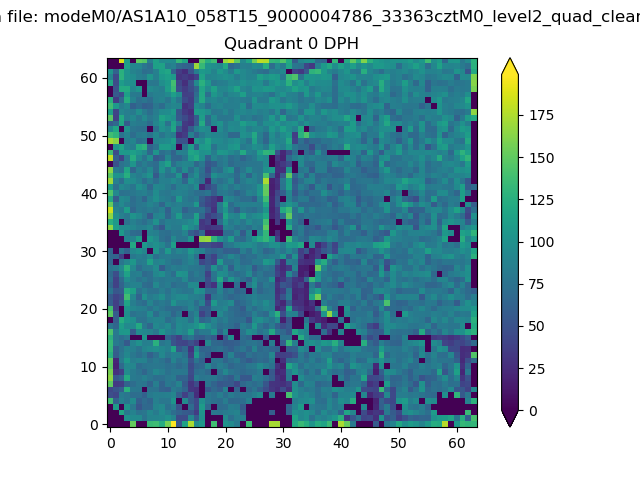 |
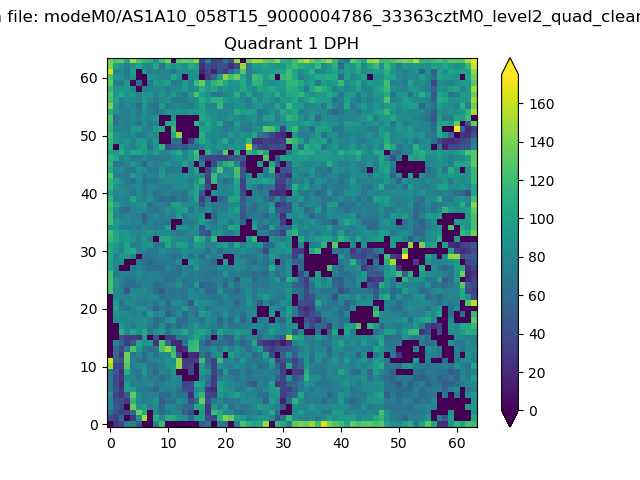 |
Quadrant B |
|---|---|---|---|
| Quadrant D | 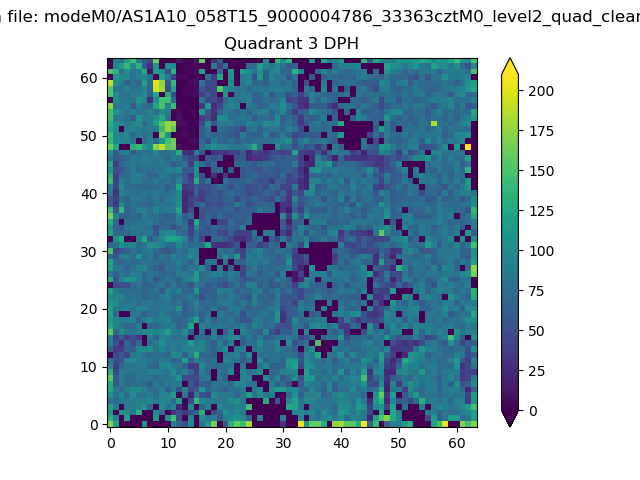 |
 |
Quadrant C |
| Plot type | Count rate plots | Images |
|---|---|---|
| Comparison with Poisson distribution Blue bars denote a histogram of data divided into 1 sec bins. Red curve is a Poisson curve with rate = median count rate of data. |
 |
 |
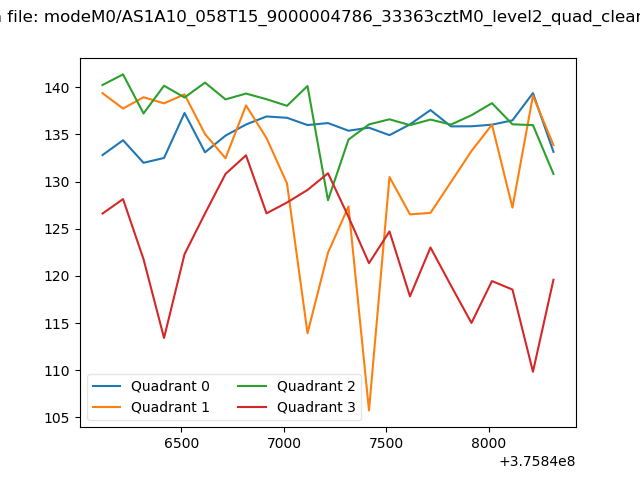
| Quadrant-wise count rates Data is divided into 100 sec bins |
 |
|
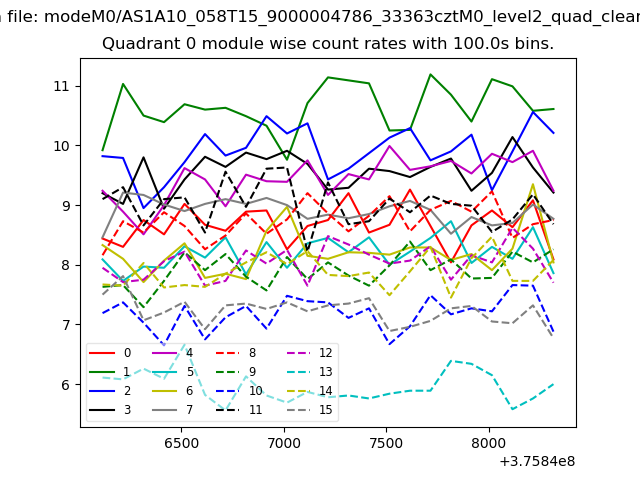
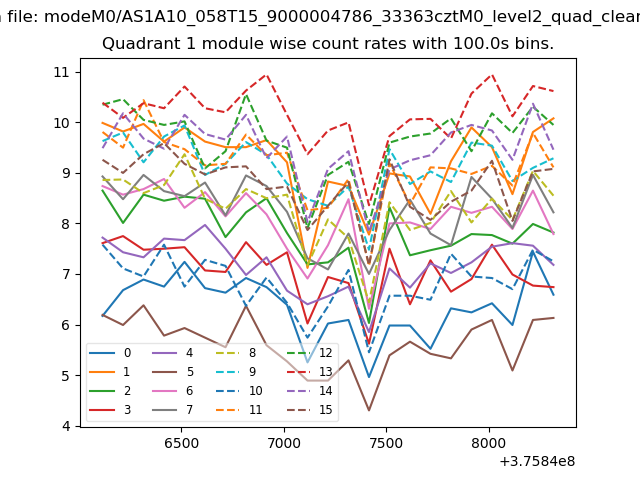
| Module-wise count rates for Quadrant A Data is divided into 100 sec bins |
 |
 |
| Module-wise count rates for Quadrant B Data is divided into 100 sec bins |
 |
 |
| Module-wise count rates for Quadrant C Data is divided into 100 sec bins |
 |
 |
| Module-wise count rates for Quadrant D Data is divided into 100 sec bins |
 |
 |
| Parameter | Plot |
|---|---|
| CZT HV Monitor |  |
| D_VDD | 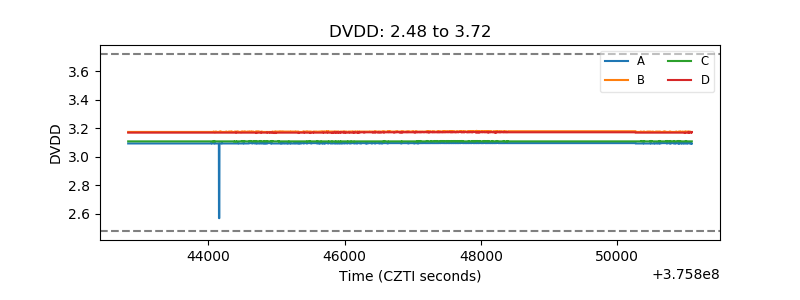 |
| Temperature 1 | 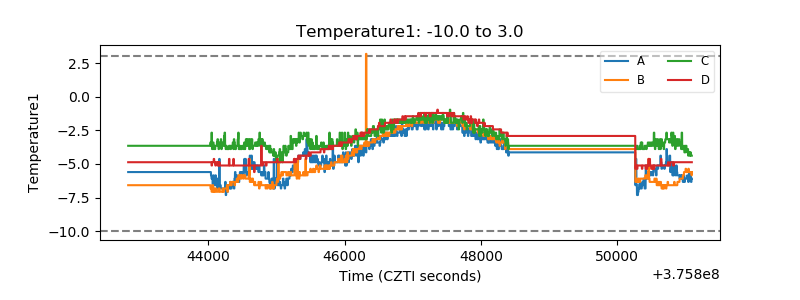 |
| Veto HV Monitor | 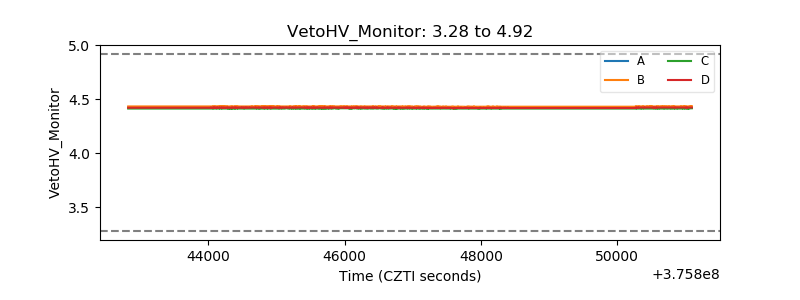 |
| Veto LLD | 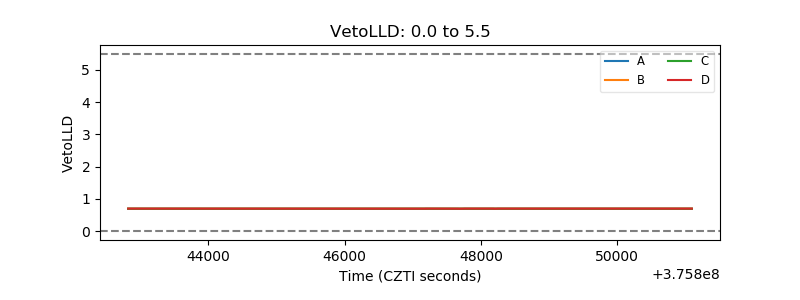 |
| Alpha Counter | 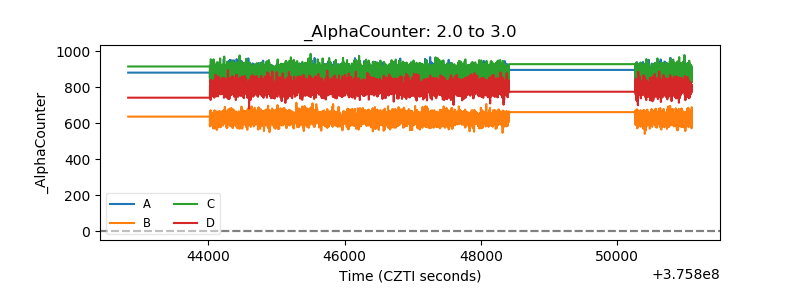 |
| _CPM_Rate | 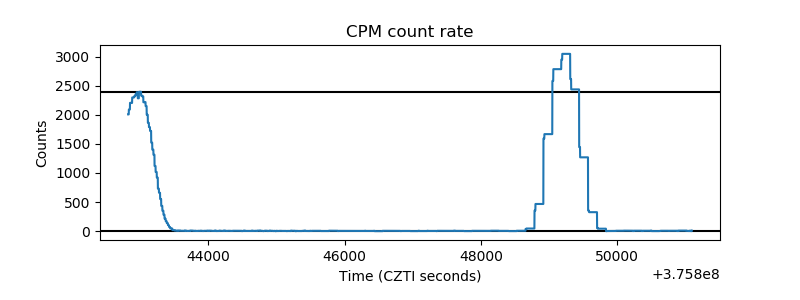 |
| CZT Counter | 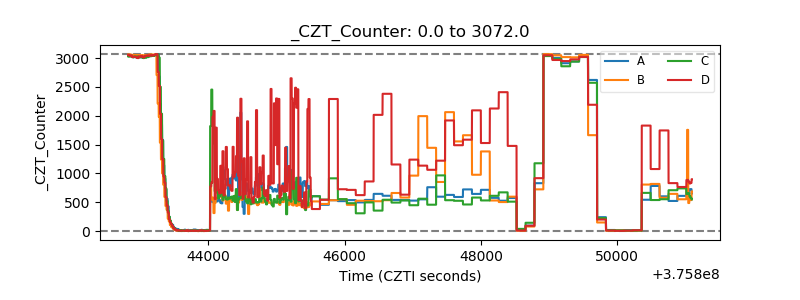 |
| +2.5 Volts monitor | 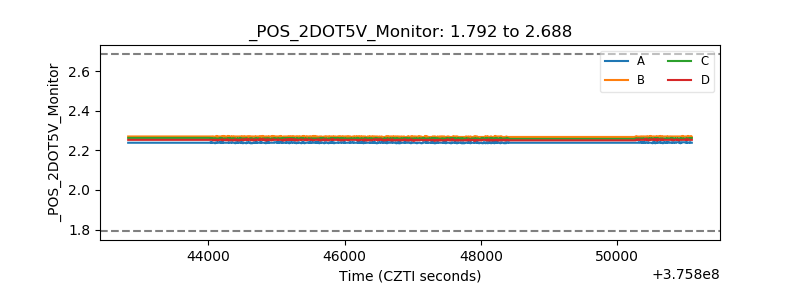 |
| +5 Volts monitor | 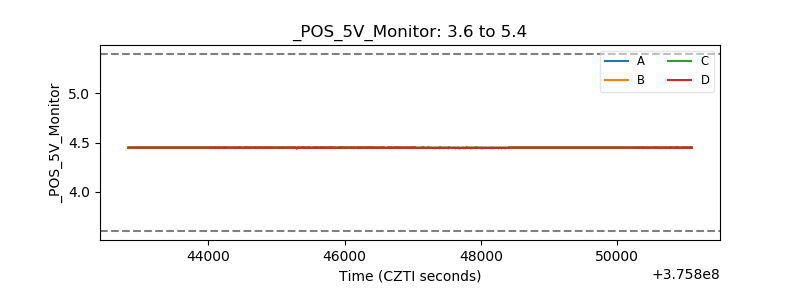 |
| _ROLL_ROT | 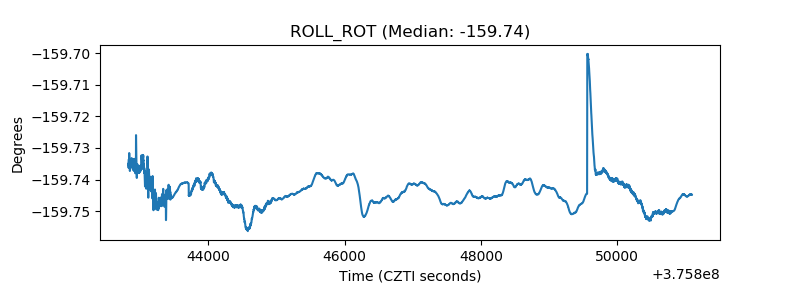 |
| _Roll_DEC | 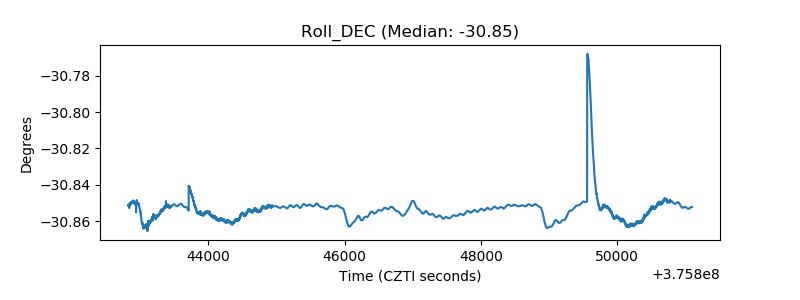 |
| _Roll_RA | 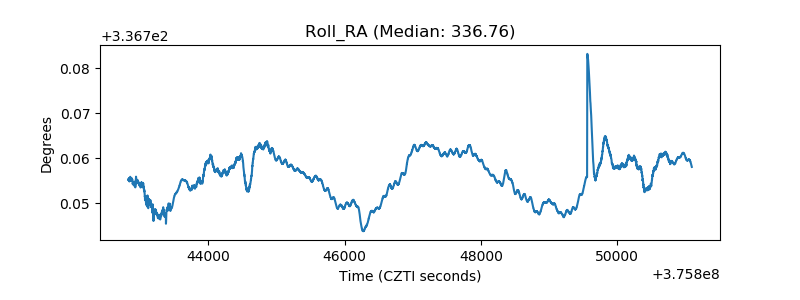 |
| Veto Counter |  |