| Param | Original file | Final file |
|---|---|---|
| Filename | modeM0/AS1A10_058T15_9000004786_33364cztM0_level2.evt | modeM0/AS1A10_058T15_9000004786_33364cztM0_level2_quad_clean.evt |
| Size (bytes) | 614,036,160 | 58,029,120 |
| Size | 585.6 MB | 55.3 MB |
| Events in quadrant A | 3,854,250 | 368,174 |
| Events in quadrant B | 3,878,025 | 361,713 |
| Events in quadrant C | 3,455,642 | 374,300 |
| Events in quadrant D | 7,060,579 | 291,126 |
| Mode M0 | |||
|---|---|---|---|
| Quadrant | BADHDUFLAG | Total packets | Discarded packets |
| A | 0 | 15334 | 3 |
| B | 0 | 14787 | 2 |
| C | 0 | 13511 | 2 |
| D | 0 | 24639 | 2 |
| Mode M9 | |||
|---|---|---|---|
| Quadrant | BADHDUFLAG | Total packets | Discarded packets |
| A | 0 | 31 | 0 |
| B | 0 | 31 | 0 |
| C | 0 | 31 | 0 |
| D | 0 | 32 | 0 |
| Mode SS | |||
|---|---|---|---|
| Quadrant | BADHDUFLAG | Total packets | Discarded packets |
| A | 0 | 104 | 0 |
| B | 0 | 104 | 0 |
| C | 0 | 104 | 0 |
| D | 0 | 104 | 0 |
| Quadrant | Total seconds | Saturated seconds | Saturation percentage |
|---|---|---|---|
| A | 5156 | 38 | 0.737005% |
| B | 5156 | 315 | 6.109387% |
| C | 5156 | 128 | 2.482545% |
| D | 5156 | 1123 | 21.780450% |
Noise dominated data is calculated using 1-second bins in cleaned event files. If a bin has >2000 counts, and if more than 50% of those come from <1% of pixels, then it is considered to be noise-dominated and hence unusable.
| Quadrant | # 1 sec bins | Bins with >0 counts | Bins with >2000 counts | High rate bins dominated by noise | Noise dominated (total time) | Noise dominated (detector-on time) | Marked lightcurve |
|---|---|---|---|---|---|---|---|
| A | 7129 | 5157 | 14 | 14 | 0.20% | 0.27% | 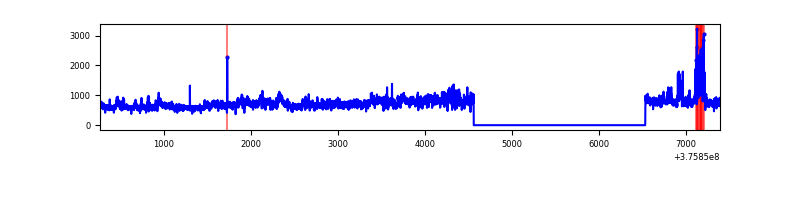 |
| B | 7129 | 5157 | 209 | 209 | 2.93% | 4.05% | 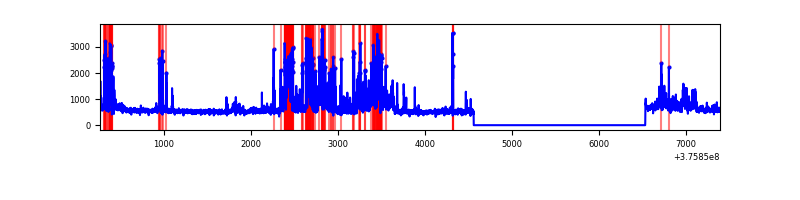 |
| C | 7128 | 5156 | 96 | 96 | 1.35% | 1.86% | 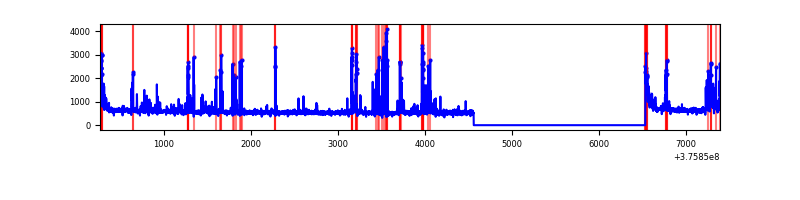 |
| D | 7129 | 5157 | 1076 | 1076 | 15.09% | 20.86% | 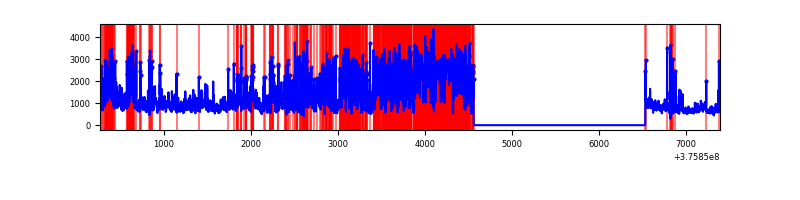 |
Top three noisy pixels from each quadrant. If the there are fewer than three noisy pixels in the level2.evt file, extra rows are filled as -1
| Pixel properties | Quadrant properties | ||||||
|---|---|---|---|---|---|---|---|
| Quadrant | DetID | PixID | Counts | Sigma | Mean | Median | Sigma |
| A | 15 | 169 | 1182490 | 8676.52 | 687 | 675 | 136.2 |
| A | 8 | 205 | 14625 | 102.41 | 687 | 675 | 136.2 |
| A | 13 | 254 | 6804 | 44.99 | 687 | 675 | 136.2 |
| B | 5 | 172 | 617729 | 4947.8 | 674 | 659 | 124.7 |
| B | 0 | 219 | 423954 | 3394.07 | 674 | 659 | 124.7 |
| B | 15 | 85 | 67369 | 534.89 | 674 | 659 | 124.7 |
| C | 1 | 23 | 291694 | 1921.58 | 667 | 674 | 151.4 |
| C | 15 | 214 | 226581 | 1491.65 | 667 | 674 | 151.4 |
| C | 0 | 10 | 137426 | 902.96 | 667 | 674 | 151.4 |
| D | 1 | 52 | 2303884 | 15397.31 | 619 | 604 | 149.6 |
| D | 12 | 218 | 795806 | 5315.89 | 619 | 604 | 149.6 |
| D | 8 | 195 | 625636 | 4178.31 | 619 | 604 | 149.6 |
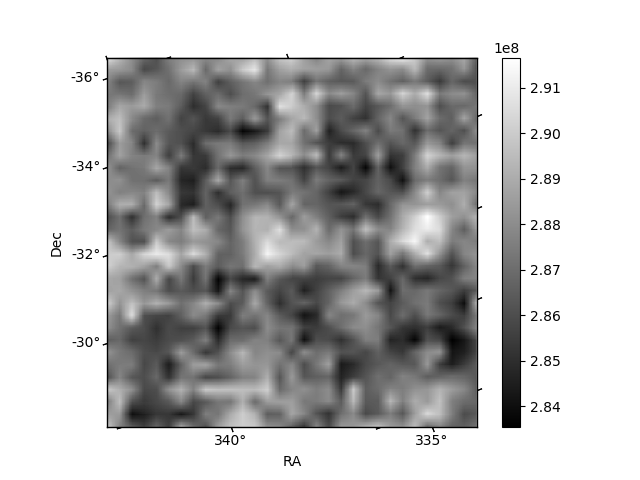
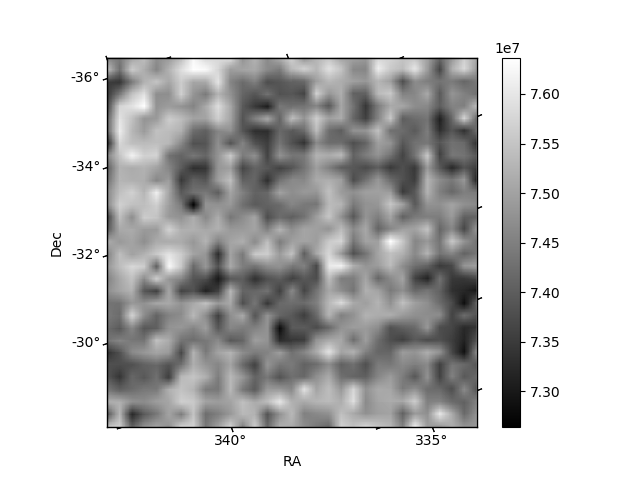
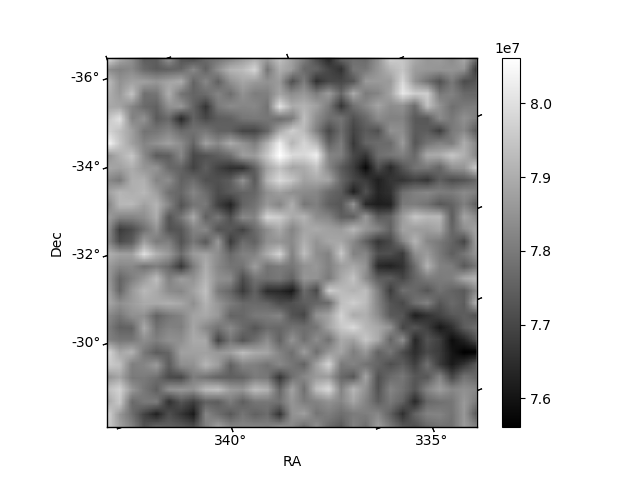
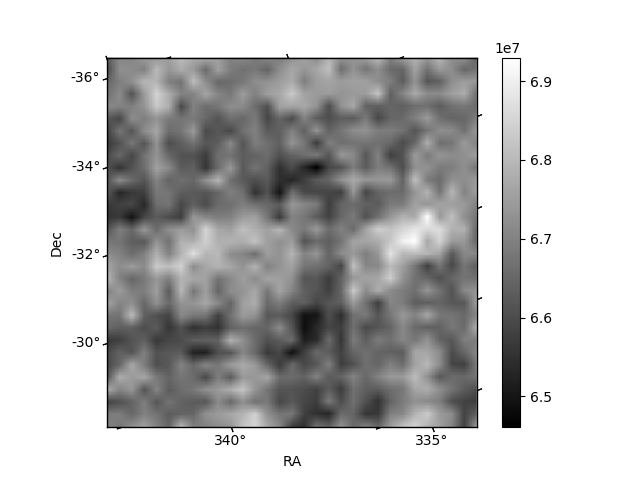
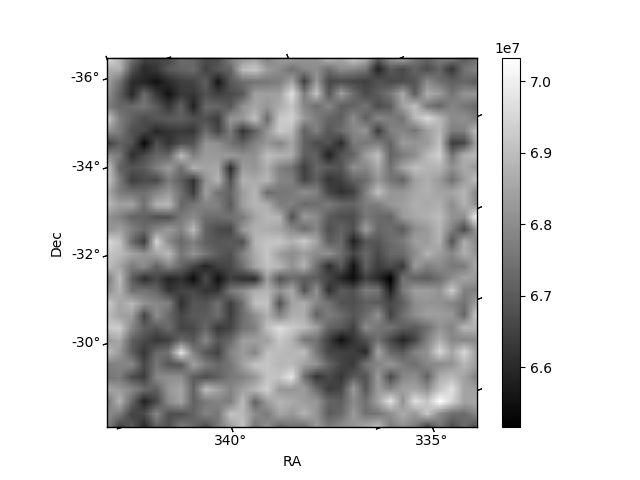
Histogram calculated using DETX and DETY for each event in the final _common_clean file
| Quadrant A | 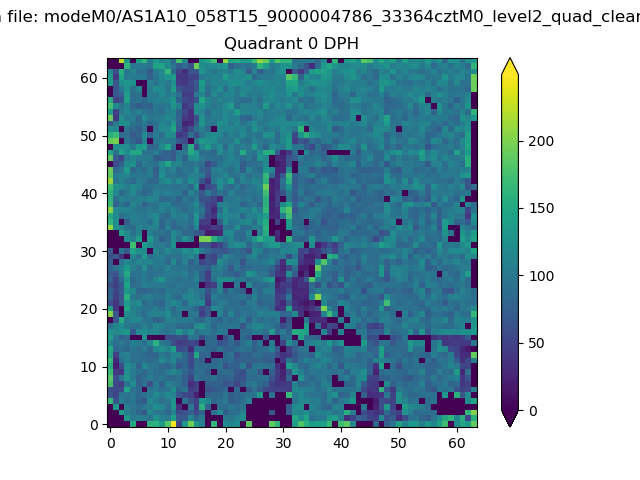 |
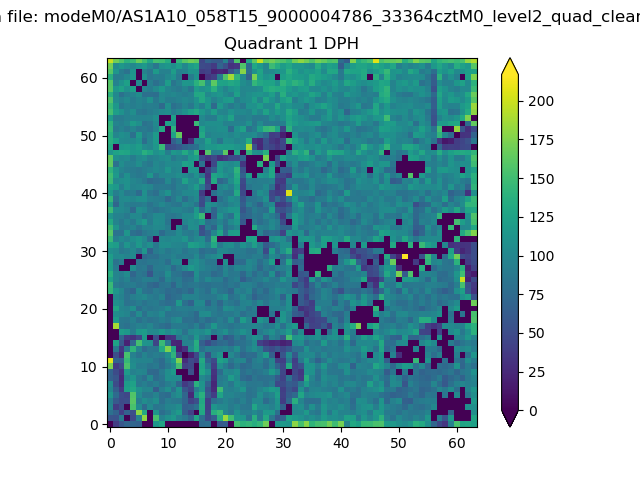 |
Quadrant B |
|---|---|---|---|
| Quadrant D | 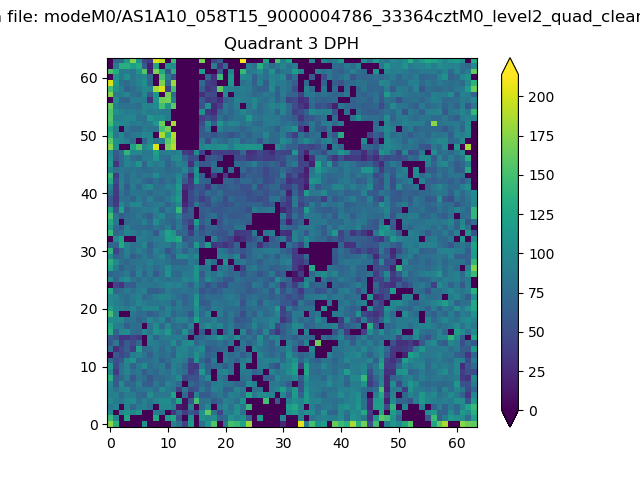 |
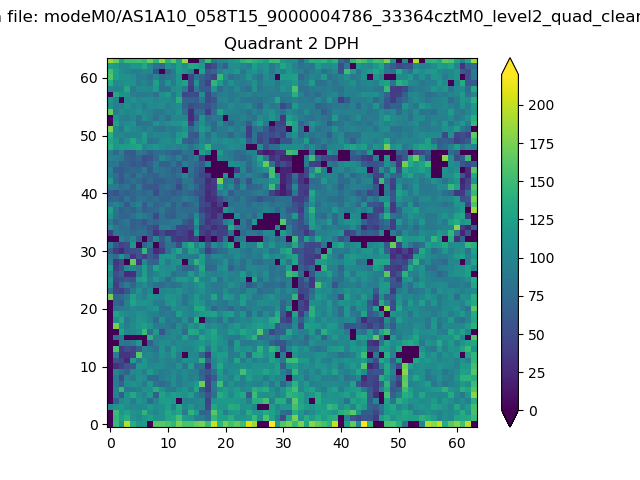 |
Quadrant C |
| Plot type | Count rate plots | Images |
|---|---|---|
| Comparison with Poisson distribution Blue bars denote a histogram of data divided into 1 sec bins. Red curve is a Poisson curve with rate = median count rate of data. |
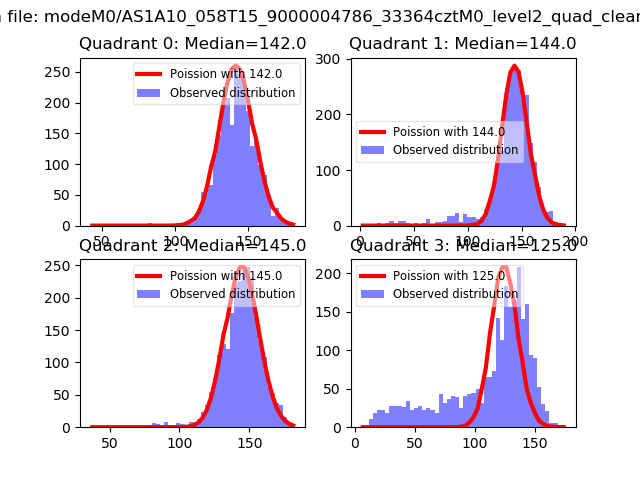 |
 |
| Quadrant-wise count rates Data is divided into 100 sec bins |
 |
|
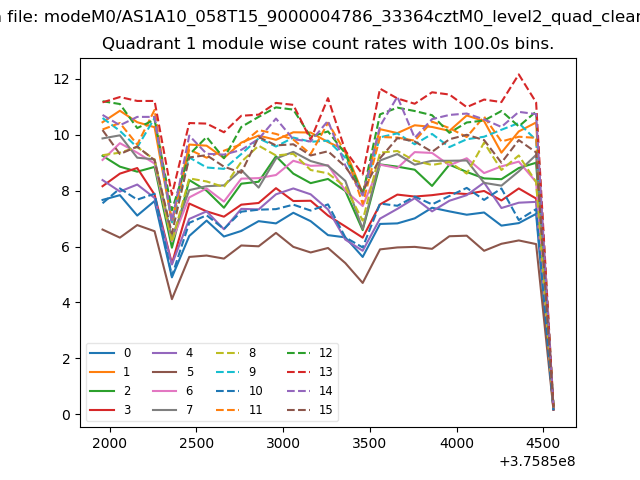
| Module-wise count rates for Quadrant A Data is divided into 100 sec bins |
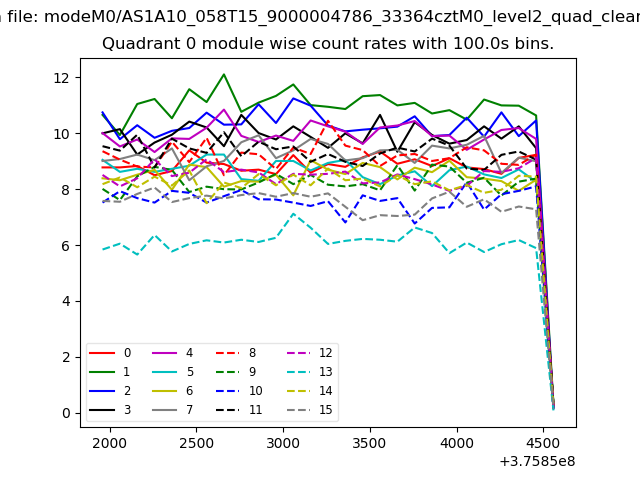 |
 |
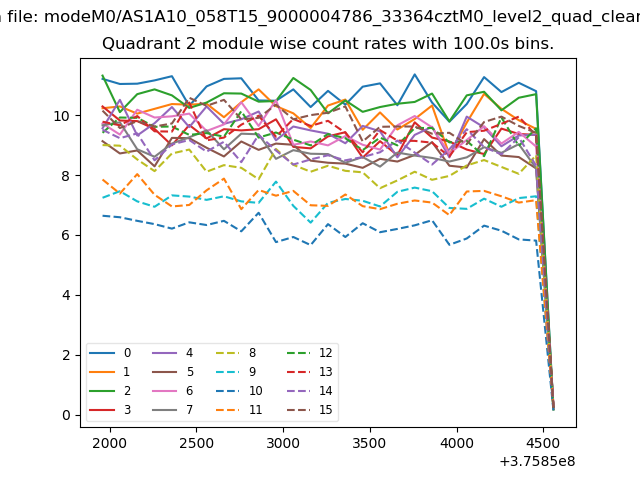
| Module-wise count rates for Quadrant B Data is divided into 100 sec bins |
 |
 |
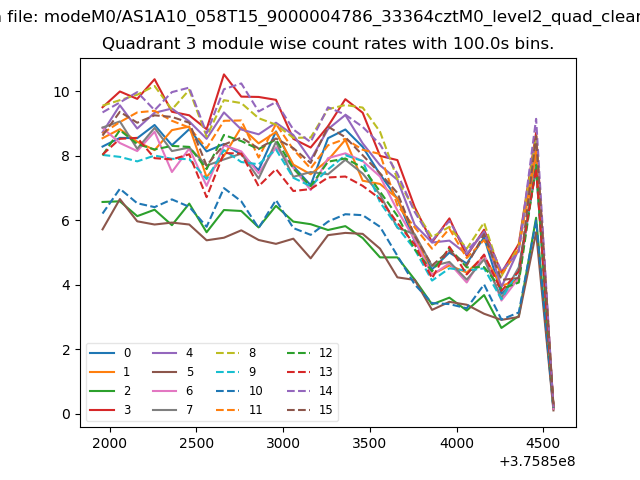
| Module-wise count rates for Quadrant C Data is divided into 100 sec bins |
 |
 |
| Module-wise count rates for Quadrant D Data is divided into 100 sec bins |
 |
 |
| Parameter | Plot |
|---|---|
| CZT HV Monitor | 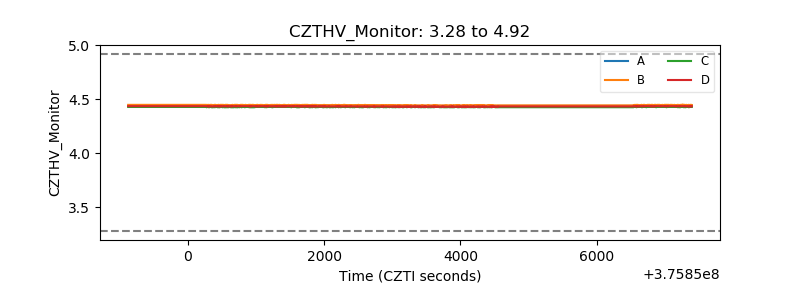 |
| D_VDD | 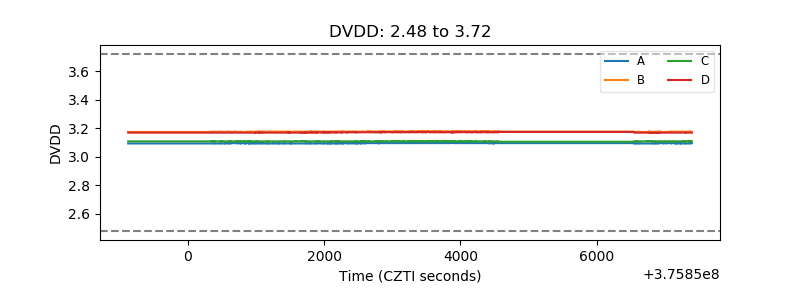 |
| Temperature 1 | 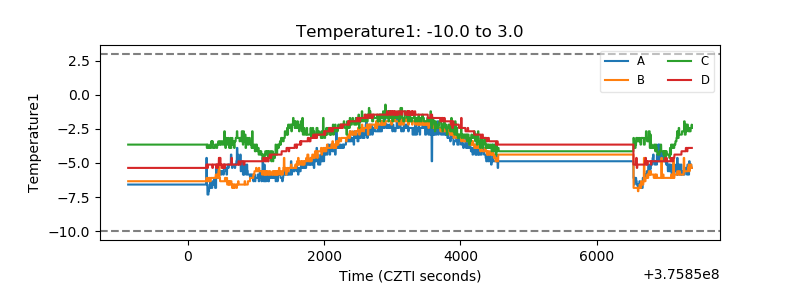 |
| Veto HV Monitor | 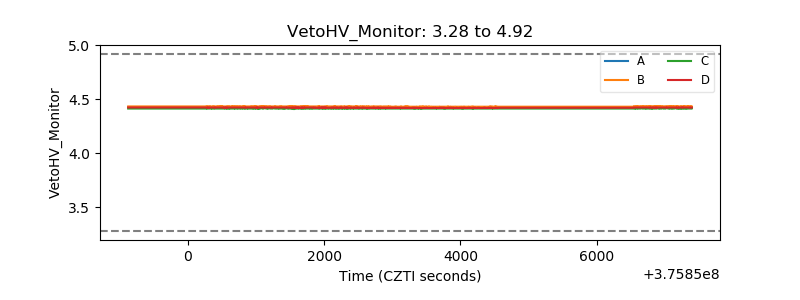 |
| Veto LLD | 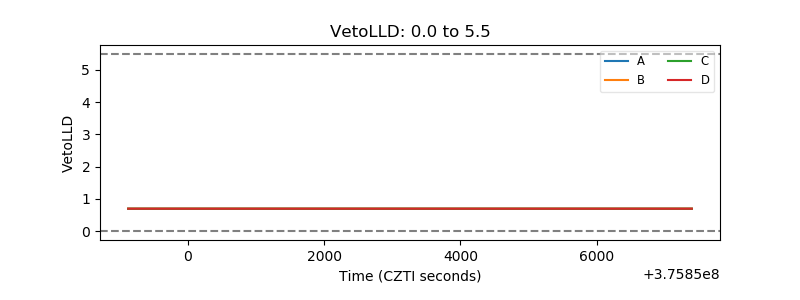 |
| Alpha Counter |  |
| _CPM_Rate | 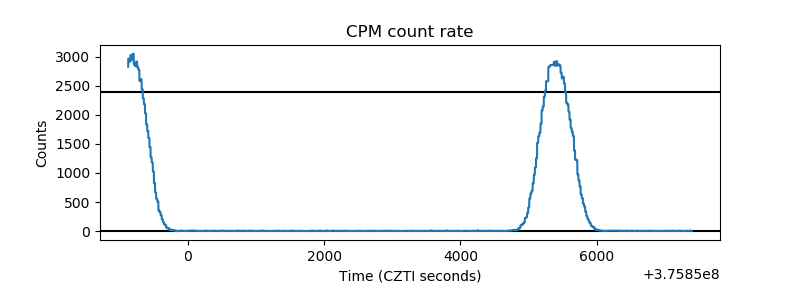 |
| CZT Counter | 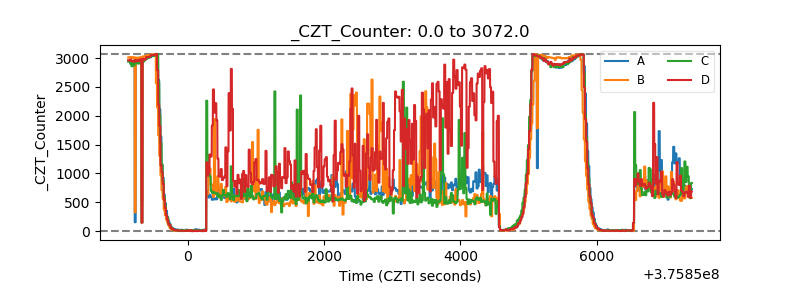 |
| +2.5 Volts monitor |  |
| +5 Volts monitor |  |
| _ROLL_ROT | 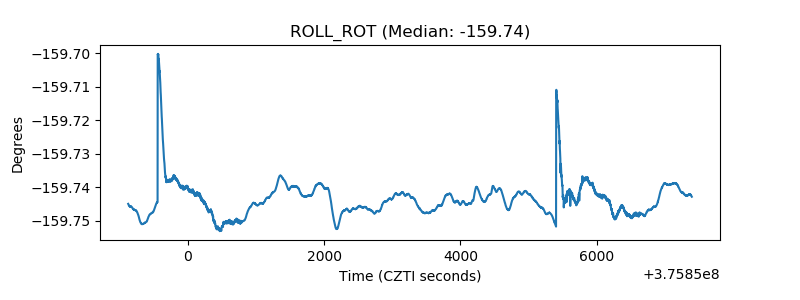 |
| _Roll_DEC | 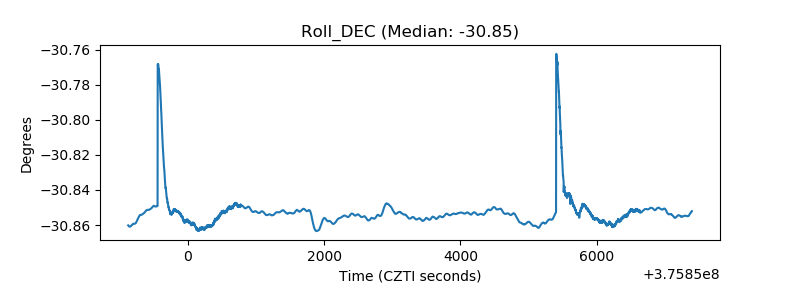 |
| _Roll_RA | 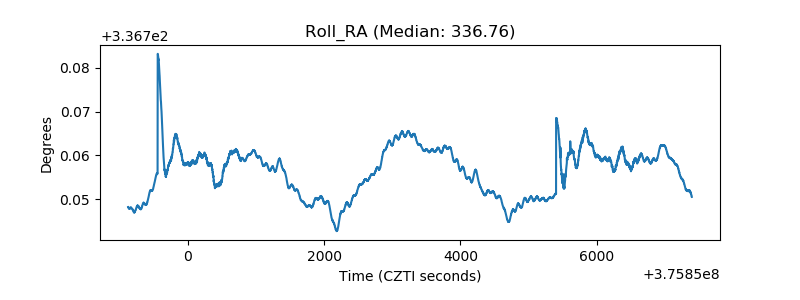 |
| Veto Counter | 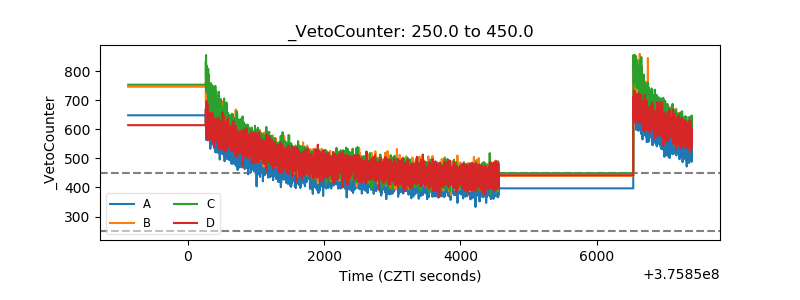 |