| Param | Original file | Final file |
|---|---|---|
| Filename | modeM0/AS1A10_058T15_9000004786_33368cztM0_level2.evt | modeM0/AS1A10_058T15_9000004786_33368cztM0_level2_quad_clean.evt |
| Size (bytes) | 496,961,280 | 89,625,600 |
| Size | 473.9 MB | 85.5 MB |
| Events in quadrant A | 2,413,931 | 606,060 |
| Events in quadrant B | 3,764,321 | 596,827 |
| Events in quadrant C | 3,080,813 | 595,975 |
| Events in quadrant D | 5,447,349 | 559,019 |
| Mode M0 | |||
|---|---|---|---|
| Quadrant | BADHDUFLAG | Total packets | Discarded packets |
| A | 0 | 10272 | 3 |
| B | 0 | 14487 | 2 |
| C | 0 | 12172 | 2 |
| D | 0 | 19820 | 2 |
| Mode M9 | |||
|---|---|---|---|
| Quadrant | BADHDUFLAG | Total packets | Discarded packets |
| A | 0 | 25 | 0 |
| B | 0 | 25 | 0 |
| C | 0 | 25 | 0 |
| D | 0 | 26 | 0 |
| Mode SS | |||
|---|---|---|---|
| Quadrant | BADHDUFLAG | Total packets | Discarded packets |
| A | 0 | 102 | 0 |
| B | 0 | 102 | 0 |
| C | 0 | 102 | 0 |
| D | 0 | 102 | 0 |
| Quadrant | Total seconds | Saturated seconds | Saturation percentage |
|---|---|---|---|
| A | 5088 | 3 | 0.058962% |
| B | 5088 | 208 | 4.088050% |
| C | 5088 | 100 | 1.965409% |
| D | 5088 | 408 | 8.018868% |
Noise dominated data is calculated using 1-second bins in cleaned event files. If a bin has >2000 counts, and if more than 50% of those come from <1% of pixels, then it is considered to be noise-dominated and hence unusable.
| Quadrant | # 1 sec bins | Bins with >0 counts | Bins with >2000 counts | High rate bins dominated by noise | Noise dominated (total time) | Noise dominated (detector-on time) | Marked lightcurve |
|---|---|---|---|---|---|---|---|
| A | 7030 | 5089 | 0 | 0 | 0.00% | 0.00% | 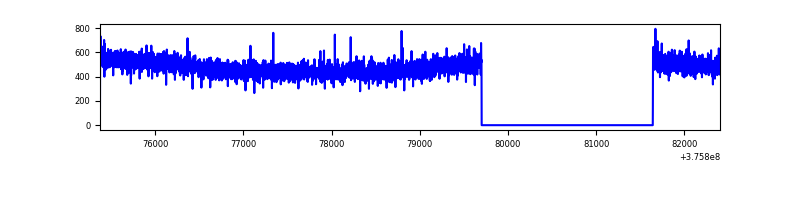 |
| B | 7030 | 5089 | 116 | 116 | 1.65% | 2.28% | 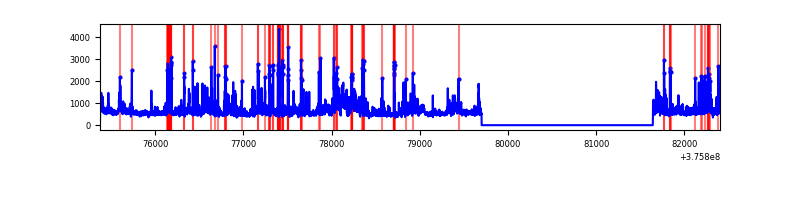 |
| C | 7030 | 5089 | 82 | 82 | 1.17% | 1.61% | 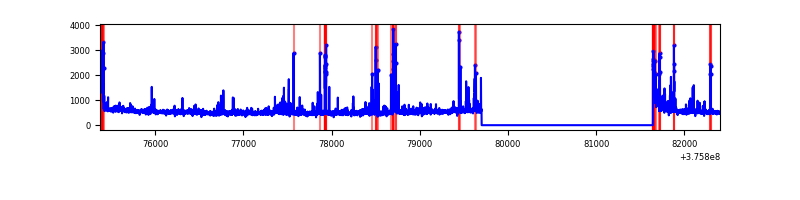 |
| D | 7030 | 5088 | 342 | 342 | 4.86% | 6.72% | 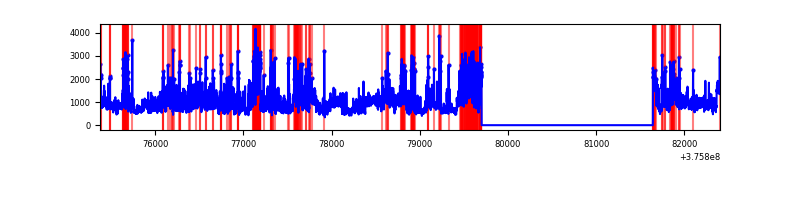 |
Top three noisy pixels from each quadrant. If the there are fewer than three noisy pixels in the level2.evt file, extra rows are filled as -1
| Pixel properties | Quadrant properties | ||||||
|---|---|---|---|---|---|---|---|
| Quadrant | DetID | PixID | Counts | Sigma | Mean | Median | Sigma |
| A | 13 | 254 | 7872 | 58.89 | 623 | 612 | 123.3 |
| A | 3 | 137 | 5636 | 40.75 | 623 | 612 | 123.3 |
| A | 0 | 226 | 5404 | 38.87 | 623 | 612 | 123.3 |
| B | 0 | 219 | 458116 | 3956.7 | 611 | 598 | 115.6 |
| B | 5 | 200 | 221683 | 1911.99 | 611 | 598 | 115.6 |
| B | 0 | 189 | 192256 | 1657.49 | 611 | 598 | 115.6 |
| C | 15 | 208 | 324163 | 2385.05 | 590 | 597 | 135.7 |
| C | 15 | 214 | 223002 | 1639.38 | 590 | 597 | 135.7 |
| C | 0 | 10 | 163369 | 1199.82 | 590 | 597 | 135.7 |
| D | 8 | 195 | 1156546 | 7464.86 | 584 | 570 | 154.9 |
| D | 1 | 52 | 914125 | 5899.39 | 584 | 570 | 154.9 |
| D | 2 | 250 | 353030 | 2276.05 | 584 | 570 | 154.9 |
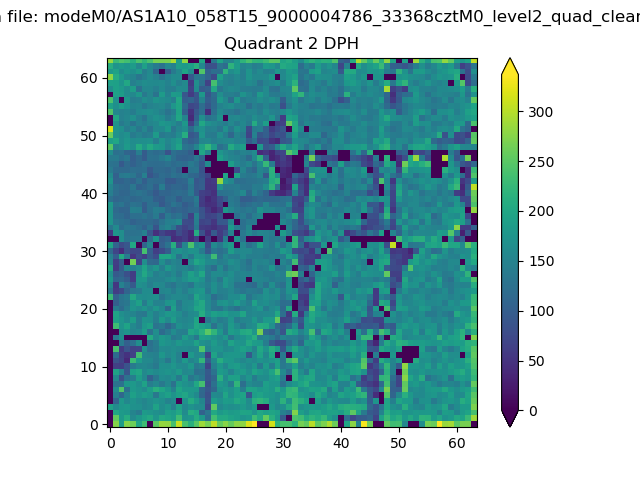
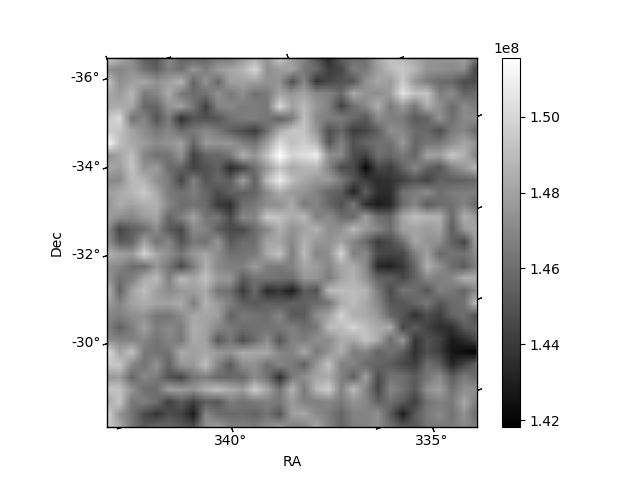
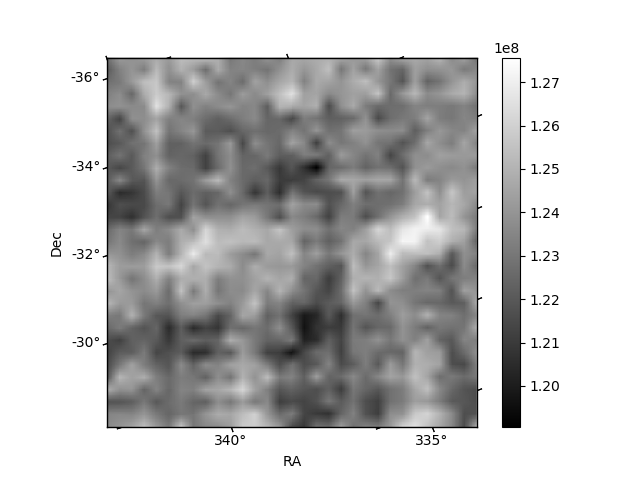
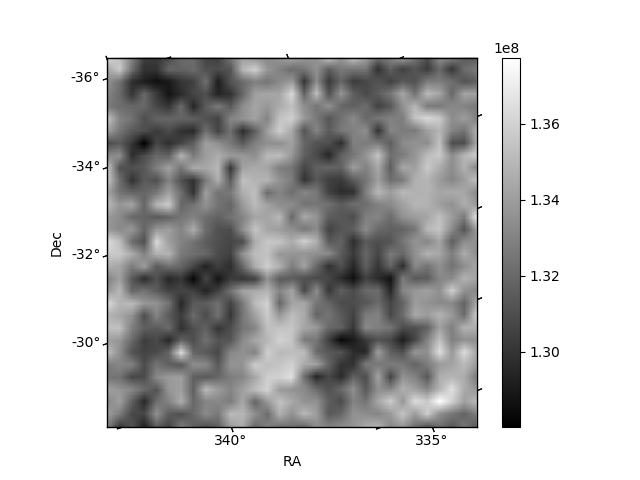
Histogram calculated using DETX and DETY for each event in the final _common_clean file
| Quadrant A | 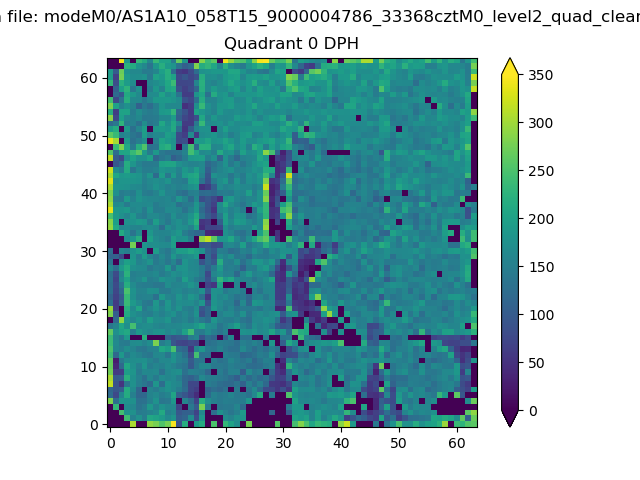 |
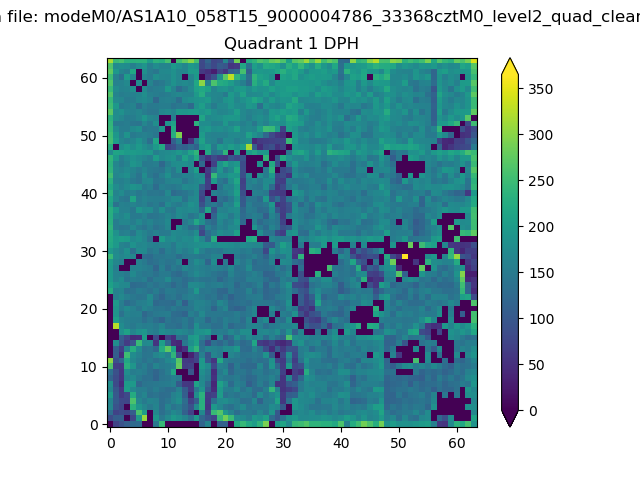 |
Quadrant B |
|---|---|---|---|
| Quadrant D | 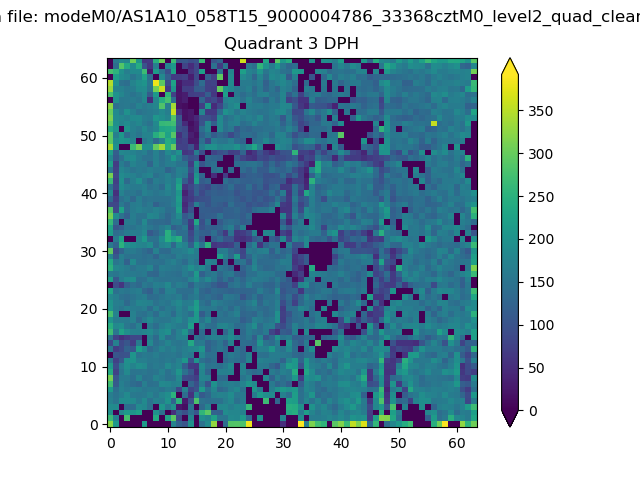 |
 |
Quadrant C |
| Plot type | Count rate plots | Images |
|---|---|---|
| Comparison with Poisson distribution Blue bars denote a histogram of data divided into 1 sec bins. Red curve is a Poisson curve with rate = median count rate of data. |
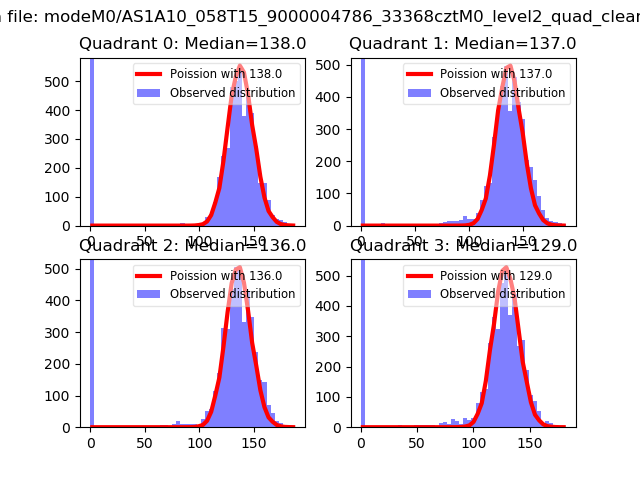 |
 |
| Quadrant-wise count rates Data is divided into 100 sec bins |
 |
|
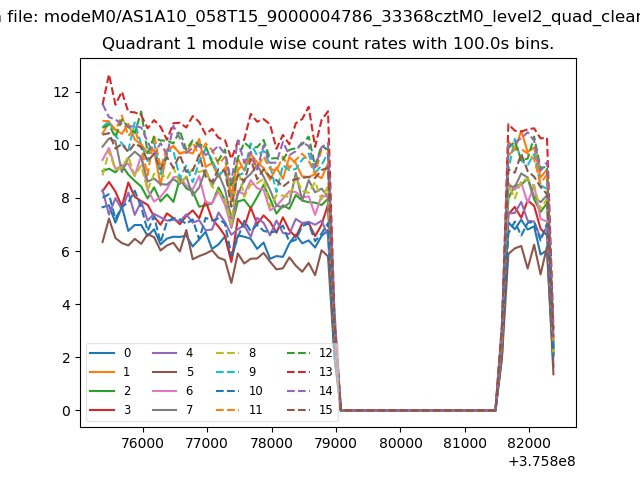
| Module-wise count rates for Quadrant A Data is divided into 100 sec bins |
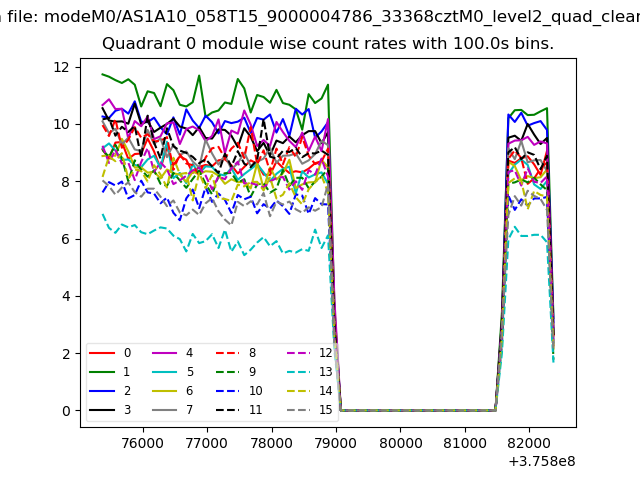 |
 |
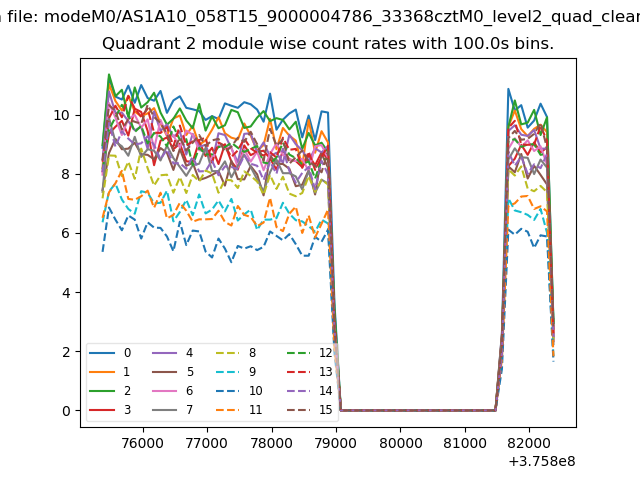
| Module-wise count rates for Quadrant B Data is divided into 100 sec bins |
 |
 |
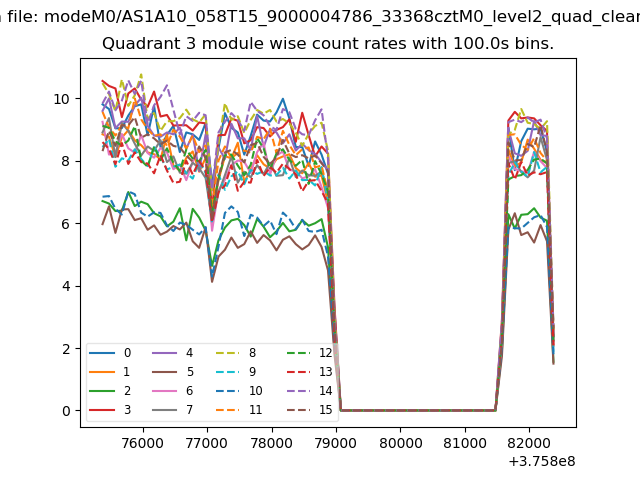
| Module-wise count rates for Quadrant C Data is divided into 100 sec bins |
 |
 |
| Module-wise count rates for Quadrant D Data is divided into 100 sec bins |
 |
 |
| Parameter | Plot |
|---|---|
| CZT HV Monitor | 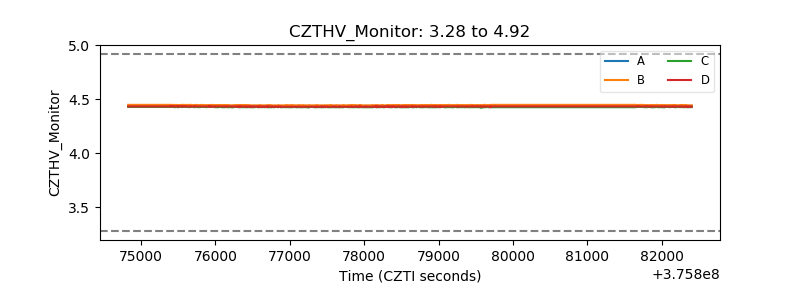 |
| D_VDD | 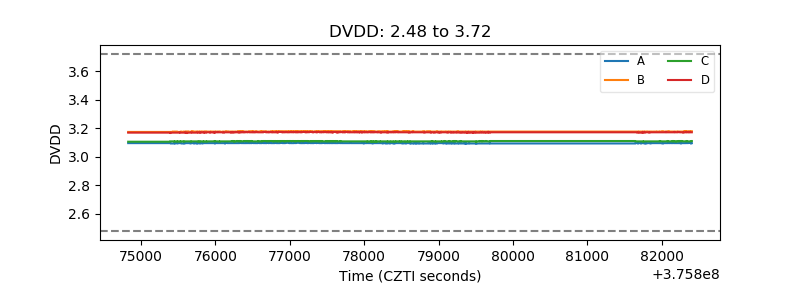 |
| Temperature 1 | 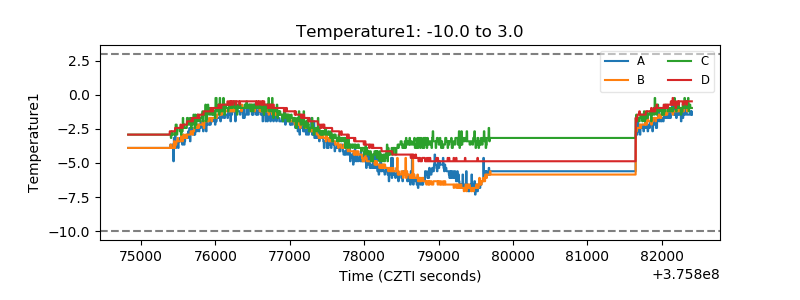 |
| Veto HV Monitor | 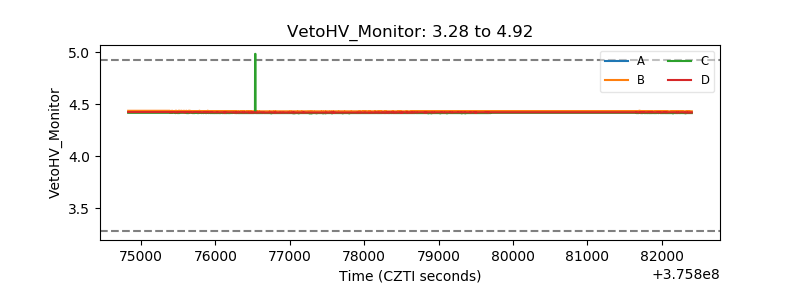 |
| Veto LLD | 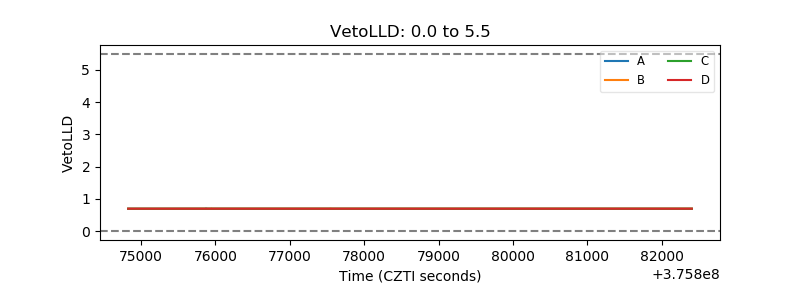 |
| Alpha Counter |  |
| _CPM_Rate | 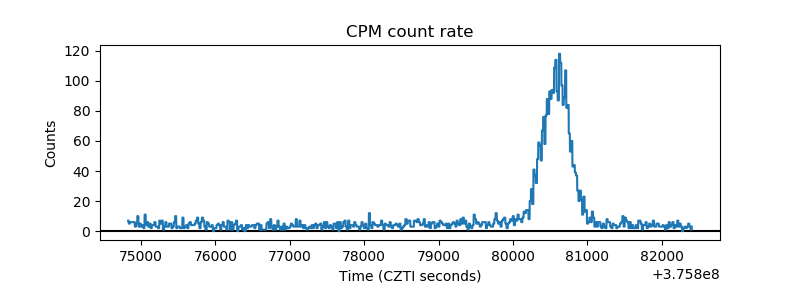 |
| CZT Counter | 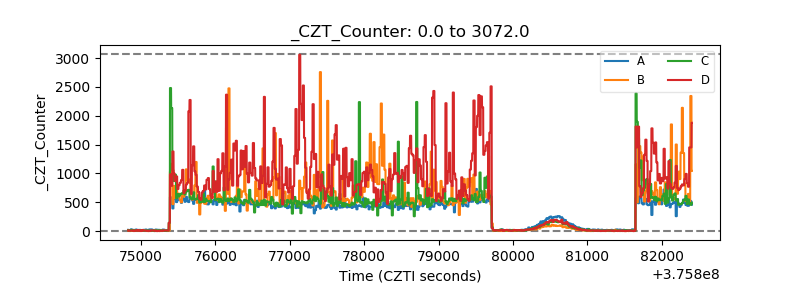 |
| +2.5 Volts monitor | 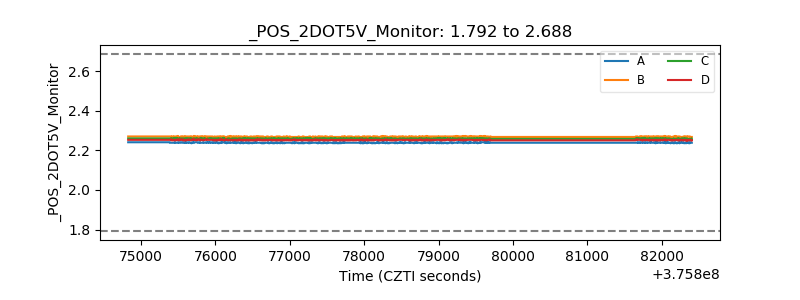 |
| +5 Volts monitor |  |
| _ROLL_ROT | 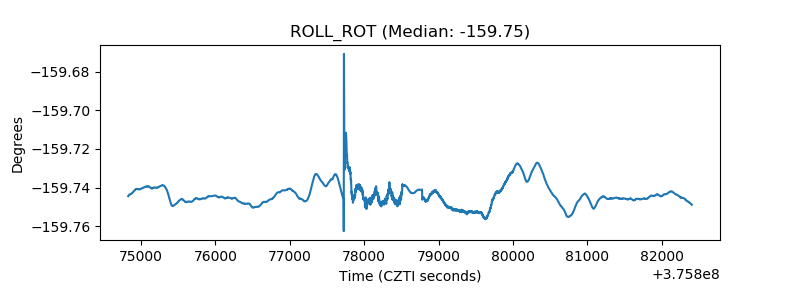 |
| _Roll_DEC | 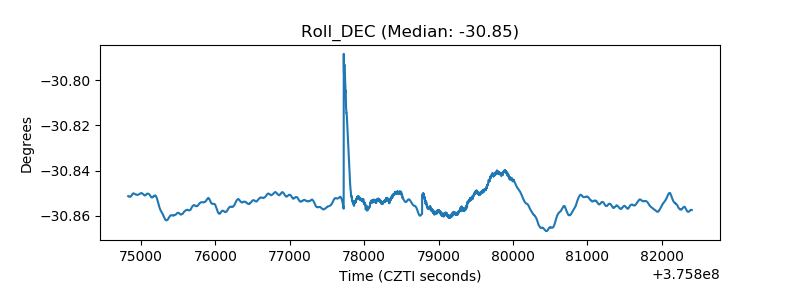 |
| _Roll_RA | 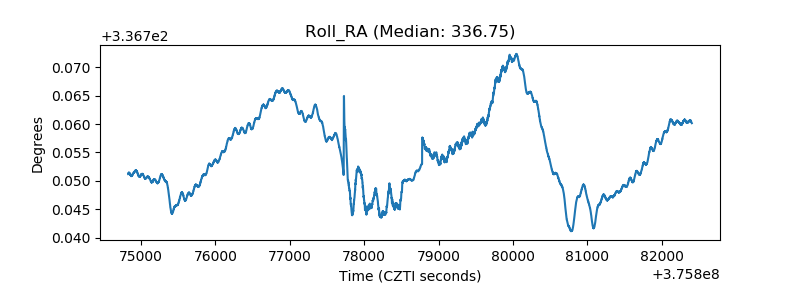 |
| Veto Counter | 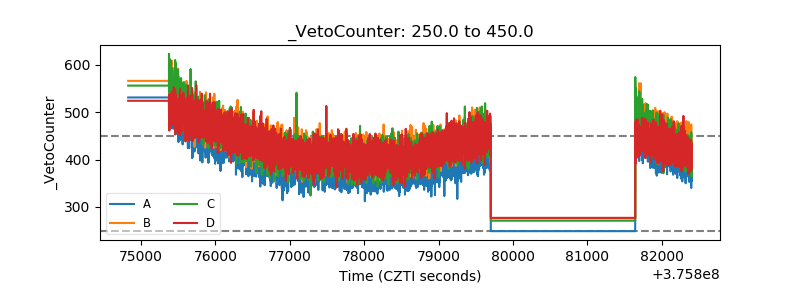 |