| Param | Original file | Final file |
|---|---|---|
| Filename | modeM0/AS1A10_058T15_9000004786_33369cztM0_level2.evt | modeM0/AS1A10_058T15_9000004786_33369cztM0_level2_quad_clean.evt |
| Size (bytes) | 260,988,480 | 45,342,720 |
| Size | 248.9 MB | 43.2 MB |
| Events in quadrant A | 1,083,180 | 314,464 |
| Events in quadrant B | 1,835,417 | 308,364 |
| Events in quadrant C | 1,383,495 | 309,339 |
| Events in quadrant D | 3,438,450 | 268,392 |
| Mode M0 | |||
|---|---|---|---|
| Quadrant | BADHDUFLAG | Total packets | Discarded packets |
| A | 0 | 4800 | 1 |
| B | 0 | 7005 | 1 |
| C | 0 | 5580 | 1 |
| D | 0 | 11902 | 1 |
| Mode M9 | |||
|---|---|---|---|
| Quadrant | BADHDUFLAG | Total packets | Discarded packets |
| A | 0 | 16 | 0 |
| B | 0 | 16 | 0 |
| C | 0 | 16 | 0 |
| D | 0 | 17 | 0 |
| Mode SS | |||
|---|---|---|---|
| Quadrant | BADHDUFLAG | Total packets | Discarded packets |
| A | 0 | 48 | 0 |
| B | 0 | 48 | 0 |
| C | 0 | 48 | 0 |
| D | 0 | 48 | 0 |
| Quadrant | Total seconds | Saturated seconds | Saturation percentage |
|---|---|---|---|
| A | 2386 | 2 | 0.083822% |
| B | 2386 | 163 | 6.831517% |
| C | 2386 | 29 | 1.215423% |
| D | 2386 | 551 | 23.093043% |
Noise dominated data is calculated using 1-second bins in cleaned event files. If a bin has >2000 counts, and if more than 50% of those come from <1% of pixels, then it is considered to be noise-dominated and hence unusable.
| Quadrant | # 1 sec bins | Bins with >0 counts | Bins with >2000 counts | High rate bins dominated by noise | Noise dominated (total time) | Noise dominated (detector-on time) | Marked lightcurve |
|---|---|---|---|---|---|---|---|
| A | 2386 | 2386 | 0 | 0 | 0.00% | 0.00% | 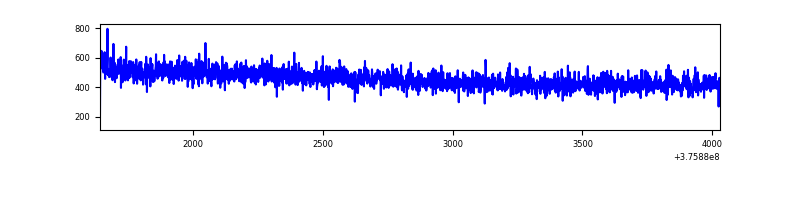 |
| B | 2386 | 2386 | 81 | 81 | 3.39% | 3.39% | 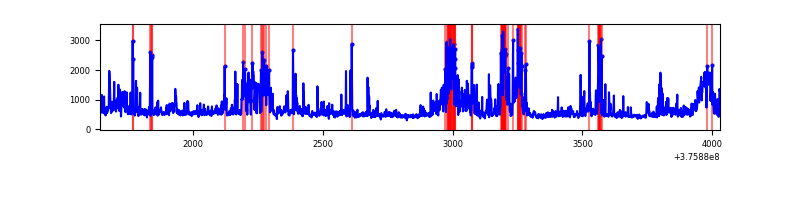 |
| C | 2386 | 2386 | 30 | 30 | 1.26% | 1.26% | 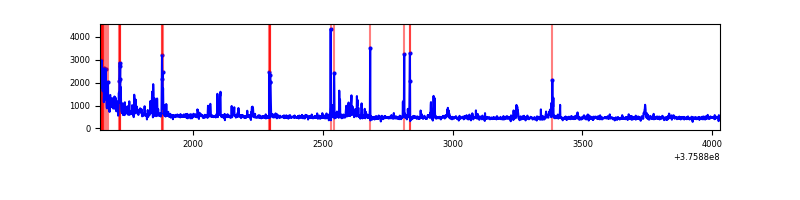 |
| D | 2386 | 2386 | 576 | 576 | 24.14% | 24.14% | 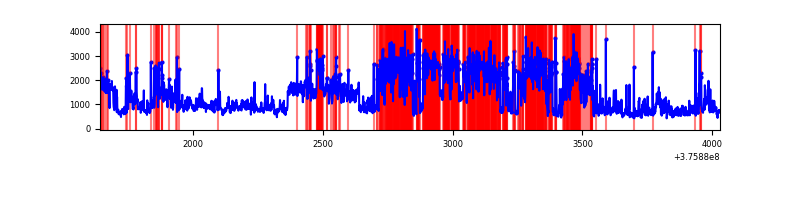 |
Top three noisy pixels from each quadrant. If the there are fewer than three noisy pixels in the level2.evt file, extra rows are filled as -1
| Pixel properties | Quadrant properties | ||||||
|---|---|---|---|---|---|---|---|
| Quadrant | DetID | PixID | Counts | Sigma | Mean | Median | Sigma |
| A | 13 | 254 | 4323 | 70.84 | 279 | 273 | 57.2 |
| A | 13 | 6 | 2834 | 44.79 | 279 | 273 | 57.2 |
| A | 3 | 137 | 2528 | 39.44 | 279 | 273 | 57.2 |
| B | 0 | 219 | 304969 | 5705.13 | 271 | 264 | 53.4 |
| B | 5 | 172 | 292836 | 5477.96 | 271 | 264 | 53.4 |
| B | 0 | 189 | 56369 | 1050.48 | 271 | 264 | 53.4 |
| C | 15 | 214 | 106722 | 1737.26 | 261 | 264 | 61.3 |
| C | 15 | 208 | 94558 | 1538.76 | 261 | 264 | 61.3 |
| C | 0 | 10 | 90121 | 1466.35 | 261 | 264 | 61.3 |
| D | 1 | 52 | 1293411 | 20117.53 | 248 | 242 | 64.3 |
| D | 8 | 195 | 812856 | 12641.65 | 248 | 242 | 64.3 |
| D | 2 | 250 | 183768 | 2855.07 | 248 | 242 | 64.3 |
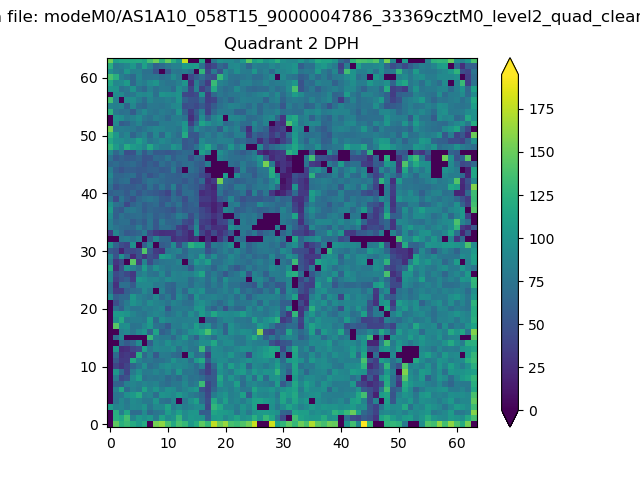
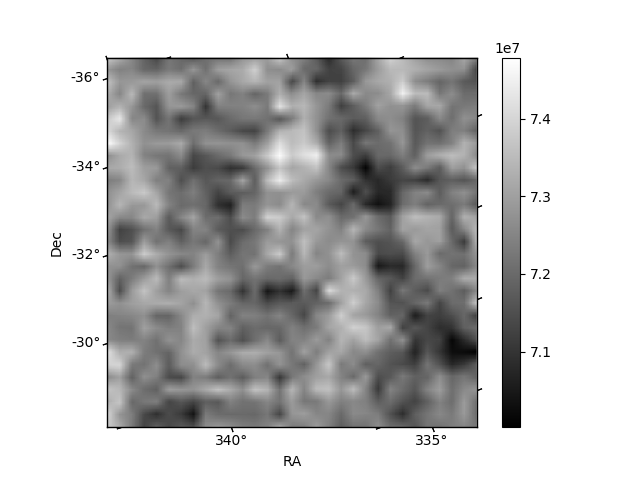
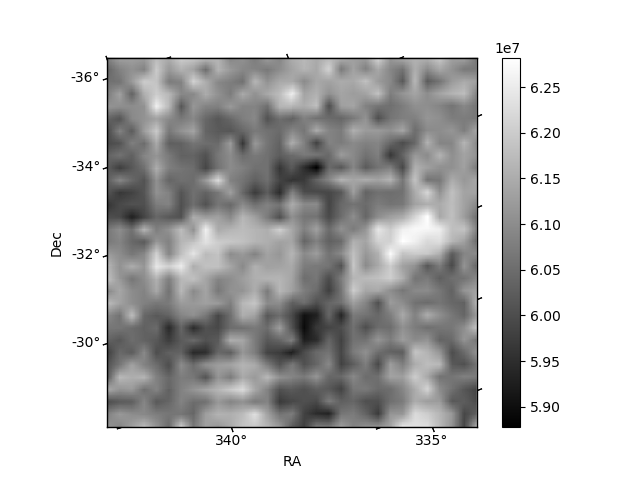
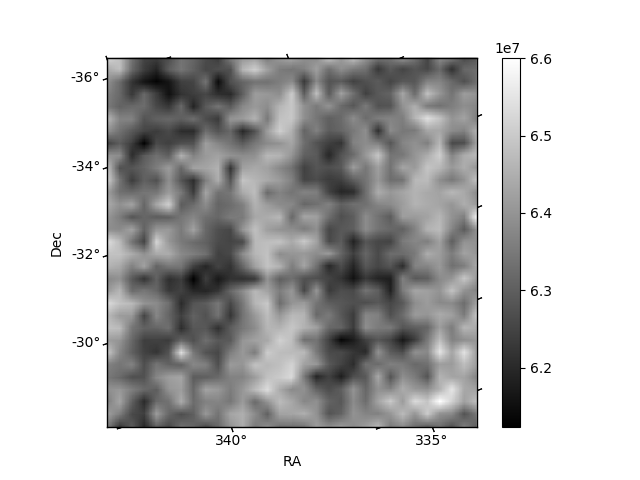
Histogram calculated using DETX and DETY for each event in the final _common_clean file
| Quadrant A | 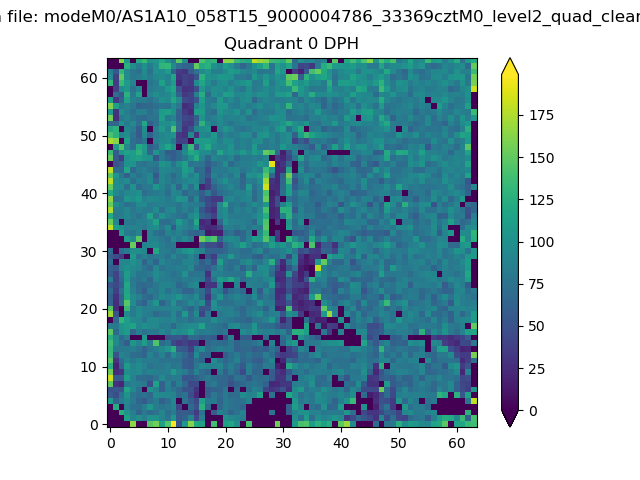 |
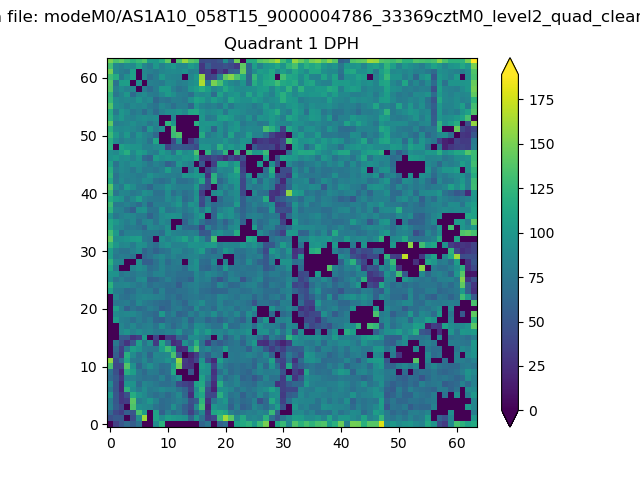 |
Quadrant B |
|---|---|---|---|
| Quadrant D | 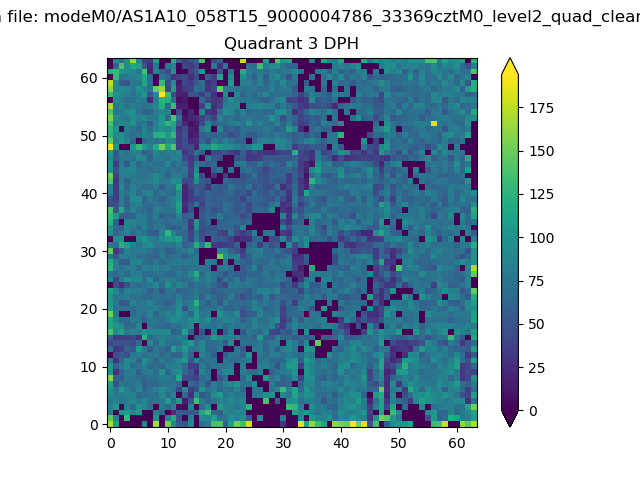 |
 |
Quadrant C |
| Plot type | Count rate plots | Images |
|---|---|---|
| Comparison with Poisson distribution Blue bars denote a histogram of data divided into 1 sec bins. Red curve is a Poisson curve with rate = median count rate of data. |
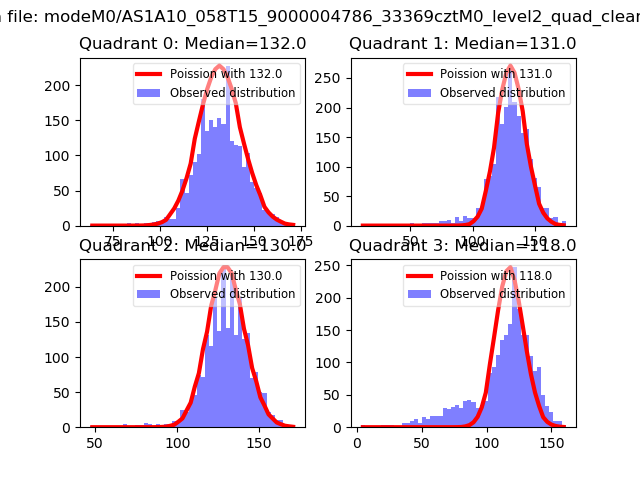 |
 |
| Quadrant-wise count rates Data is divided into 100 sec bins |
 |
|
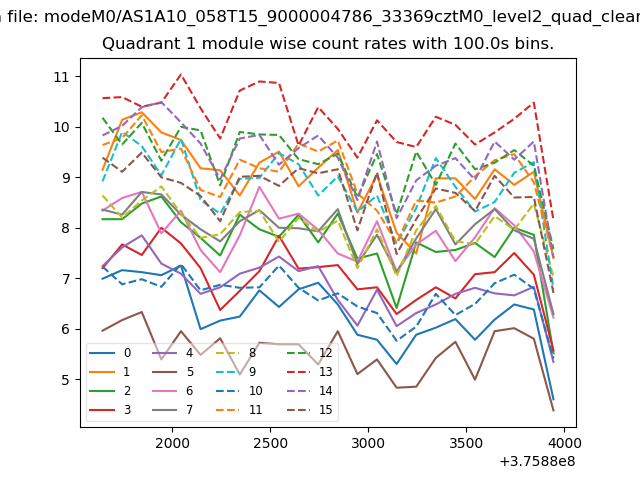
| Module-wise count rates for Quadrant A Data is divided into 100 sec bins |
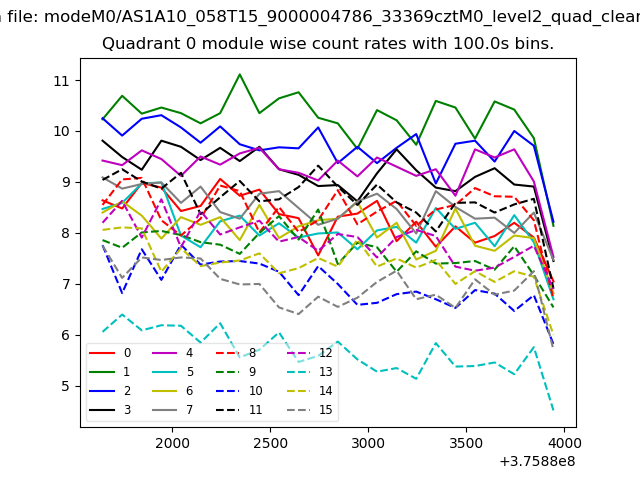 |
 |
| Module-wise count rates for Quadrant B Data is divided into 100 sec bins |
 |
 |
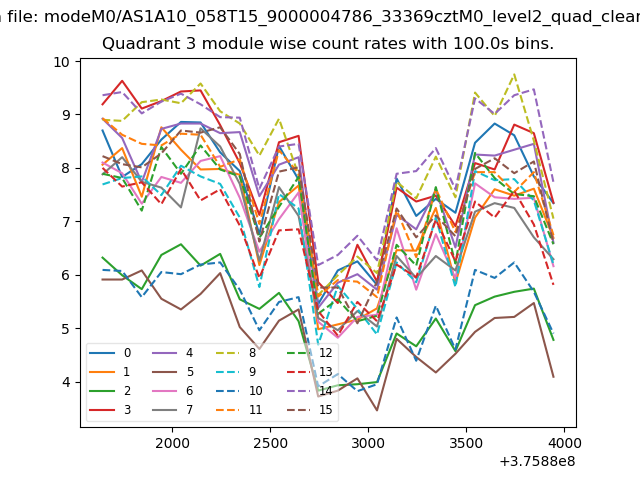
| Module-wise count rates for Quadrant C Data is divided into 100 sec bins |
 |
 |
| Module-wise count rates for Quadrant D Data is divided into 100 sec bins |
 |
 |
| Parameter | Plot |
|---|---|
| CZT HV Monitor | 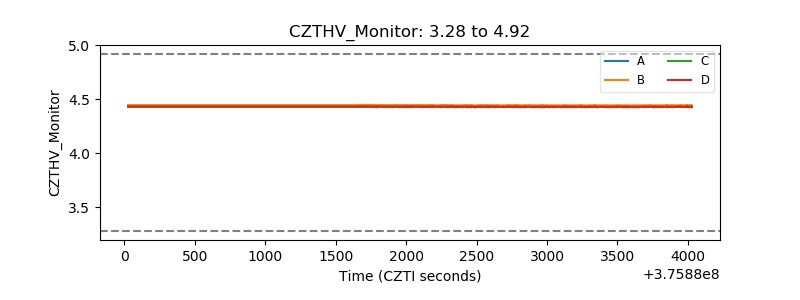 |
| D_VDD | 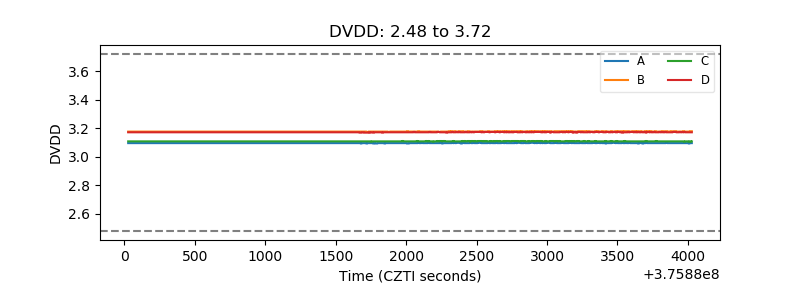 |
| Temperature 1 | 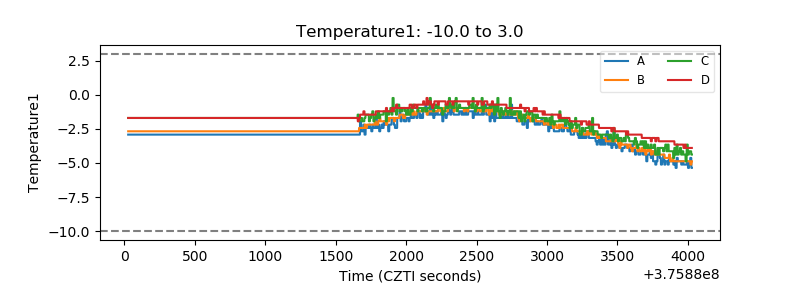 |
| Veto HV Monitor |  |
| Veto LLD |  |
| Alpha Counter |  |
| _CPM_Rate | 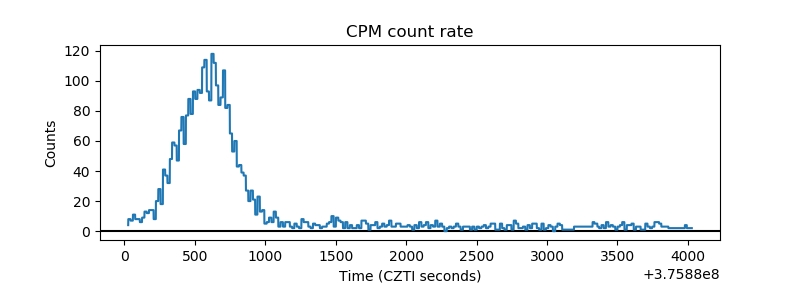 |
| CZT Counter | 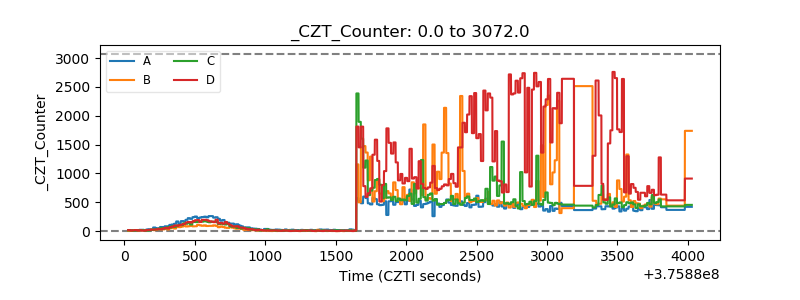 |
| +2.5 Volts monitor | 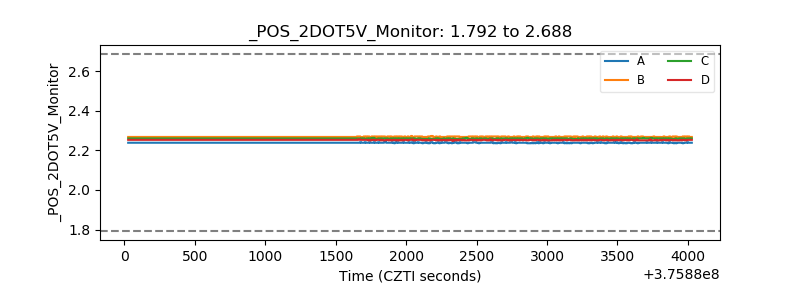 |
| +5 Volts monitor |  |
| _ROLL_ROT | 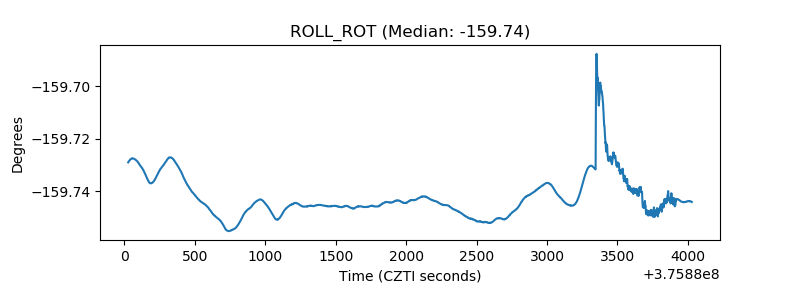 |
| _Roll_DEC |  |
| _Roll_RA | 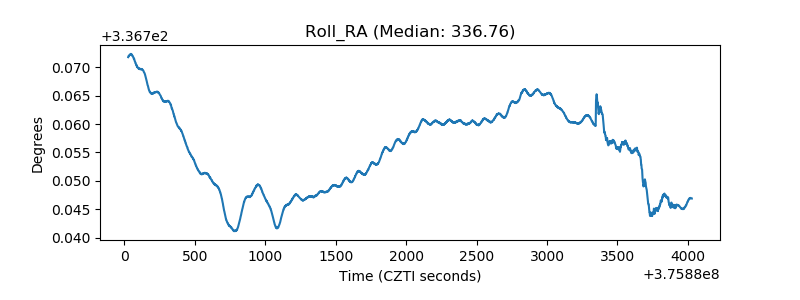 |
| Veto Counter |  |