| Param | Original file | Final file |
|---|---|---|
| Filename | modeM0/AS1A10_090T11_9000004784_33335cztM0_level2.evt | modeM0/AS1A10_090T11_9000004784_33335cztM0_level2_quad_clean.evt |
| Size (bytes) | 562,613,760 | 72,092,160 |
| Size | 536.6 MB | 68.8 MB |
| Events in quadrant A | 2,793,300 | 474,205 |
| Events in quadrant B | 4,459,594 | 443,554 |
| Events in quadrant C | 4,202,386 | 464,908 |
| Events in quadrant D | 5,239,547 | 443,119 |
| Mode M0 | |||
|---|---|---|---|
| Quadrant | BADHDUFLAG | Total packets | Discarded packets |
| A | 0 | 11343 | 3 |
| B | 0 | 16672 | 2 |
| C | 0 | 16126 | 2 |
| D | 0 | 19326 | 2 |
| Mode M9 | |||
|---|---|---|---|
| Quadrant | BADHDUFLAG | Total packets | Discarded packets |
| A | 0 | 22 | 0 |
| B | 0 | 22 | 0 |
| C | 0 | 22 | 0 |
| D | 0 | 23 | 0 |
| Mode SS | |||
|---|---|---|---|
| Quadrant | BADHDUFLAG | Total packets | Discarded packets |
| A | 0 | 104 | 0 |
| B | 0 | 104 | 0 |
| C | 0 | 104 | 0 |
| D | 0 | 104 | 0 |
| Quadrant | Total seconds | Saturated seconds | Saturation percentage |
|---|---|---|---|
| A | 5089 | 20 | 0.393005% |
| B | 5089 | 704 | 13.833759% |
| C | 5089 | 247 | 4.853606% |
| D | 5089 | 214 | 4.205148% |
Noise dominated data is calculated using 1-second bins in cleaned event files. If a bin has >2000 counts, and if more than 50% of those come from <1% of pixels, then it is considered to be noise-dominated and hence unusable.
| Quadrant | # 1 sec bins | Bins with >0 counts | Bins with >2000 counts | High rate bins dominated by noise | Noise dominated (total time) | Noise dominated (detector-on time) | Marked lightcurve |
|---|---|---|---|---|---|---|---|
| A | 7063 | 5090 | 9 | 9 | 0.13% | 0.18% | 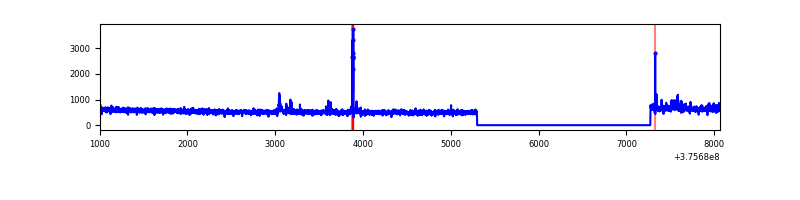 |
| B | 7063 | 5090 | 444 | 444 | 6.29% | 8.72% | 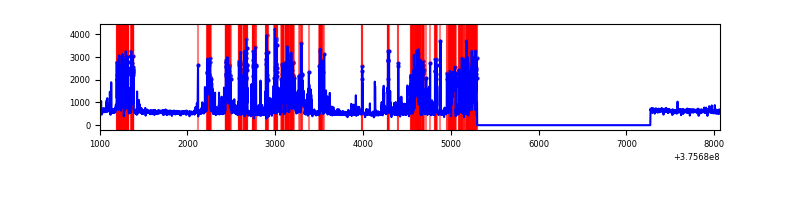 |
| C | 7063 | 5090 | 205 | 205 | 2.90% | 4.03% | 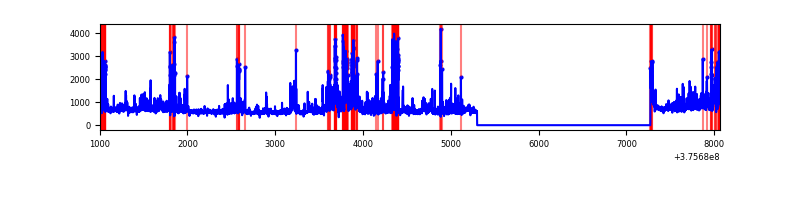 |
| D | 7063 | 5090 | 181 | 181 | 2.56% | 3.56% | 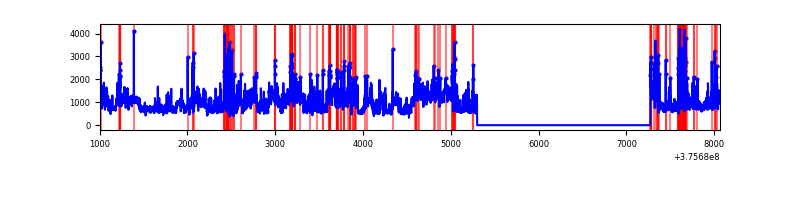 |
Top three noisy pixels from each quadrant. If the there are fewer than three noisy pixels in the level2.evt file, extra rows are filled as -1
| Pixel properties | Quadrant properties | ||||||
|---|---|---|---|---|---|---|---|
| Quadrant | DetID | PixID | Counts | Sigma | Mean | Median | Sigma |
| A | 0 | 254 | 65126 | 466.71 | 696 | 686 | 138.1 |
| A | 12 | 16 | 20826 | 145.86 | 696 | 686 | 138.1 |
| A | 12 | 194 | 8465 | 56.34 | 696 | 686 | 138.1 |
| B | 0 | 219 | 911181 | 7383.41 | 660 | 648 | 123.3 |
| B | 5 | 172 | 839860 | 6805.08 | 660 | 648 | 123.3 |
| B | 4 | 170 | 52130 | 417.46 | 660 | 648 | 123.3 |
| C | 1 | 23 | 538009 | 3631.78 | 654 | 664 | 148.0 |
| C | 10 | 49 | 458997 | 3097.76 | 654 | 664 | 148.0 |
| C | 15 | 214 | 238713 | 1608.91 | 654 | 664 | 148.0 |
| D | 8 | 195 | 1566316 | 9649.59 | 664 | 645 | 162.3 |
| D | 1 | 52 | 340090 | 2092.08 | 664 | 645 | 162.3 |
| D | 12 | 218 | 249438 | 1533.37 | 664 | 645 | 162.3 |
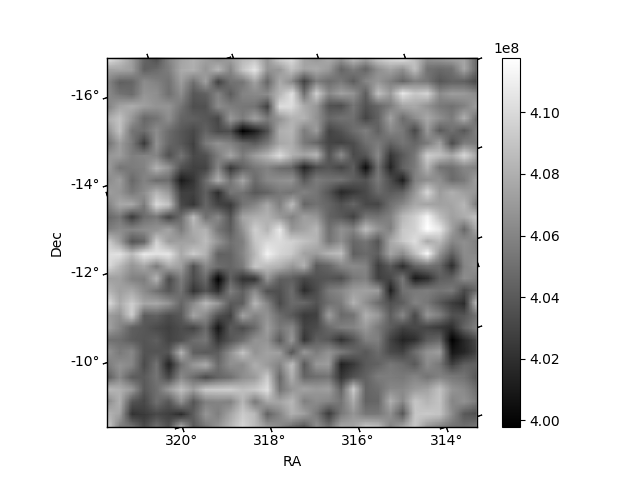
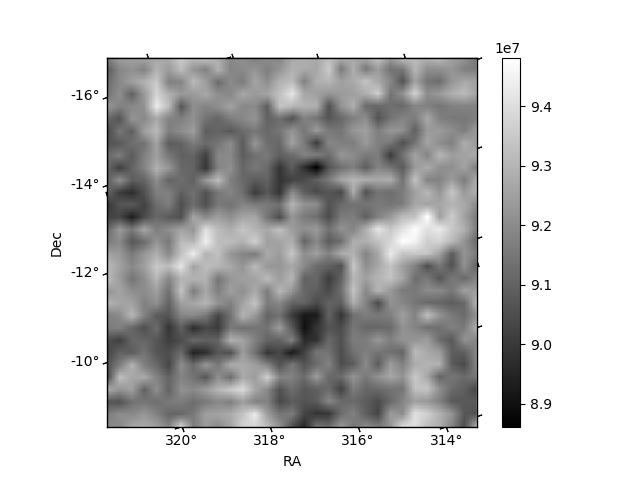
Histogram calculated using DETX and DETY for each event in the final _common_clean file
| Quadrant A | 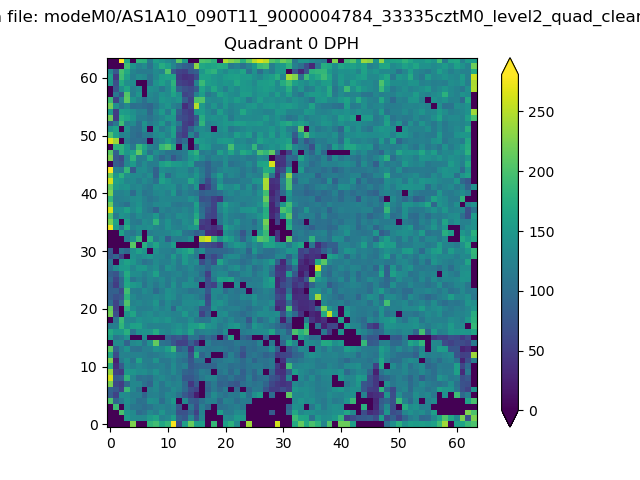 |
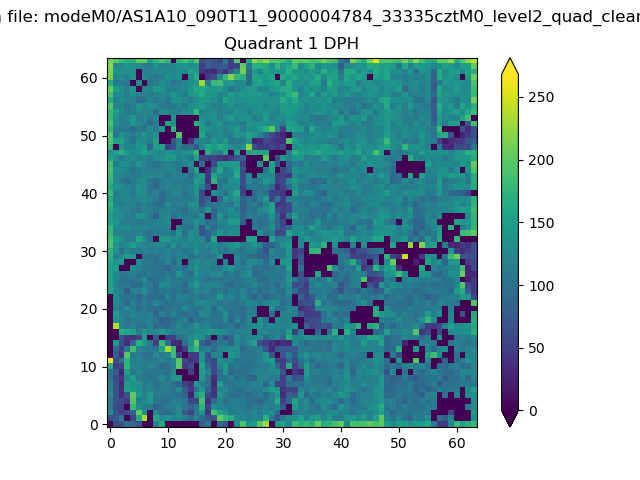 |
Quadrant B |
|---|---|---|---|
| Quadrant D | 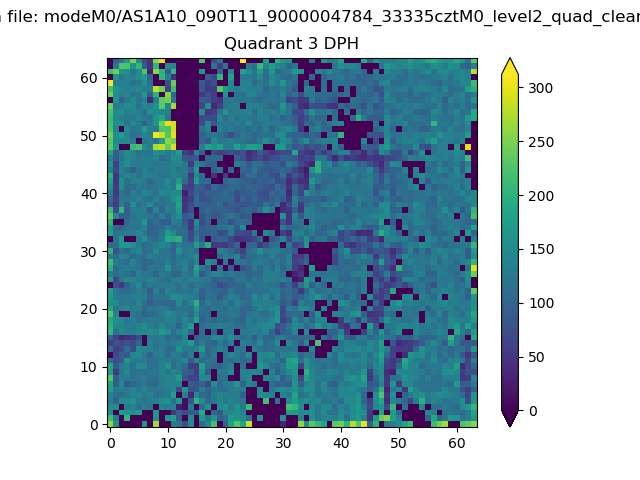 |
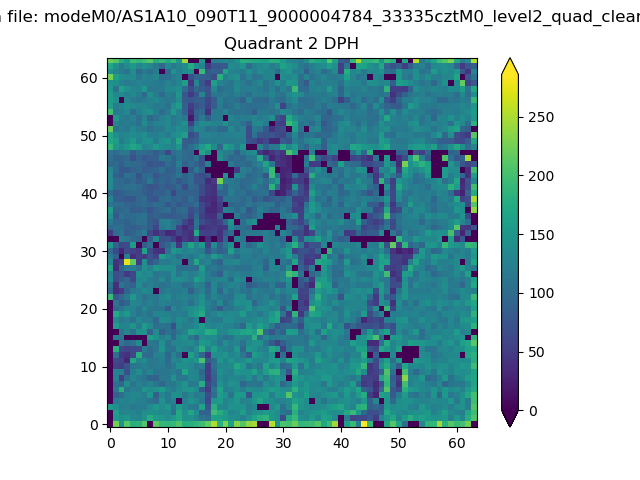 |
Quadrant C |
| Plot type | Count rate plots | Images |
|---|---|---|
| Comparison with Poisson distribution Blue bars denote a histogram of data divided into 1 sec bins. Red curve is a Poisson curve with rate = median count rate of data. |
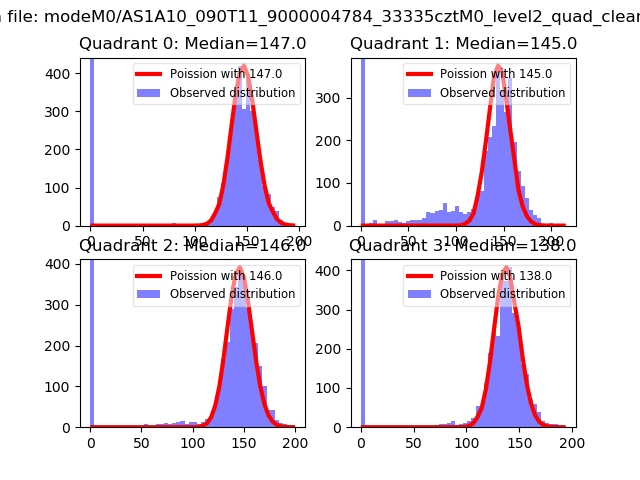 |
 |
| Quadrant-wise count rates Data is divided into 100 sec bins |
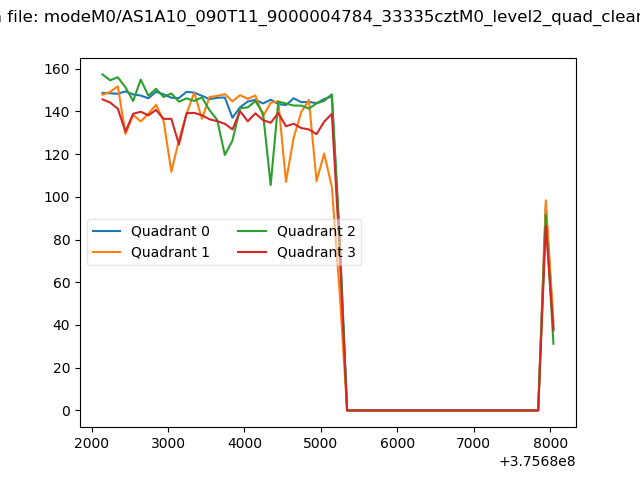 |
|
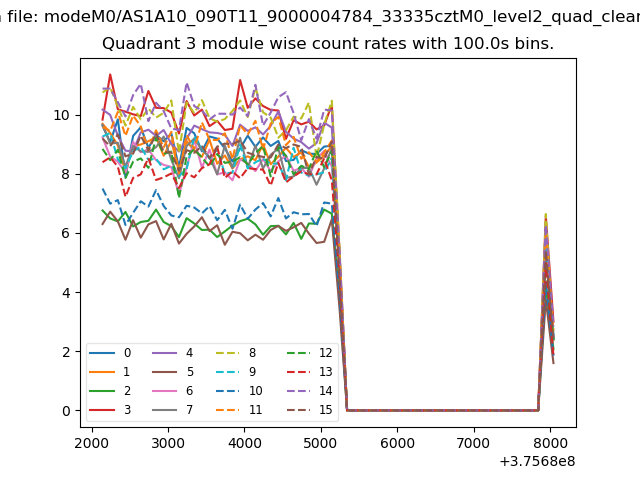
| Module-wise count rates for Quadrant A Data is divided into 100 sec bins |
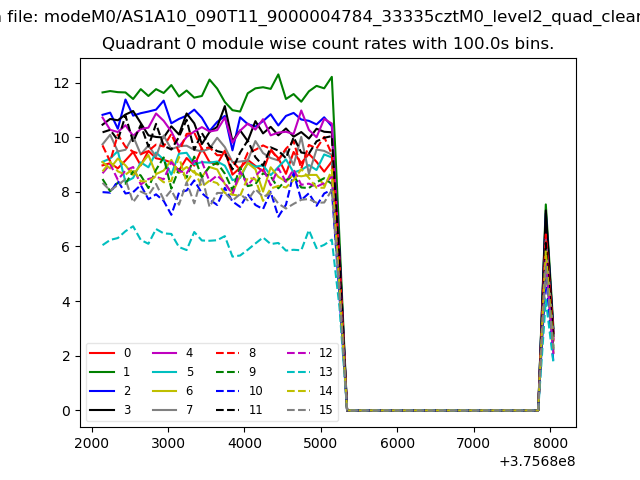 |
 |
| Module-wise count rates for Quadrant B Data is divided into 100 sec bins |
 |
 |
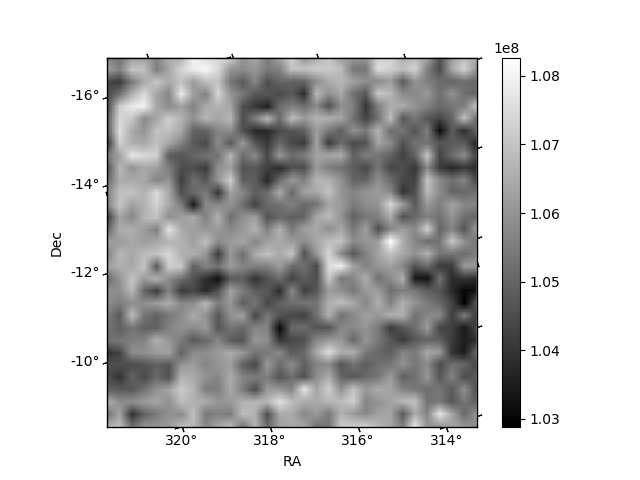
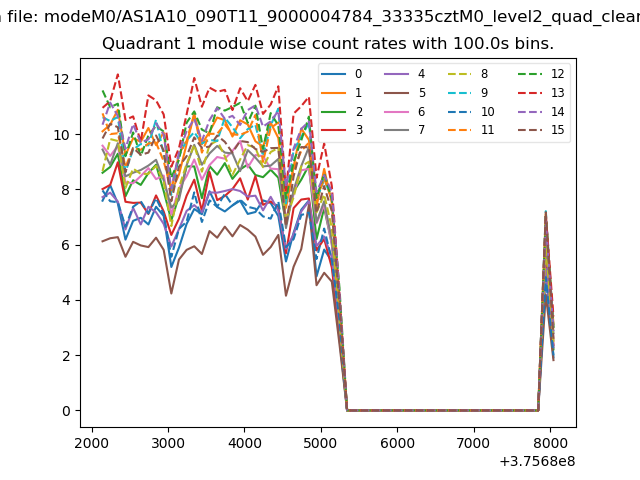
| Module-wise count rates for Quadrant C Data is divided into 100 sec bins |
 |
 |
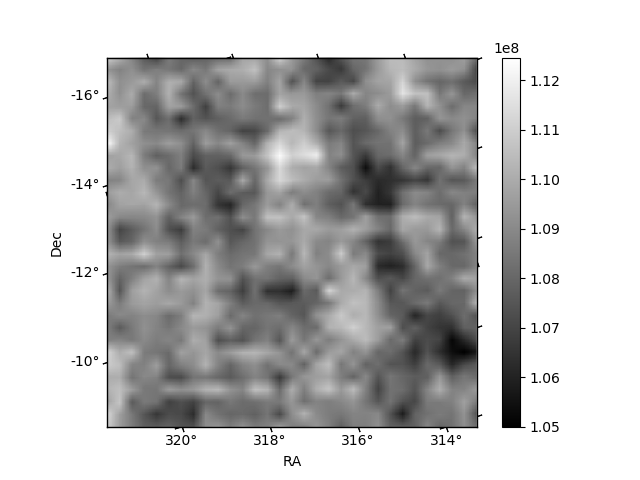
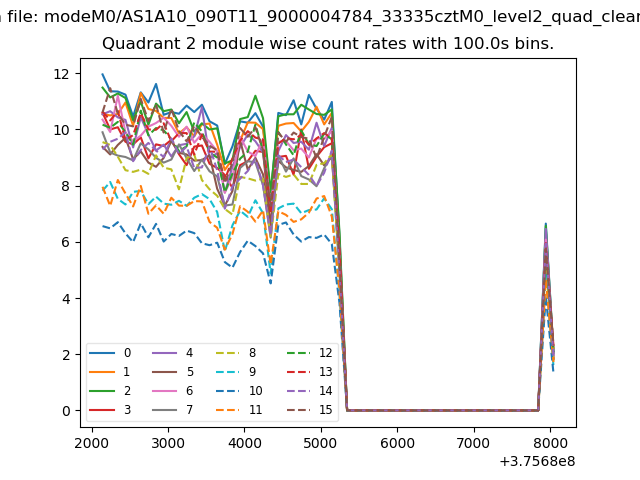
| Module-wise count rates for Quadrant D Data is divided into 100 sec bins |
 |
 |
| Parameter | Plot |
|---|---|
| CZT HV Monitor | 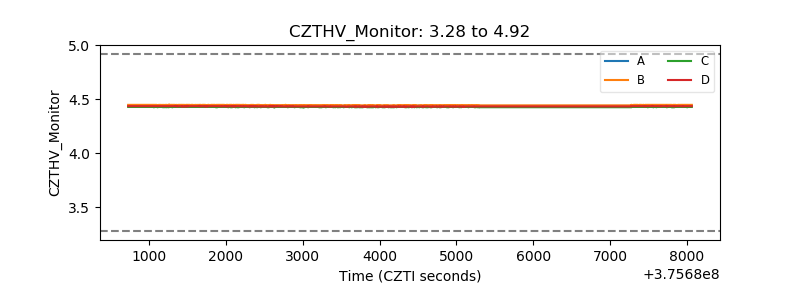 |
| D_VDD | 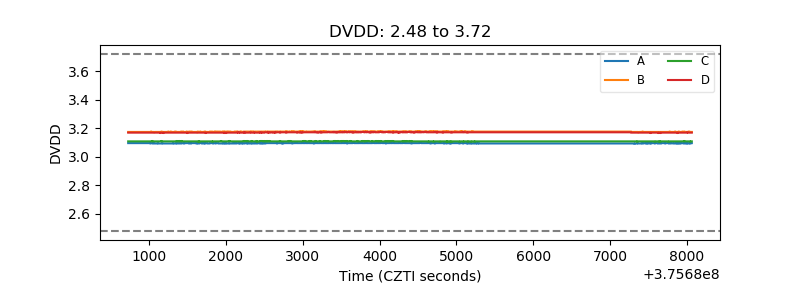 |
| Temperature 1 | 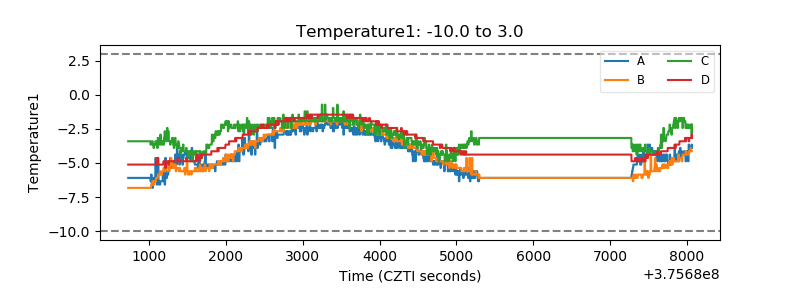 |
| Veto HV Monitor |  |
| Veto LLD | 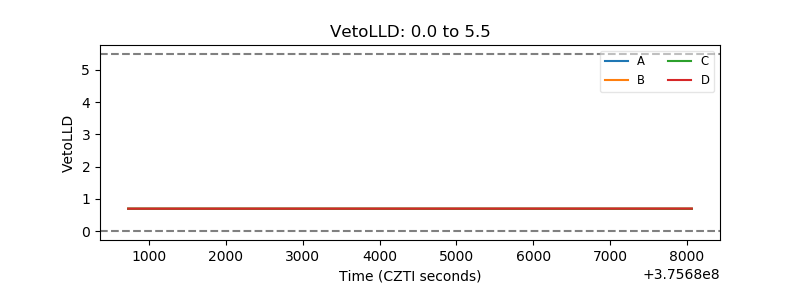 |
| Alpha Counter | 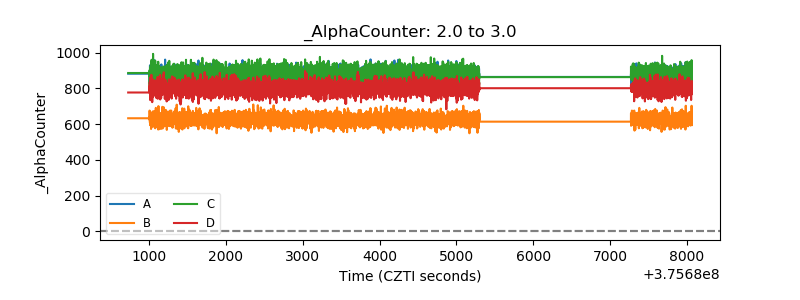 |
| _CPM_Rate | 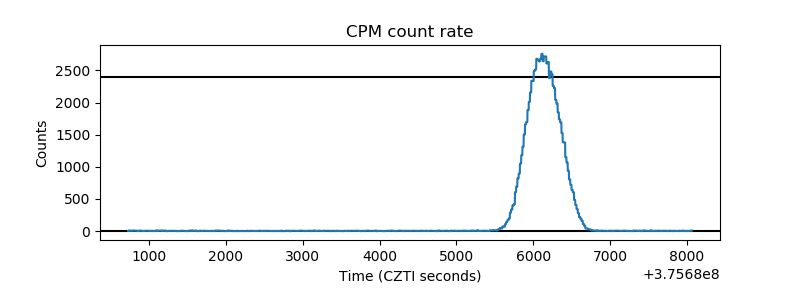 |
| CZT Counter | 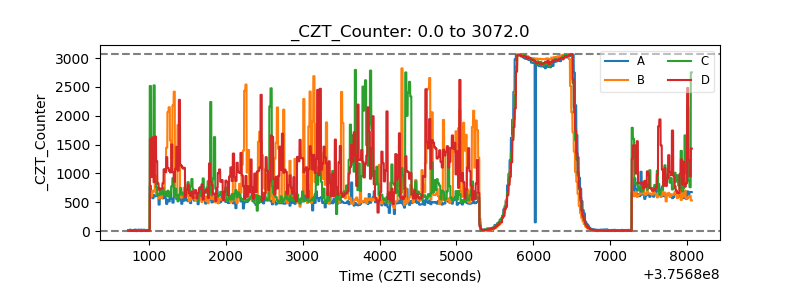 |
| +2.5 Volts monitor |  |
| +5 Volts monitor |  |
| _ROLL_ROT | 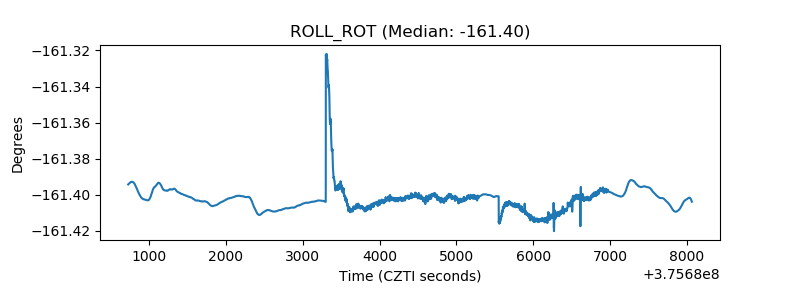 |
| _Roll_DEC | 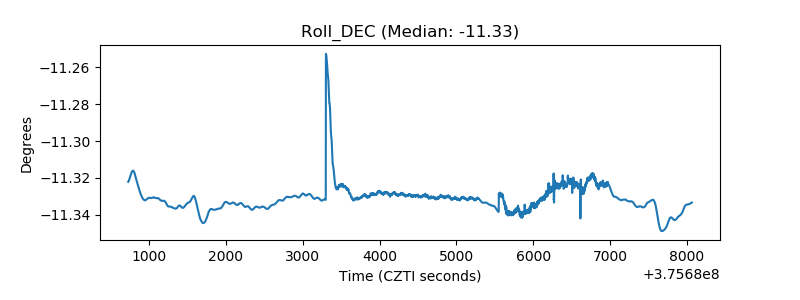 |
| _Roll_RA | 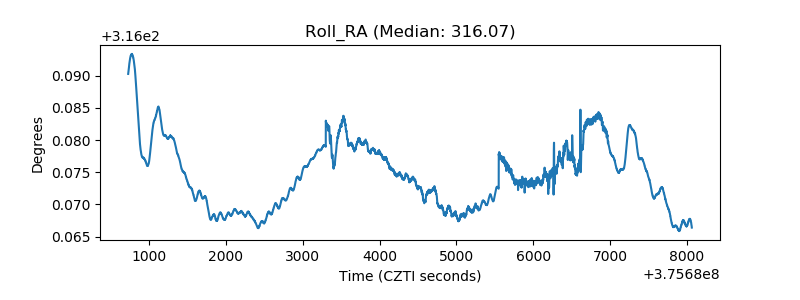 |
| Veto Counter | 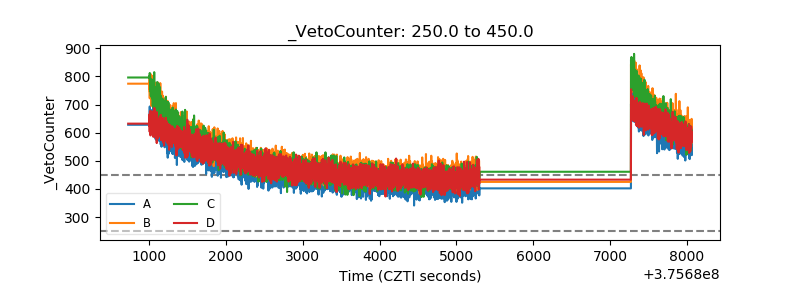 |