| Param | Original file | Final file |
|---|---|---|
| Filename | modeM0/AS1A10_090T11_9000004784_33336cztM0_level2.evt | modeM0/AS1A10_090T11_9000004784_33336cztM0_level2_quad_clean.evt |
| Size (bytes) | 690,523,200 | 89,254,080 |
| Size | 658.5 MB | 85.1 MB |
| Events in quadrant A | 2,850,474 | 630,601 |
| Events in quadrant B | 4,408,665 | 601,923 |
| Events in quadrant C | 6,606,129 | 556,761 |
| Events in quadrant D | 6,711,169 | 562,285 |
| Mode M0 | |||
|---|---|---|---|
| Quadrant | BADHDUFLAG | Total packets | Discarded packets |
| A | 0 | 11738 | 3 |
| B | 0 | 16674 | 2 |
| C | 0 | 23266 | 2 |
| D | 0 | 23488 | 2 |
| Mode M9 | |||
|---|---|---|---|
| Quadrant | BADHDUFLAG | Total packets | Discarded packets |
| A | 0 | 30 | 0 |
| B | 0 | 30 | 0 |
| C | 0 | 30 | 0 |
| D | 0 | 31 | 0 |
| Mode SS | |||
|---|---|---|---|
| Quadrant | BADHDUFLAG | Total packets | Discarded packets |
| A | 0 | 102 | 0 |
| B | 0 | 102 | 0 |
| C | 0 | 102 | 0 |
| D | 0 | 102 | 0 |
| Quadrant | Total seconds | Saturated seconds | Saturation percentage |
|---|---|---|---|
| A | 4999 | 18 | 0.360072% |
| B | 4999 | 562 | 11.242248% |
| C | 4999 | 967 | 19.343869% |
| D | 4999 | 659 | 13.182637% |
Noise dominated data is calculated using 1-second bins in cleaned event files. If a bin has >2000 counts, and if more than 50% of those come from <1% of pixels, then it is considered to be noise-dominated and hence unusable.
| Quadrant | # 1 sec bins | Bins with >0 counts | Bins with >2000 counts | High rate bins dominated by noise | Noise dominated (total time) | Noise dominated (detector-on time) | Marked lightcurve |
|---|---|---|---|---|---|---|---|
| A | 7091 | 5000 | 1 | 1 | 0.01% | 0.02% | 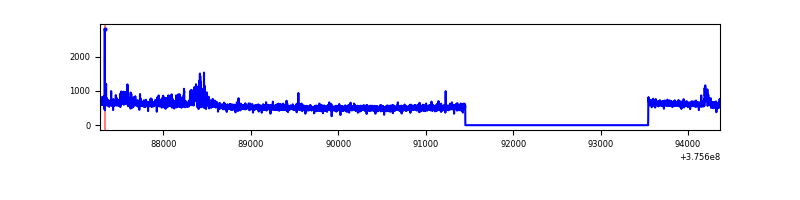 |
| B | 7091 | 5000 | 322 | 322 | 4.54% | 6.44% | 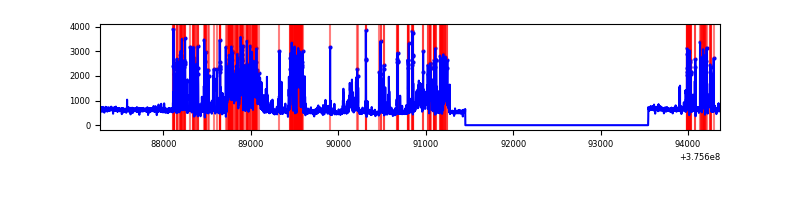 |
| C | 7091 | 5000 | 885 | 885 | 12.48% | 17.70% | 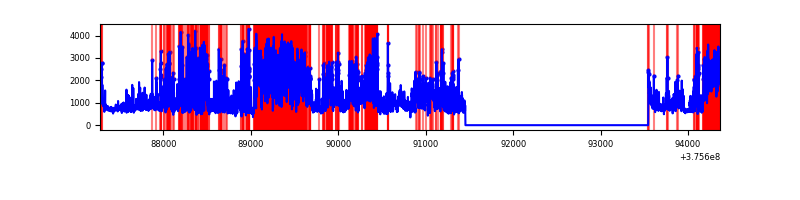 |
| D | 7091 | 5000 | 770 | 770 | 10.86% | 15.40% | 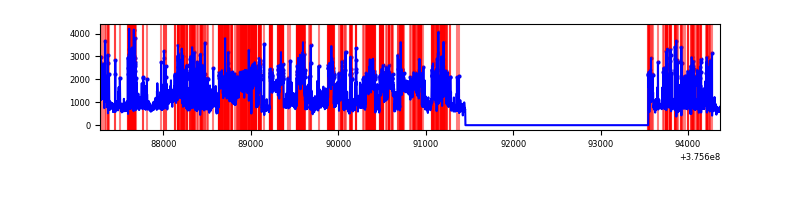 |
Top three noisy pixels from each quadrant. If the there are fewer than three noisy pixels in the level2.evt file, extra rows are filled as -1
| Pixel properties | Quadrant properties | ||||||
|---|---|---|---|---|---|---|---|
| Quadrant | DetID | PixID | Counts | Sigma | Mean | Median | Sigma |
| A | 0 | 254 | 124390 | 889.11 | 703 | 693 | 139.1 |
| A | 13 | 6 | 9626 | 64.21 | 703 | 693 | 139.1 |
| A | 13 | 254 | 8303 | 54.7 | 703 | 693 | 139.1 |
| B | 0 | 219 | 858290 | 6870.03 | 670 | 657 | 124.8 |
| B | 5 | 172 | 799581 | 6399.74 | 670 | 657 | 124.8 |
| B | 4 | 170 | 51461 | 406.96 | 670 | 657 | 124.8 |
| C | 1 | 23 | 2619938 | 18474.31 | 627 | 634 | 141.8 |
| C | 10 | 49 | 1153689 | 8132.66 | 627 | 634 | 141.8 |
| C | 15 | 214 | 226094 | 1590.2 | 627 | 634 | 141.8 |
| D | 8 | 195 | 2208700 | 13577.01 | 659 | 643 | 162.6 |
| D | 12 | 218 | 526102 | 3230.97 | 659 | 643 | 162.6 |
| D | 1 | 52 | 473868 | 2909.79 | 659 | 643 | 162.6 |
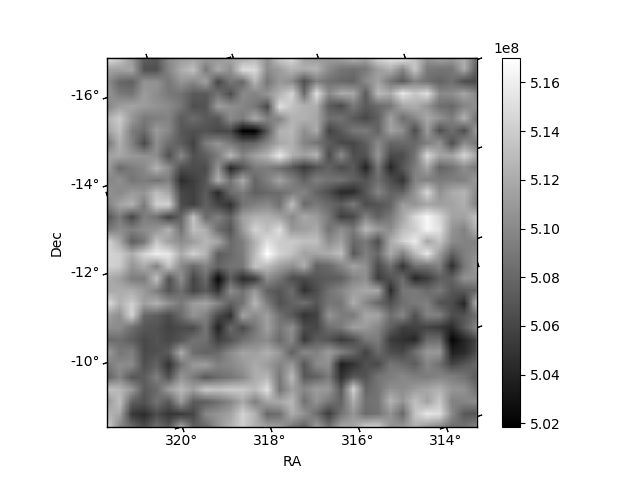
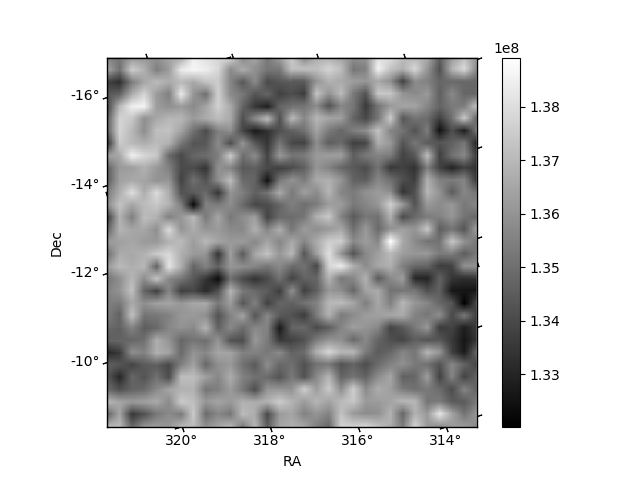
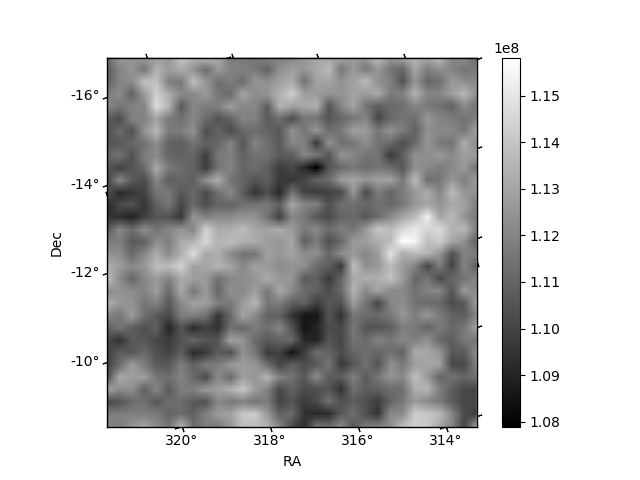
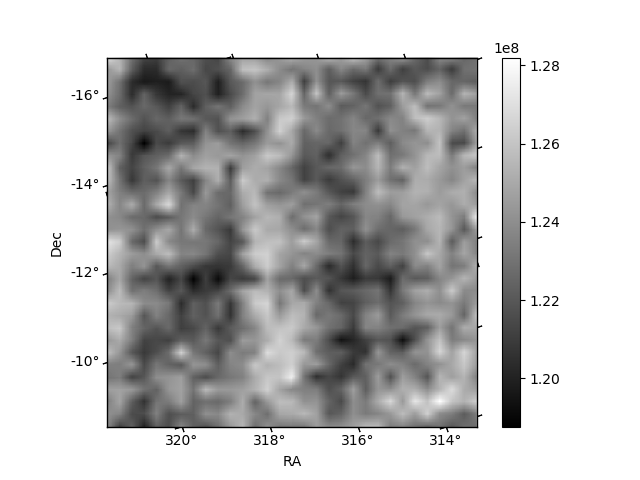
Histogram calculated using DETX and DETY for each event in the final _common_clean file
| Quadrant A | 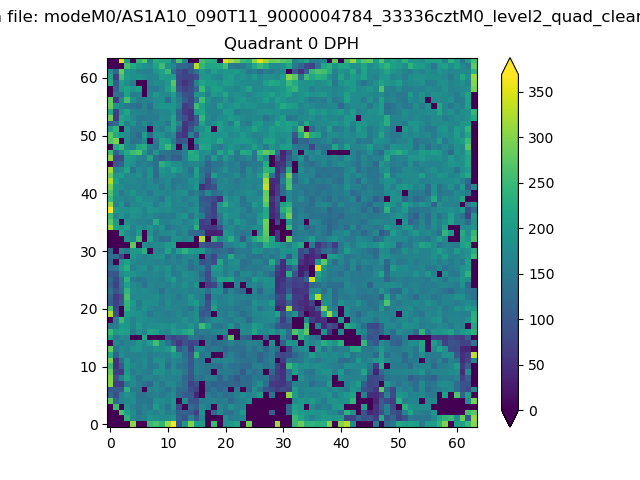 |
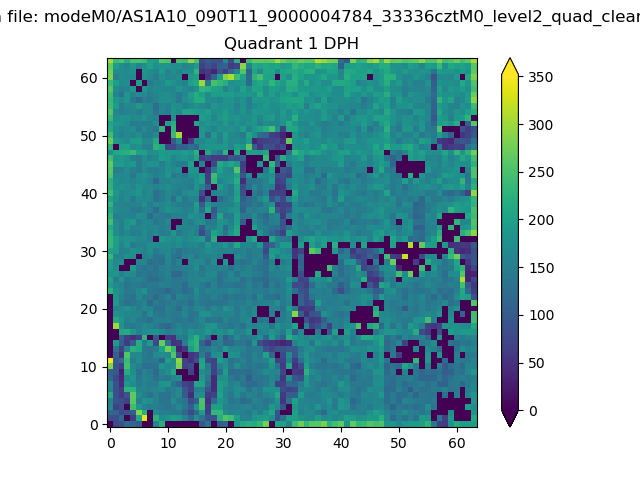 |
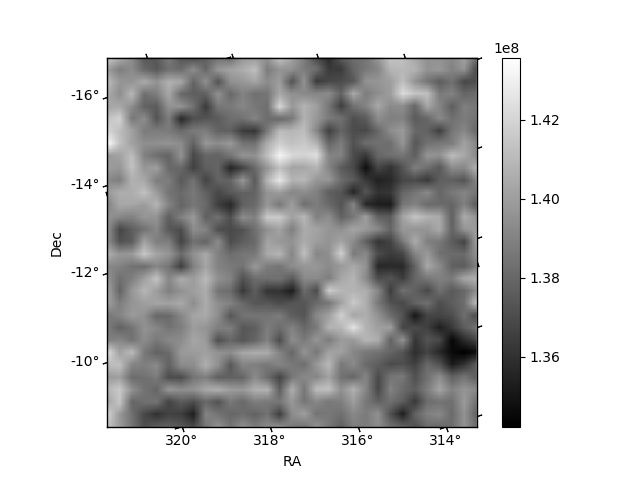
Quadrant B |
|---|---|---|---|
| Quadrant D | 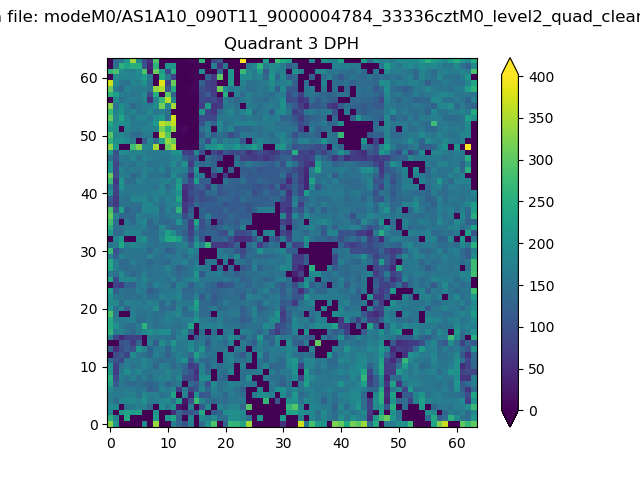 |
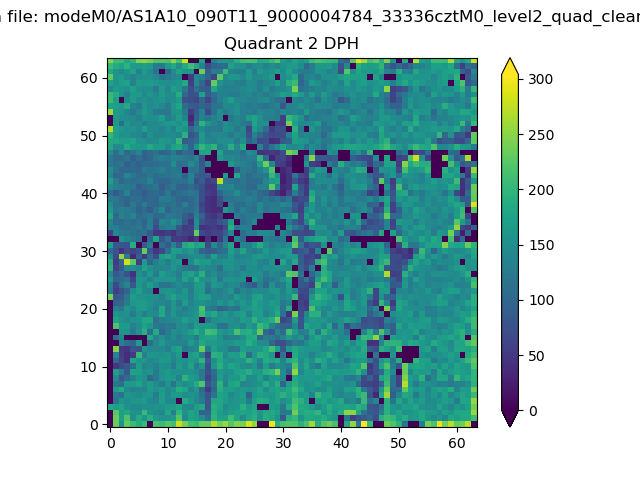 |
Quadrant C |
| Plot type | Count rate plots | Images |
|---|---|---|
| Comparison with Poisson distribution Blue bars denote a histogram of data divided into 1 sec bins. Red curve is a Poisson curve with rate = median count rate of data. |
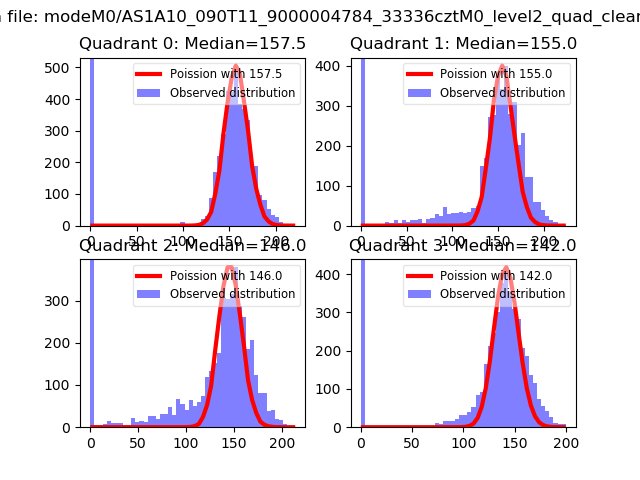 |
 |
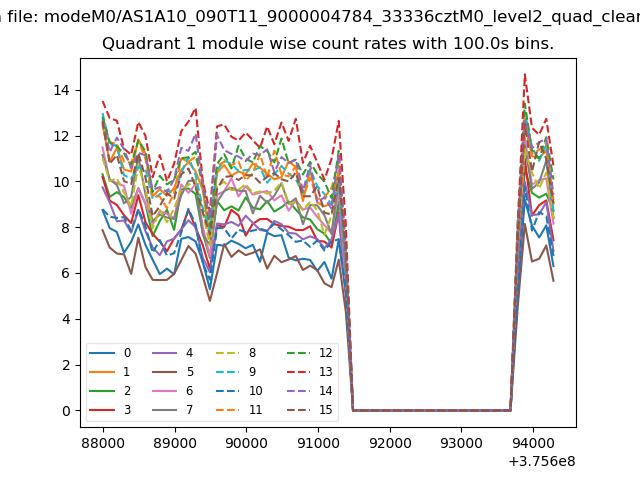
| Quadrant-wise count rates Data is divided into 100 sec bins |
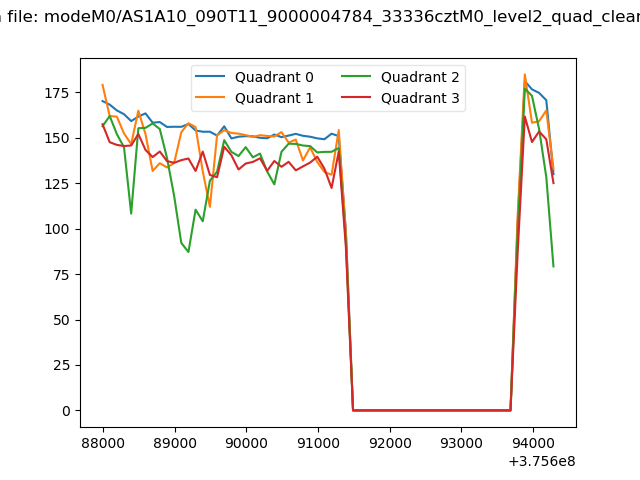 |
|
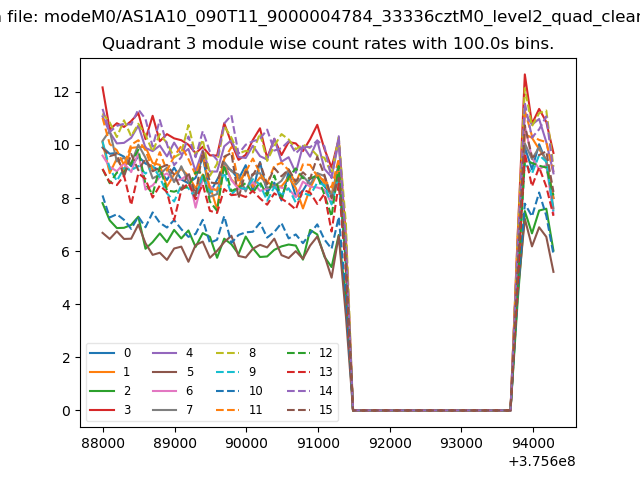
| Module-wise count rates for Quadrant A Data is divided into 100 sec bins |
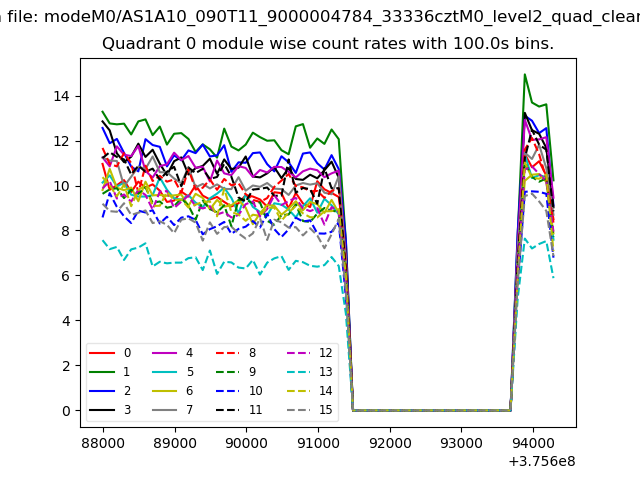 |
 |
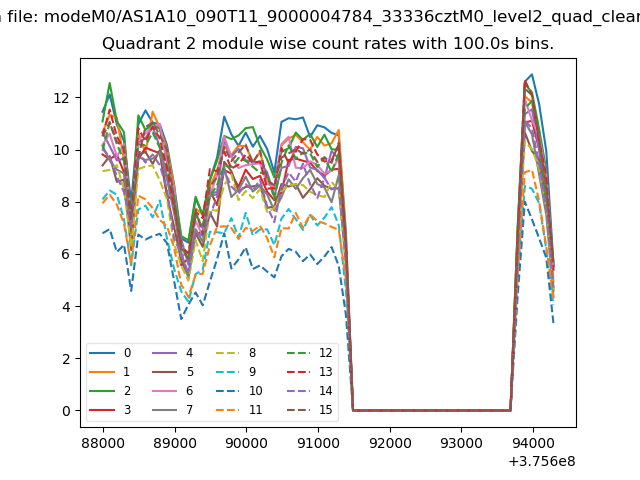
| Module-wise count rates for Quadrant B Data is divided into 100 sec bins |
 |
 |
| Module-wise count rates for Quadrant C Data is divided into 100 sec bins |
 |
 |
| Module-wise count rates for Quadrant D Data is divided into 100 sec bins |
 |
 |
| Parameter | Plot |
|---|---|
| CZT HV Monitor | 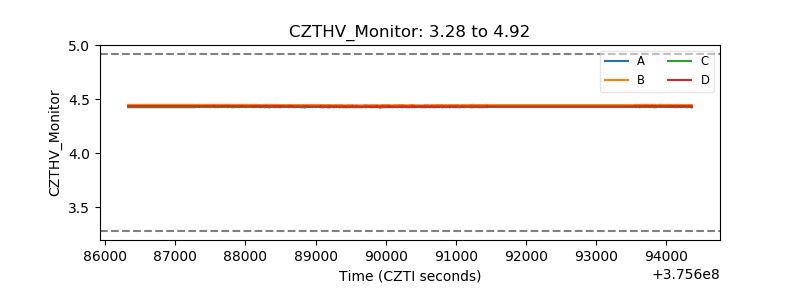 |
| D_VDD | 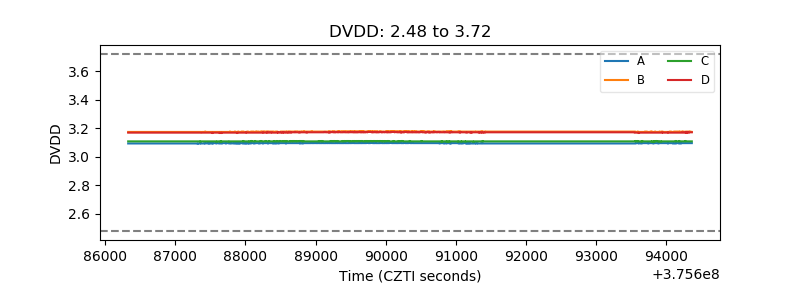 |
| Temperature 1 | 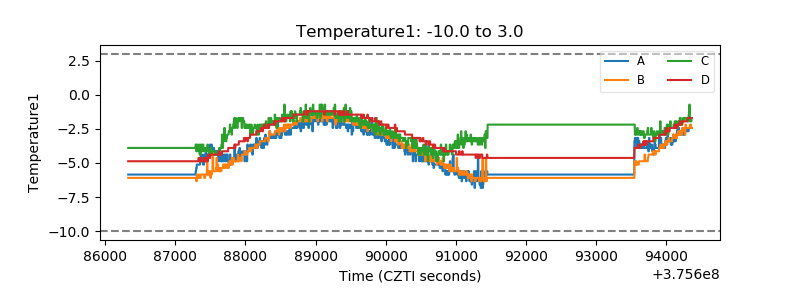 |
| Veto HV Monitor |  |
| Veto LLD | 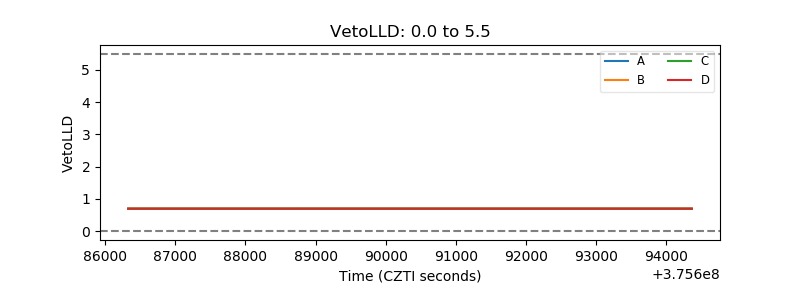 |
| Alpha Counter | 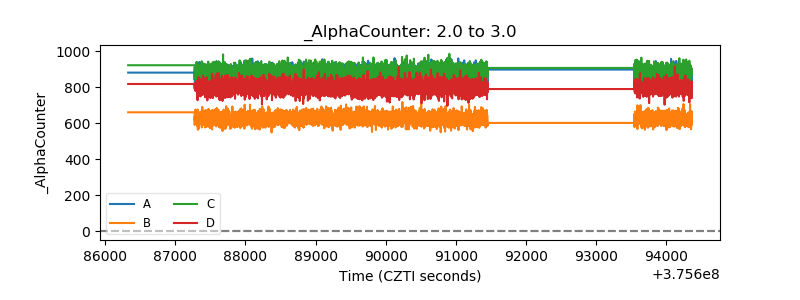 |
| _CPM_Rate | 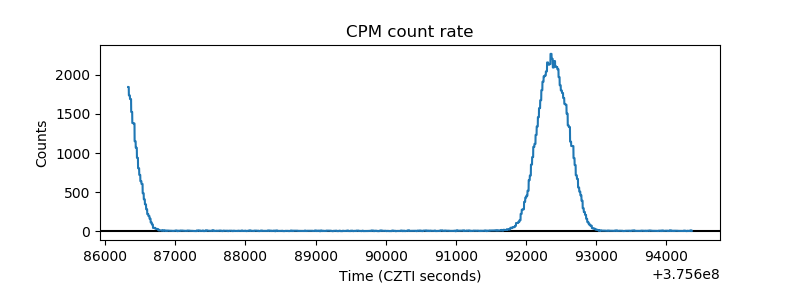 |
| CZT Counter | 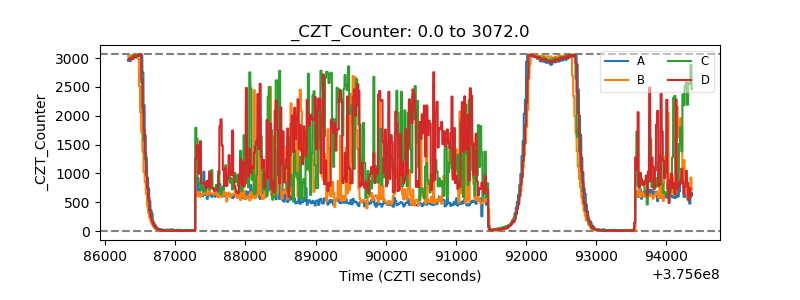 |
| +2.5 Volts monitor |  |
| +5 Volts monitor | 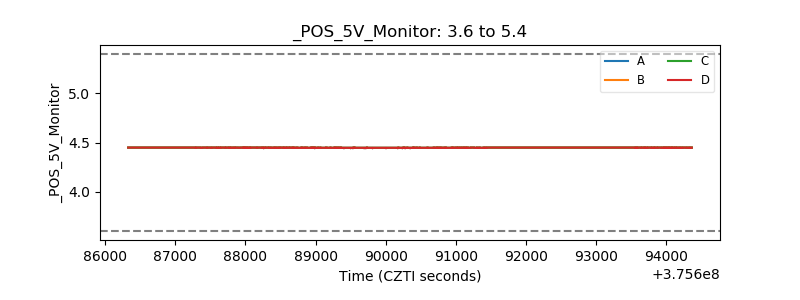 |
| _ROLL_ROT | 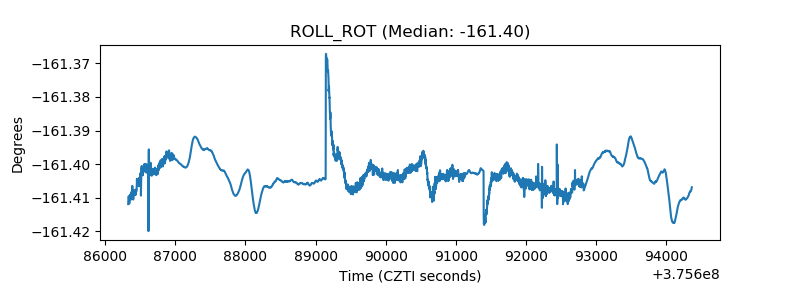 |
| _Roll_DEC | 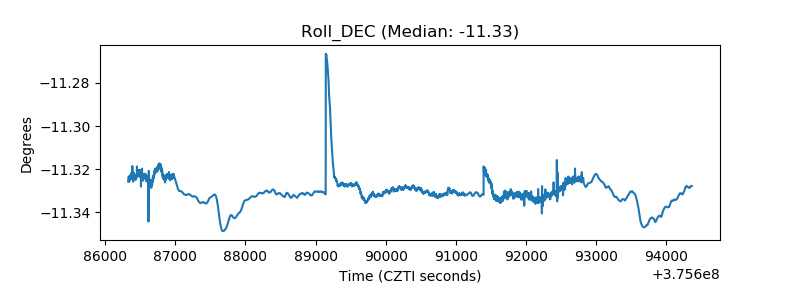 |
| _Roll_RA | 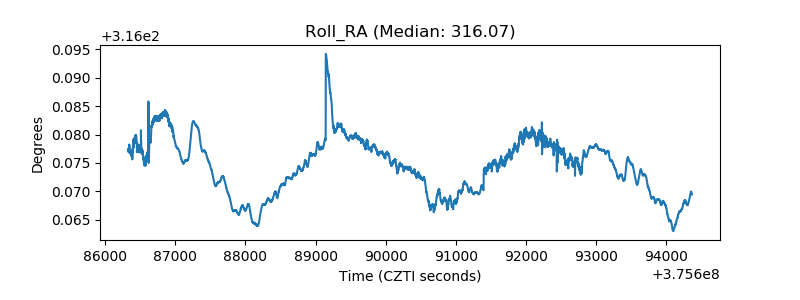 |
| Veto Counter | 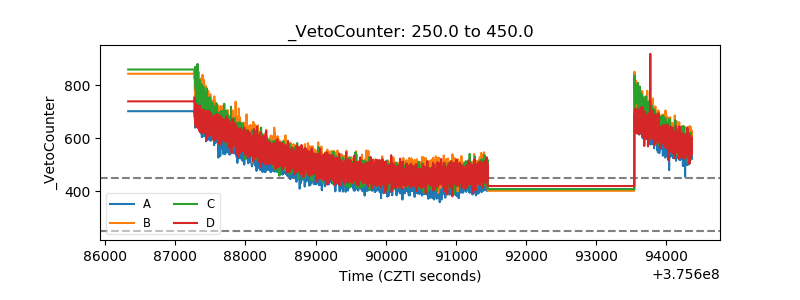 |