| Param | Original file | Final file |
|---|---|---|
| Filename | modeM0/AS1A10_090T11_9000004784_33337cztM0_level2.evt | modeM0/AS1A10_090T11_9000004784_33337cztM0_level2_quad_clean.evt |
| Size (bytes) | 616,014,720 | 97,577,280 |
| Size | 587.5 MB | 93.1 MB |
| Events in quadrant A | 2,742,697 | 697,567 |
| Events in quadrant B | 4,533,748 | 666,443 |
| Events in quadrant C | 4,062,800 | 665,244 |
| Events in quadrant D | 6,981,326 | 576,662 |
| Mode M0 | |||
|---|---|---|---|
| Quadrant | BADHDUFLAG | Total packets | Discarded packets |
| A | 0 | 11180 | 3 |
| B | 0 | 16990 | 2 |
| C | 0 | 15248 | 2 |
| D | 0 | 24317 | 2 |
| Mode M9 | |||
|---|---|---|---|
| Quadrant | BADHDUFLAG | Total packets | Discarded packets |
| A | 0 | 28 | 0 |
| B | 0 | 28 | 0 |
| C | 0 | 28 | 0 |
| D | 0 | 29 | 0 |
| Mode SS | |||
|---|---|---|---|
| Quadrant | BADHDUFLAG | Total packets | Discarded packets |
| A | 0 | 102 | 0 |
| B | 0 | 102 | 0 |
| C | 0 | 102 | 0 |
| D | 0 | 102 | 0 |
| Quadrant | Total seconds | Saturated seconds | Saturation percentage |
|---|---|---|---|
| A | 4967 | 29 | 0.583853% |
| B | 4967 | 555 | 11.173747% |
| C | 4967 | 349 | 7.026374% |
| D | 4967 | 1066 | 21.461647% |
Noise dominated data is calculated using 1-second bins in cleaned event files. If a bin has >2000 counts, and if more than 50% of those come from <1% of pixels, then it is considered to be noise-dominated and hence unusable.
| Quadrant | # 1 sec bins | Bins with >0 counts | Bins with >2000 counts | High rate bins dominated by noise | Noise dominated (total time) | Noise dominated (detector-on time) | Marked lightcurve |
|---|---|---|---|---|---|---|---|
| A | 7090 | 4968 | 22 | 22 | 0.31% | 0.44% | 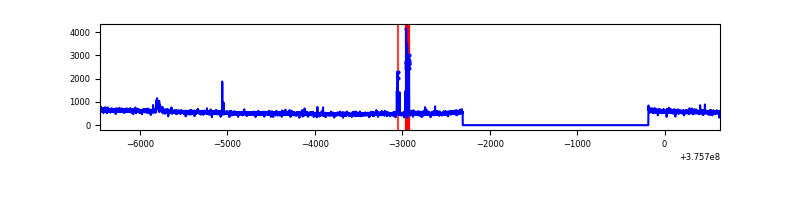 |
| B | 7090 | 4968 | 326 | 326 | 4.60% | 6.56% | 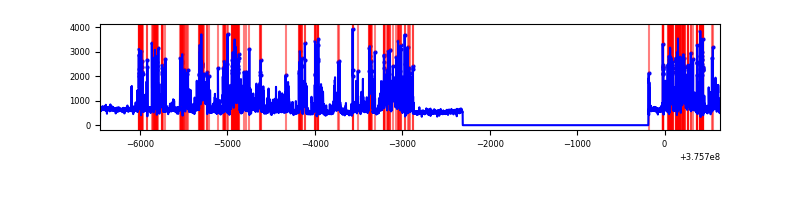 |
| C | 7090 | 4968 | 313 | 313 | 4.41% | 6.30% | 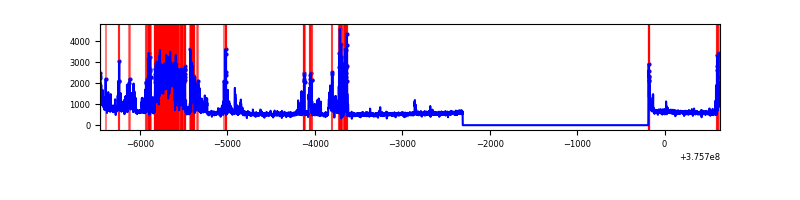 |
| D | 7090 | 4968 | 1033 | 1033 | 14.57% | 20.79% | 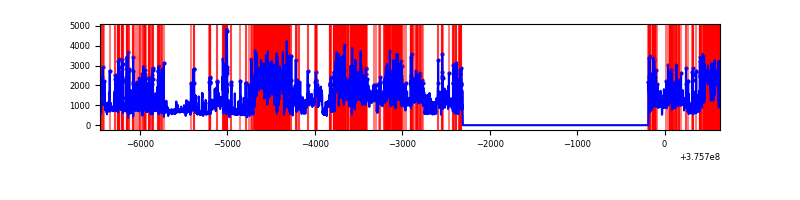 |
Top three noisy pixels from each quadrant. If the there are fewer than three noisy pixels in the level2.evt file, extra rows are filled as -1
| Pixel properties | Quadrant properties | ||||||
|---|---|---|---|---|---|---|---|
| Quadrant | DetID | PixID | Counts | Sigma | Mean | Median | Sigma |
| A | 0 | 254 | 94590 | 697.17 | 682 | 673 | 134.7 |
| A | 15 | 169 | 8568 | 58.61 | 682 | 673 | 134.7 |
| A | 13 | 254 | 7379 | 49.78 | 682 | 673 | 134.7 |
| B | 0 | 219 | 968482 | 7980.18 | 648 | 635 | 121.3 |
| B | 5 | 172 | 722017 | 5948.0 | 648 | 635 | 121.3 |
| B | 4 | 170 | 192241 | 1579.85 | 648 | 635 | 121.3 |
| C | 1 | 23 | 1217282 | 8408.02 | 633 | 640 | 144.7 |
| C | 15 | 214 | 232005 | 1598.93 | 633 | 640 | 144.7 |
| C | 0 | 10 | 105950 | 727.78 | 633 | 640 | 144.7 |
| D | 8 | 195 | 1597654 | 9910.4 | 592 | 584 | 161.2 |
| D | 2 | 250 | 1330206 | 8250.79 | 592 | 584 | 161.2 |
| D | 1 | 52 | 482717 | 2991.81 | 592 | 584 | 161.2 |
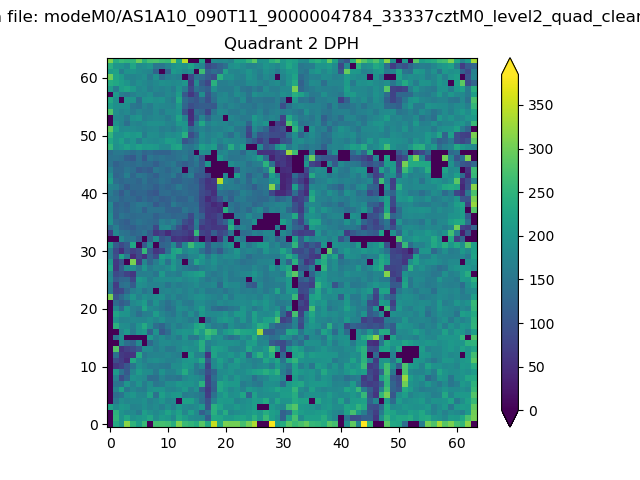
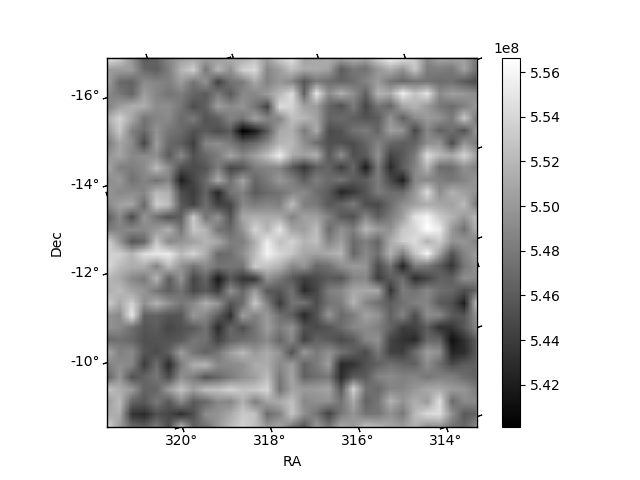
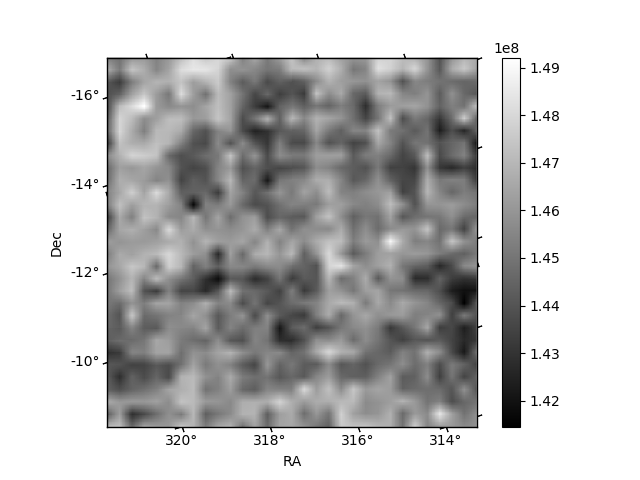
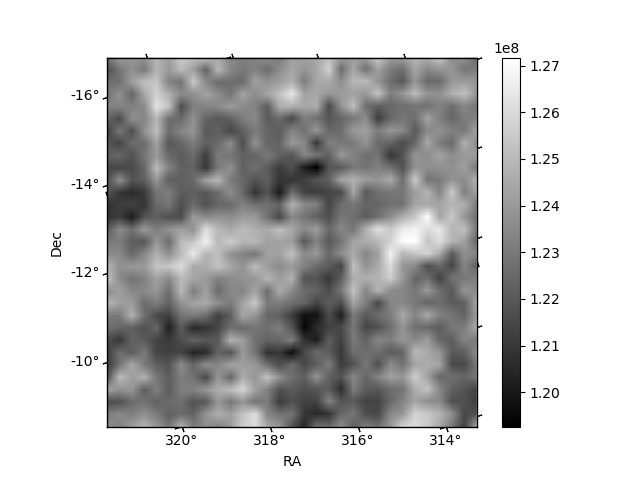
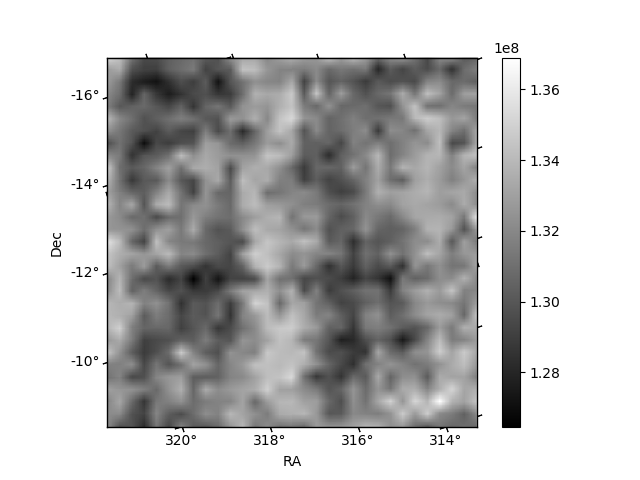
Histogram calculated using DETX and DETY for each event in the final _common_clean file
| Quadrant A | 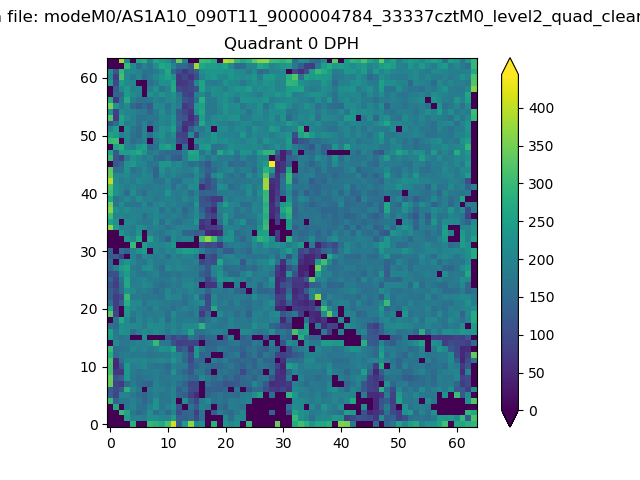 |
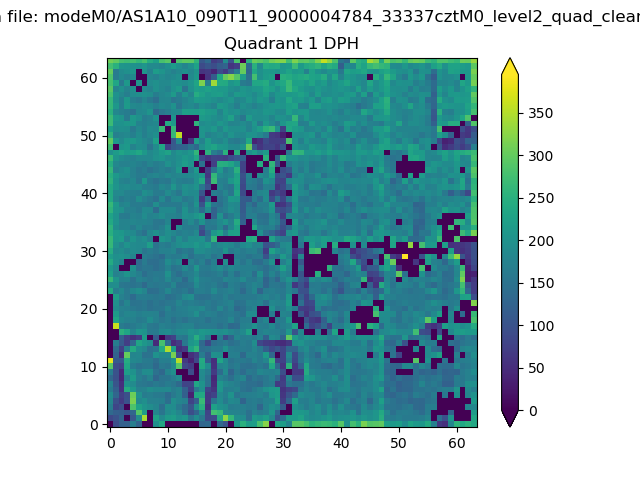 |
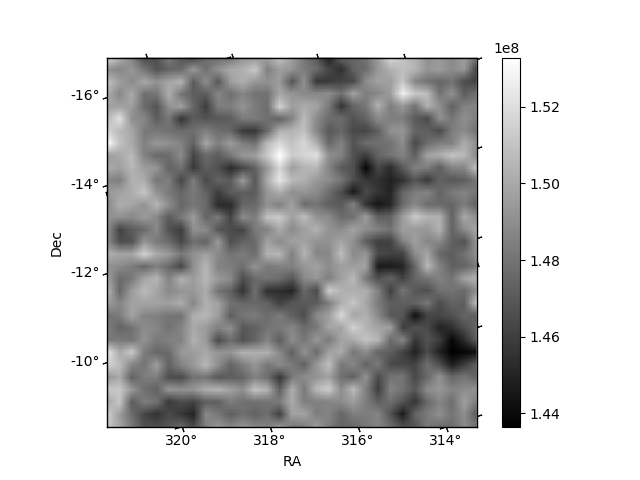
Quadrant B |
|---|---|---|---|
| Quadrant D | 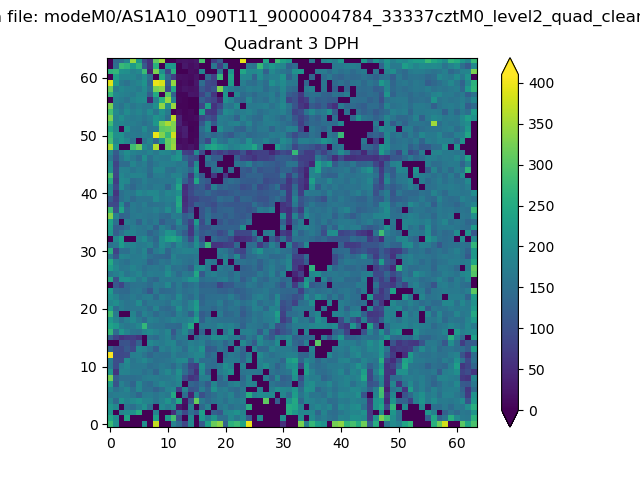 |
 |
Quadrant C |
| Plot type | Count rate plots | Images |
|---|---|---|
| Comparison with Poisson distribution Blue bars denote a histogram of data divided into 1 sec bins. Red curve is a Poisson curve with rate = median count rate of data. |
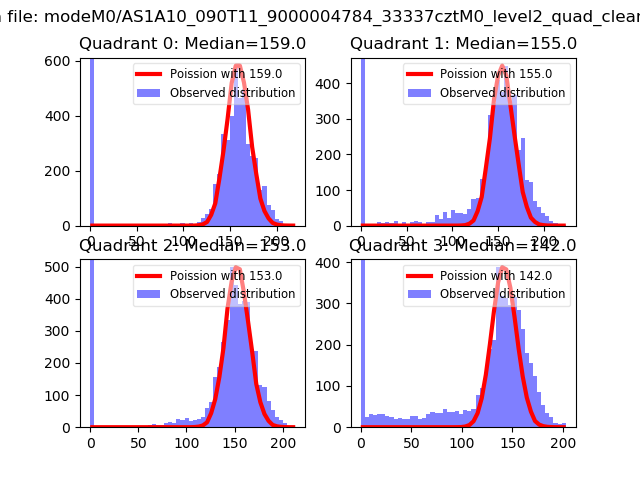 |
 |
| Quadrant-wise count rates Data is divided into 100 sec bins |
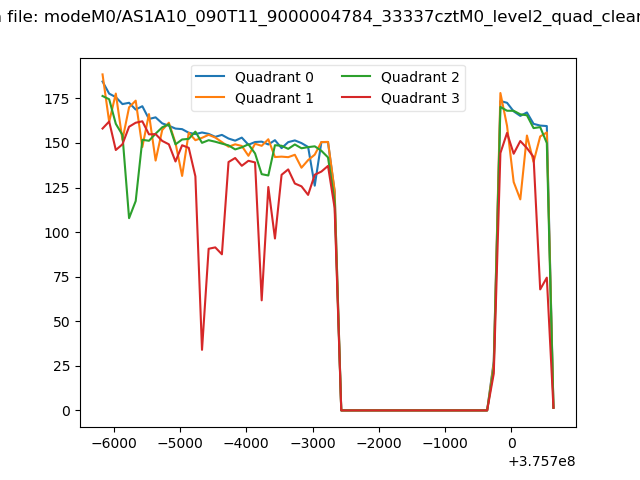 |
|
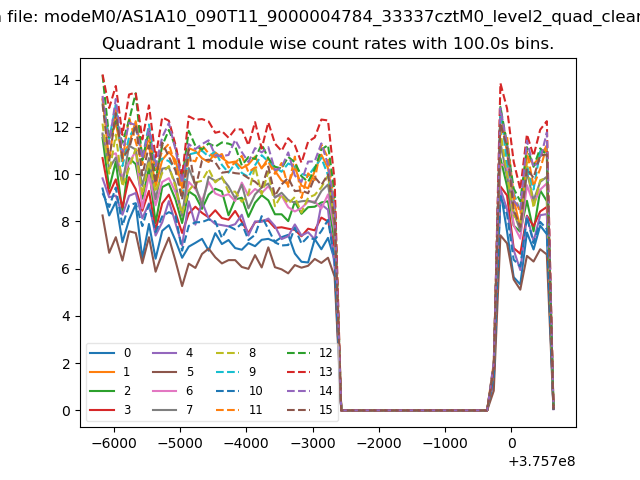
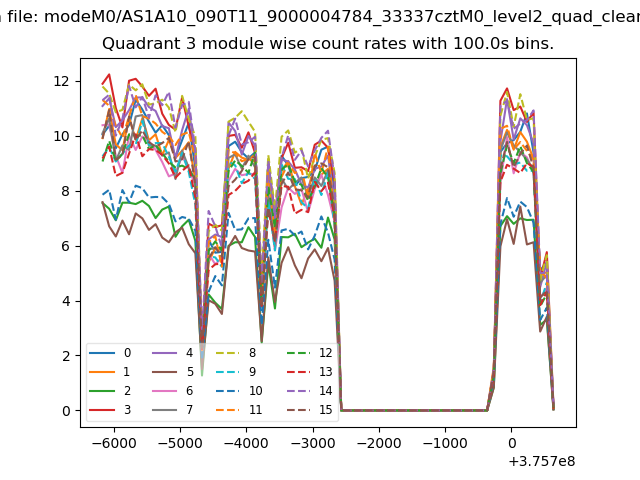
| Module-wise count rates for Quadrant A Data is divided into 100 sec bins |
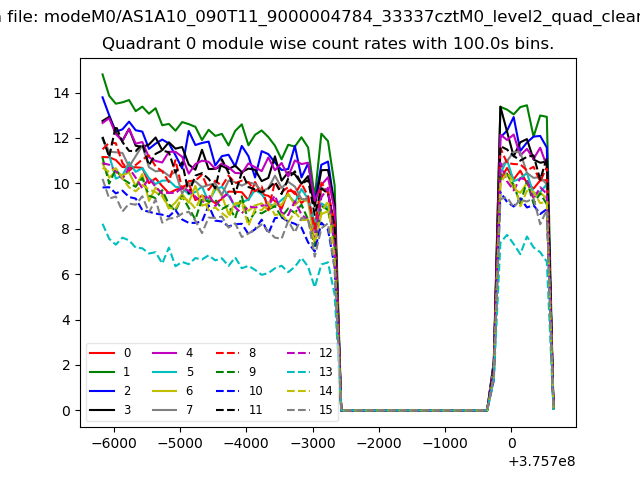 |
 |
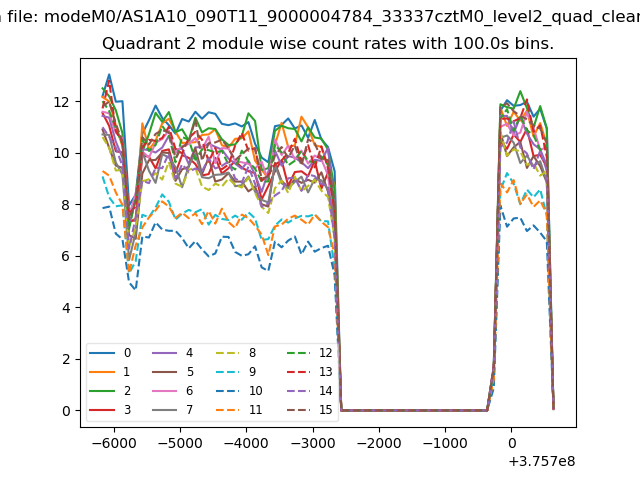
| Module-wise count rates for Quadrant B Data is divided into 100 sec bins |
 |
 |
| Module-wise count rates for Quadrant C Data is divided into 100 sec bins |
 |
 |
| Module-wise count rates for Quadrant D Data is divided into 100 sec bins |
 |
 |
| Parameter | Plot |
|---|---|
| CZT HV Monitor | 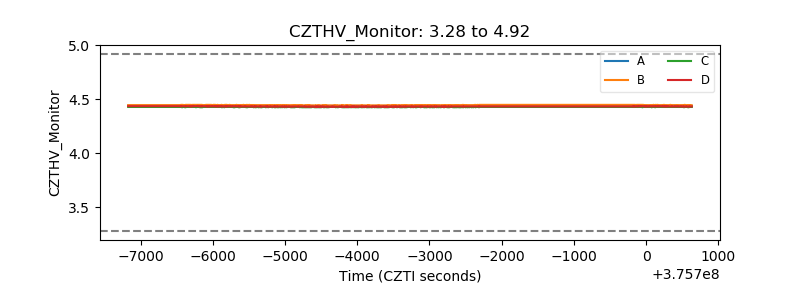 |
| D_VDD | 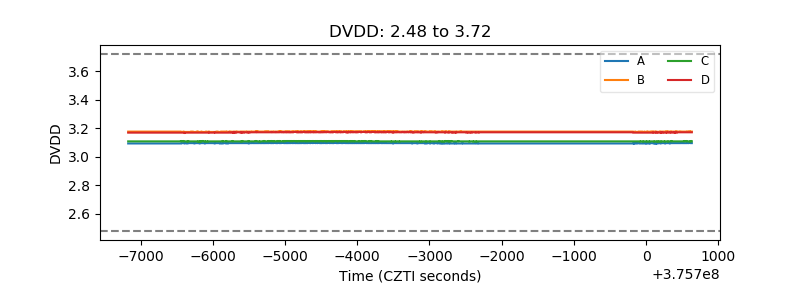 |
| Temperature 1 | 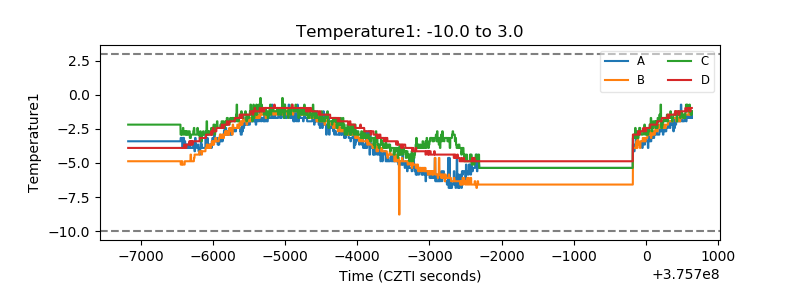 |
| Veto HV Monitor |  |
| Veto LLD | 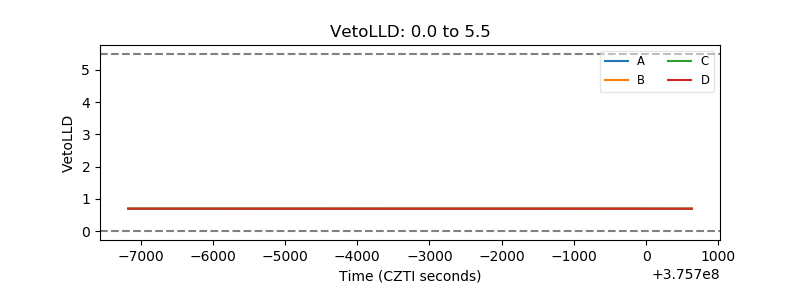 |
| Alpha Counter | 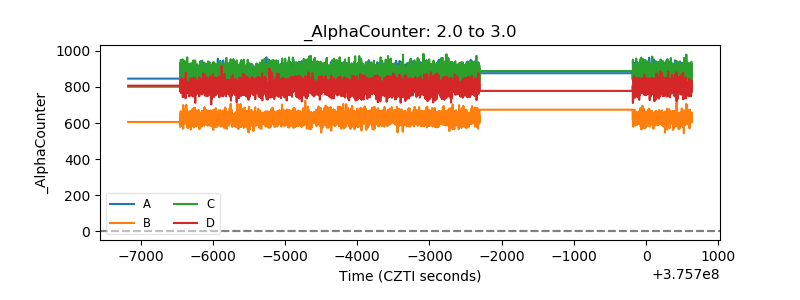 |
| _CPM_Rate | 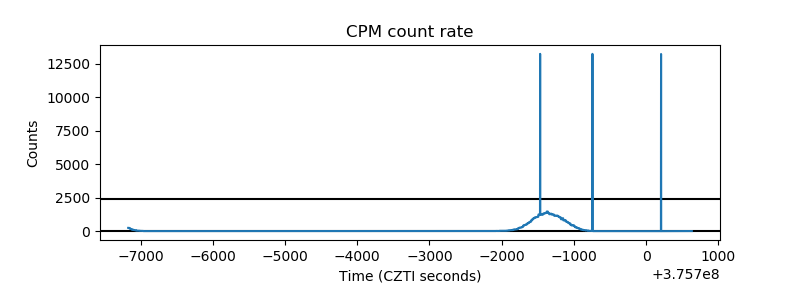 |
| CZT Counter | 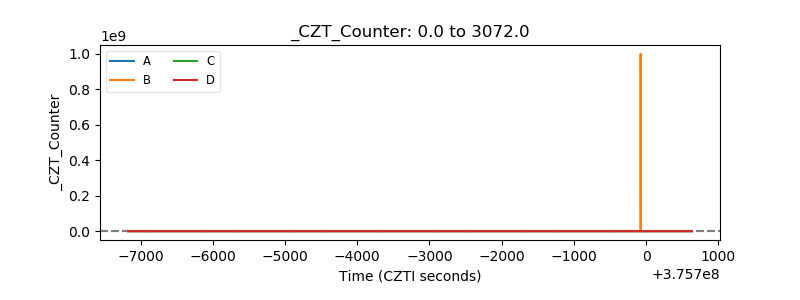 |
| +2.5 Volts monitor |  |
| +5 Volts monitor |  |
| _ROLL_ROT | 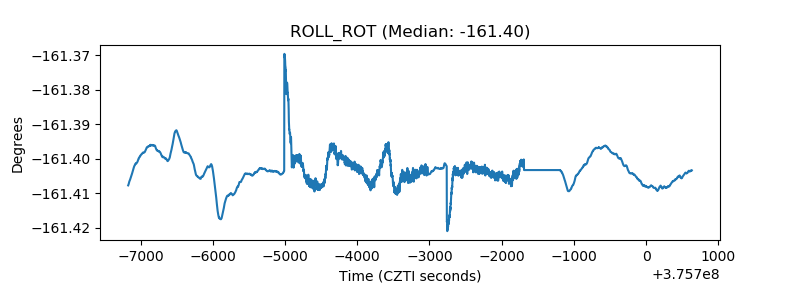 |
| _Roll_DEC | 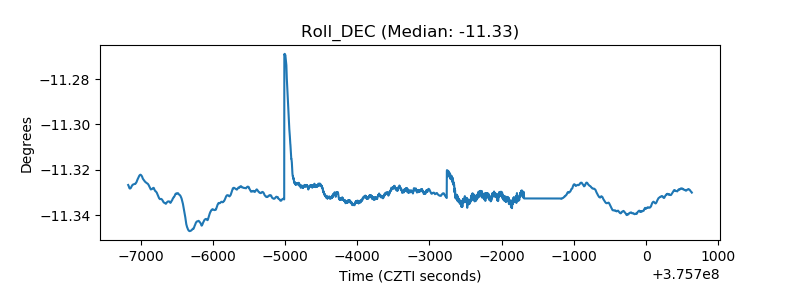 |
| _Roll_RA | 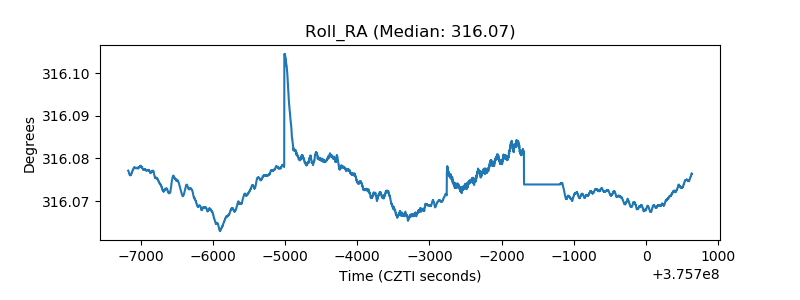 |
| Veto Counter | 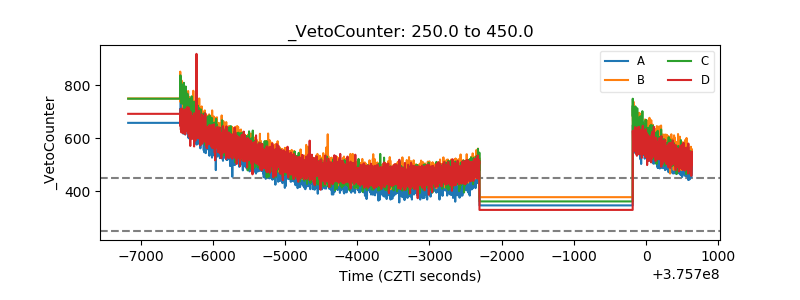 |