| Param | Original file | Final file |
|---|---|---|
| Filename | modeM0/AS1A10_090T11_9000004784_33341cztM0_level2.evt | modeM0/AS1A10_090T11_9000004784_33341cztM0_level2_quad_clean.evt |
| Size (bytes) | 683,651,520 | 79,928,640 |
| Size | 652.0 MB | 76.2 MB |
| Events in quadrant A | 2,845,455 | 537,712 |
| Events in quadrant B | 4,071,275 | 528,536 |
| Events in quadrant C | 7,337,757 | 411,994 |
| Events in quadrant D | 6,028,222 | 505,664 |
| Mode M0 | |||
|---|---|---|---|
| Quadrant | BADHDUFLAG | Total packets | Discarded packets |
| A | 0 | 12652 | 0 |
| B | 0 | 16041 | 0 |
| C | 0 | 25841 | 0 |
| D | 0 | 22386 | 0 |
| Mode M9 | |||
|---|---|---|---|
| Quadrant | BADHDUFLAG | Total packets | Discarded packets |
| A | 0 | 17 | 0 |
| B | 0 | 17 | 0 |
| C | 0 | 17 | 0 |
| D | 0 | 17 | 0 |
| Mode SS | |||
|---|---|---|---|
| Quadrant | BADHDUFLAG | Total packets | Discarded packets |
| A | 0 | 126 | 0 |
| B | 0 | 126 | 0 |
| C | 0 | 126 | 0 |
| D | 0 | 126 | 0 |
| Quadrant | Total seconds | Saturated seconds | Saturation percentage |
|---|---|---|---|
| A | 6245 | 6 | 0.096077% |
| B | 6245 | 209 | 3.346677% |
| C | 6245 | 1605 | 25.700560% |
| D | 6245 | 261 | 4.179343% |
Noise dominated data is calculated using 1-second bins in cleaned event files. If a bin has >2000 counts, and if more than 50% of those come from <1% of pixels, then it is considered to be noise-dominated and hence unusable.
| Quadrant | # 1 sec bins | Bins with >0 counts | Bins with >2000 counts | High rate bins dominated by noise | Noise dominated (total time) | Noise dominated (detector-on time) | Marked lightcurve |
|---|---|---|---|---|---|---|---|
| A | 7858 | 6246 | 3 | 3 | 0.04% | 0.05% | 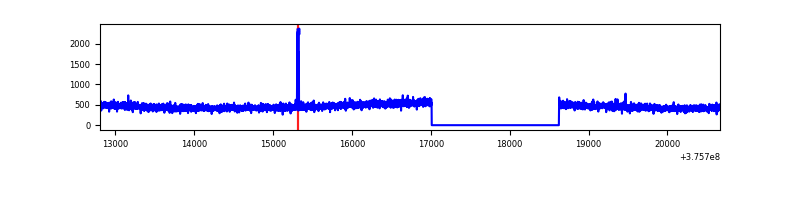 |
| B | 7858 | 6246 | 144 | 144 | 1.83% | 2.31% | 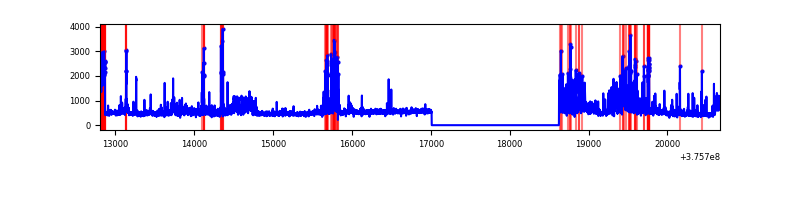 |
| C | 7858 | 6246 | 1543 | 1543 | 19.64% | 24.70% | 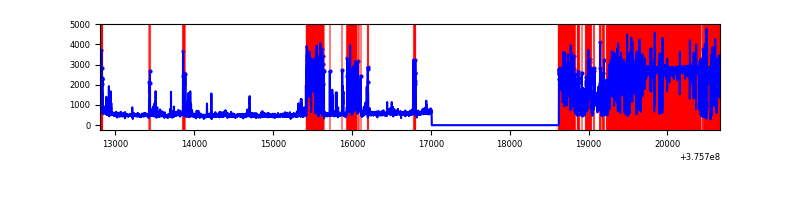 |
| D | 7858 | 6246 | 217 | 217 | 2.76% | 3.47% | 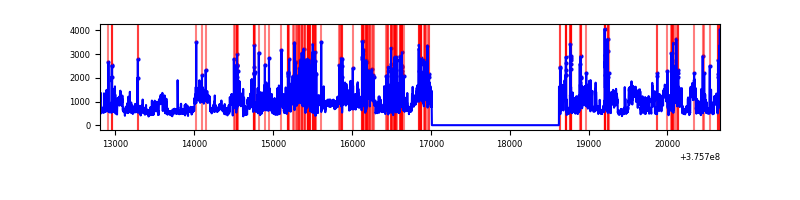 |
Top three noisy pixels from each quadrant. If the there are fewer than three noisy pixels in the level2.evt file, extra rows are filled as -1
| Pixel properties | Quadrant properties | ||||||
|---|---|---|---|---|---|---|---|
| Quadrant | DetID | PixID | Counts | Sigma | Mean | Median | Sigma |
| A | 14 | 254 | 22315 | 147.84 | 727 | 712 | 146.1 |
| A | 13 | 254 | 10581 | 67.54 | 727 | 712 | 146.1 |
| A | 13 | 6 | 7733 | 48.05 | 727 | 712 | 146.1 |
| B | 0 | 219 | 568920 | 4157.4 | 721 | 704 | 136.7 |
| B | 5 | 172 | 278883 | 2035.32 | 721 | 704 | 136.7 |
| B | 5 | 200 | 125613 | 913.9 | 721 | 704 | 136.7 |
| C | 10 | 49 | 3007353 | 21448.28 | 603 | 609 | 140.2 |
| C | 1 | 23 | 1522963 | 10859.55 | 603 | 609 | 140.2 |
| C | 15 | 214 | 241397 | 1717.63 | 603 | 609 | 140.2 |
| D | 8 | 195 | 1854486 | 10576.6 | 690 | 673 | 175.3 |
| D | 2 | 250 | 445870 | 2539.99 | 690 | 673 | 175.3 |
| D | 2 | 249 | 231382 | 1316.27 | 690 | 673 | 175.3 |
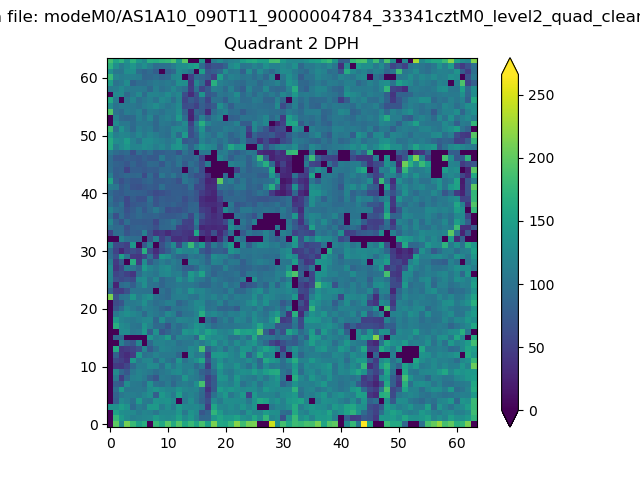
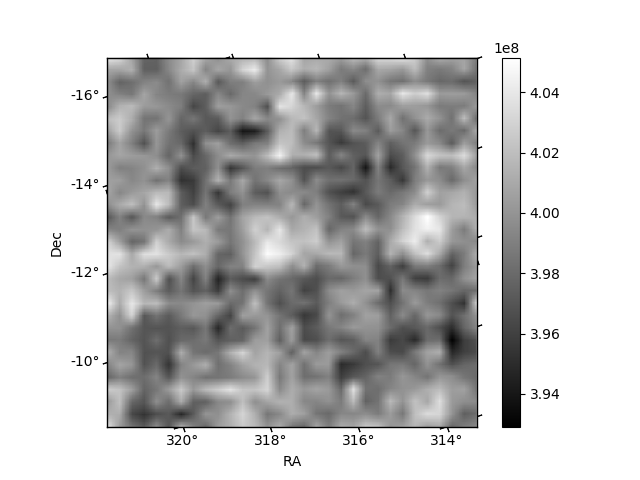
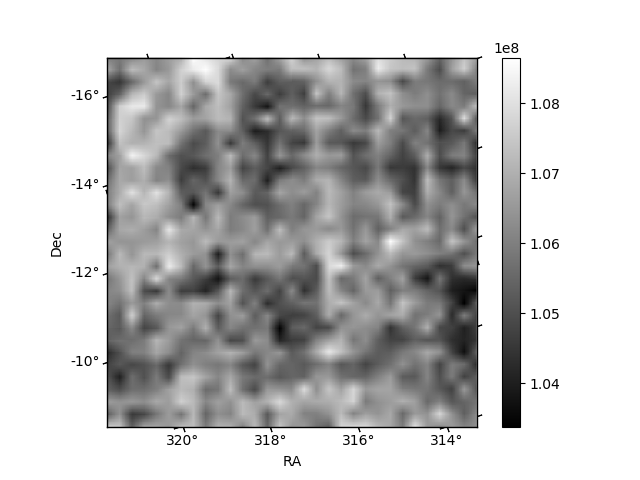
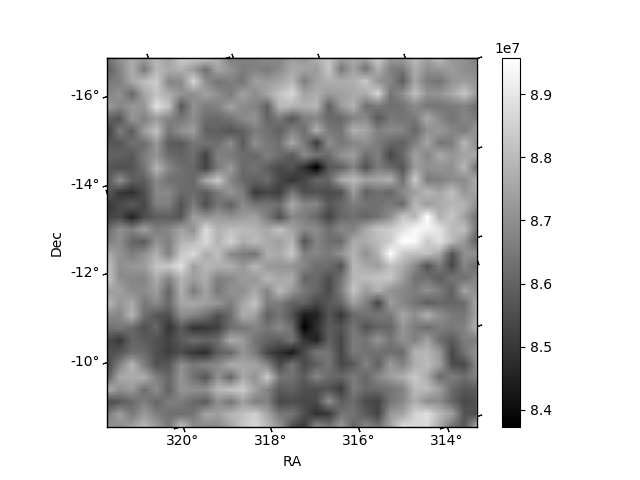
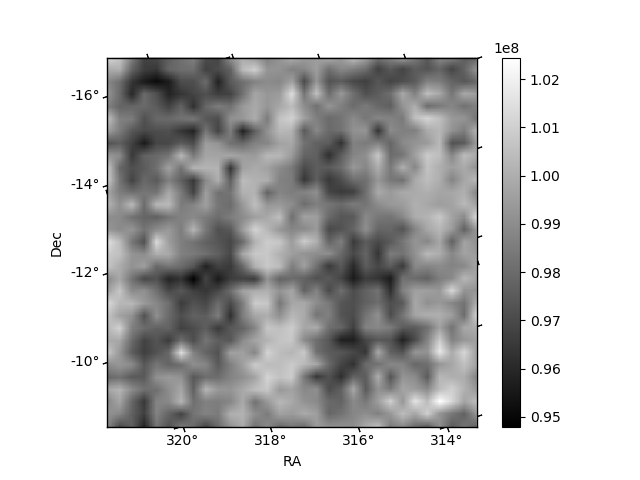
Histogram calculated using DETX and DETY for each event in the final _common_clean file
| Quadrant A | 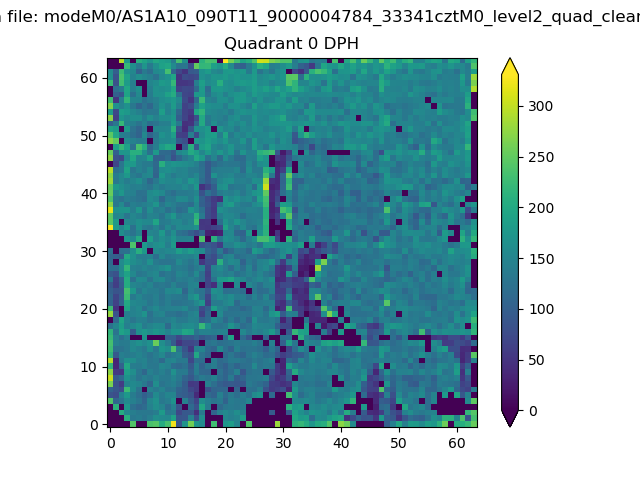 |
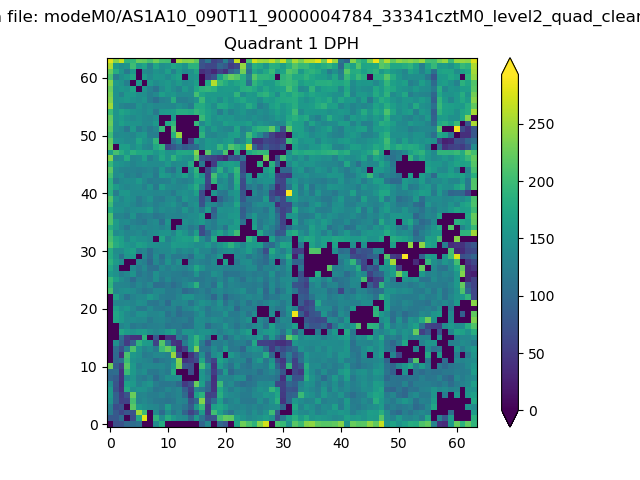 |
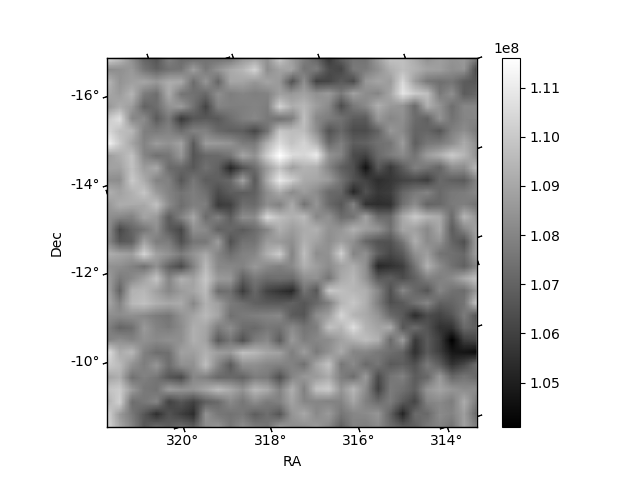
Quadrant B |
|---|---|---|---|
| Quadrant D | 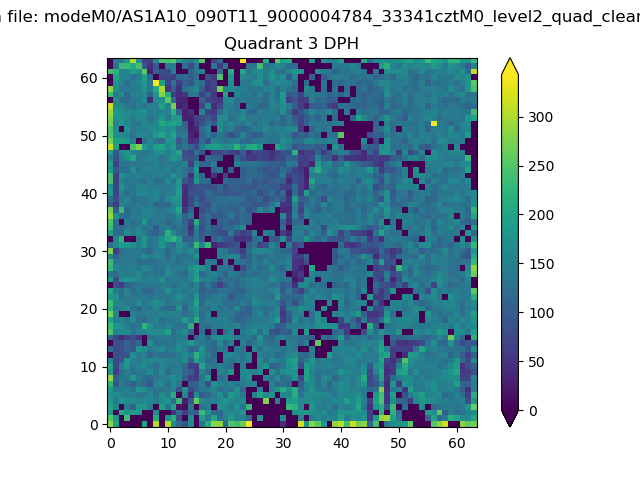 |
 |
Quadrant C |
| Plot type | Count rate plots | Images |
|---|---|---|
| Comparison with Poisson distribution Blue bars denote a histogram of data divided into 1 sec bins. Red curve is a Poisson curve with rate = median count rate of data. |
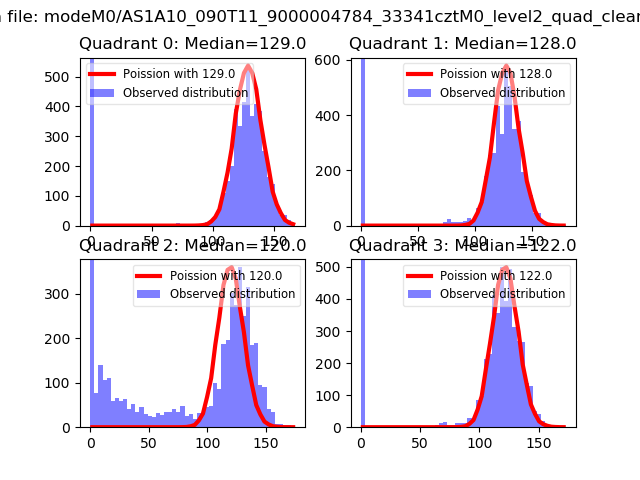 |
 |
| Quadrant-wise count rates Data is divided into 100 sec bins |
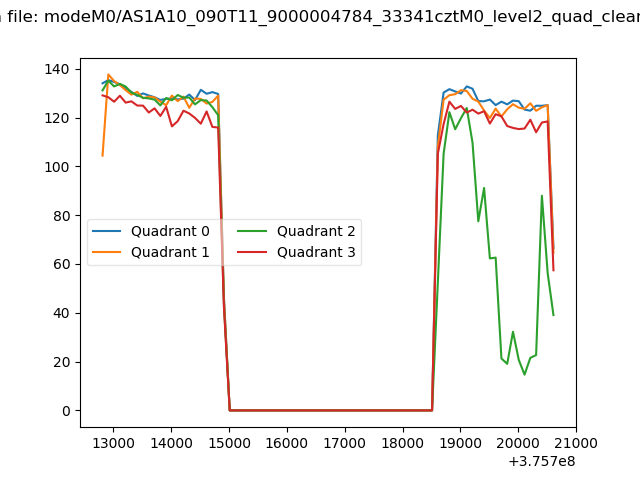 |
|
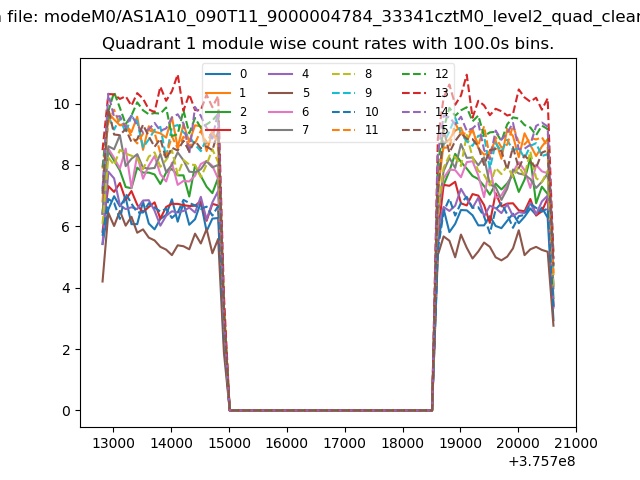
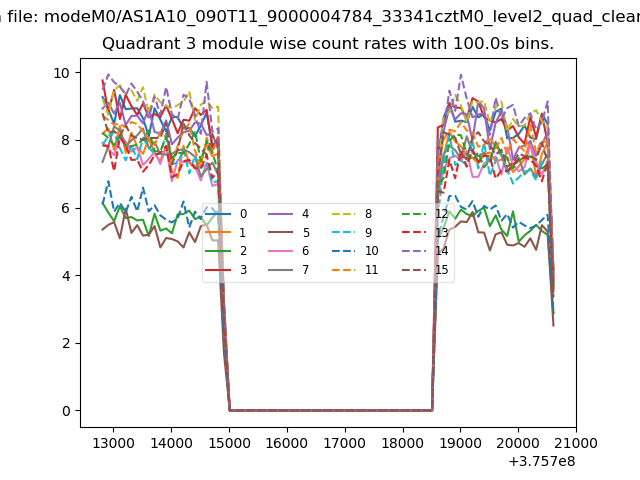
| Module-wise count rates for Quadrant A Data is divided into 100 sec bins |
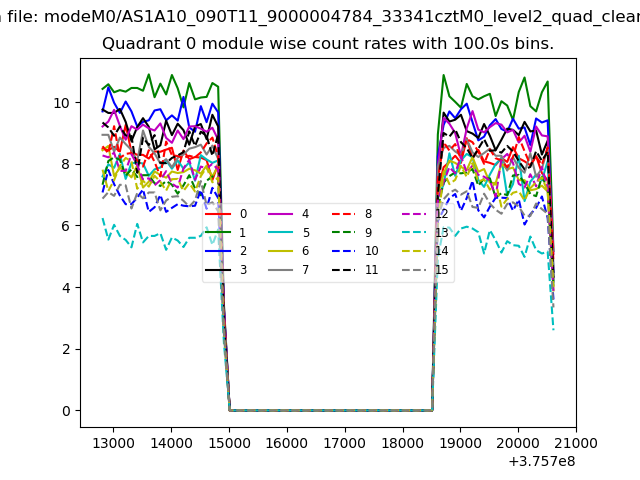 |
 |
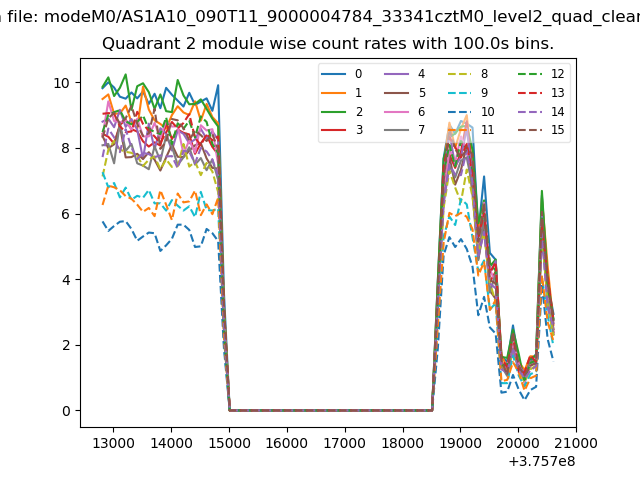
| Module-wise count rates for Quadrant B Data is divided into 100 sec bins |
 |
 |
| Module-wise count rates for Quadrant C Data is divided into 100 sec bins |
 |
 |
| Module-wise count rates for Quadrant D Data is divided into 100 sec bins |
 |
 |
| Parameter | Plot |
|---|---|
| CZT HV Monitor | 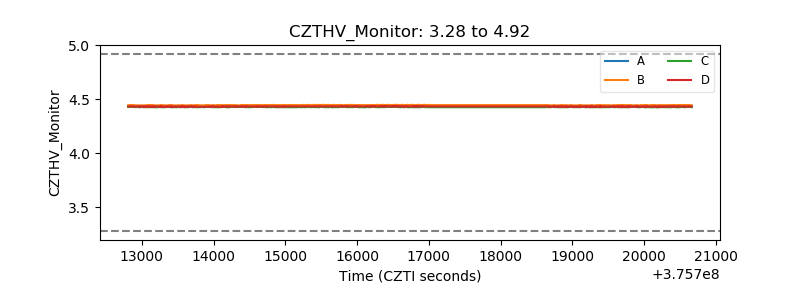 |
| D_VDD | 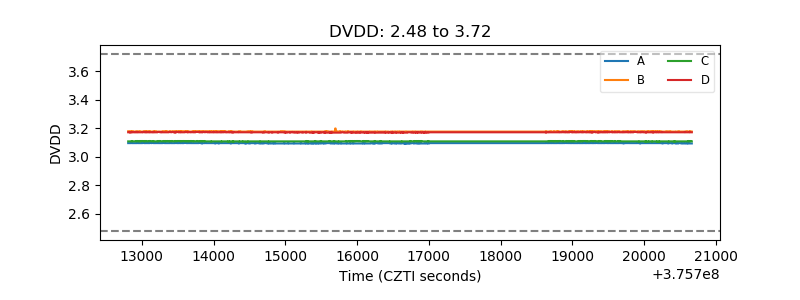 |
| Temperature 1 | 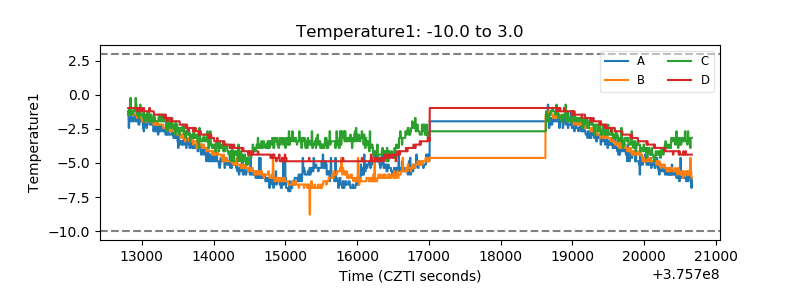 |
| Veto HV Monitor | 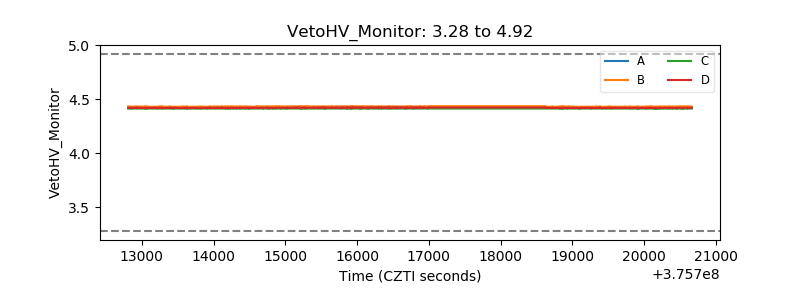 |
| Veto LLD |  |
| Alpha Counter | 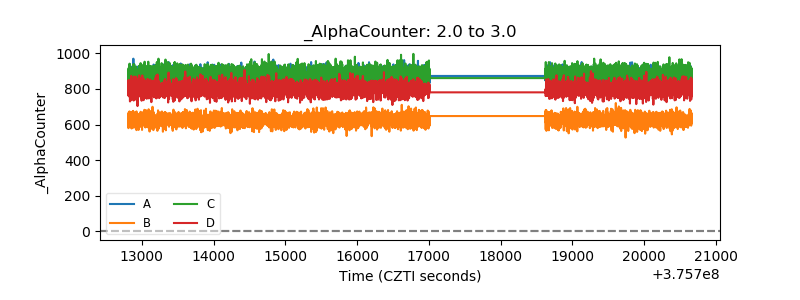 |
| _CPM_Rate | 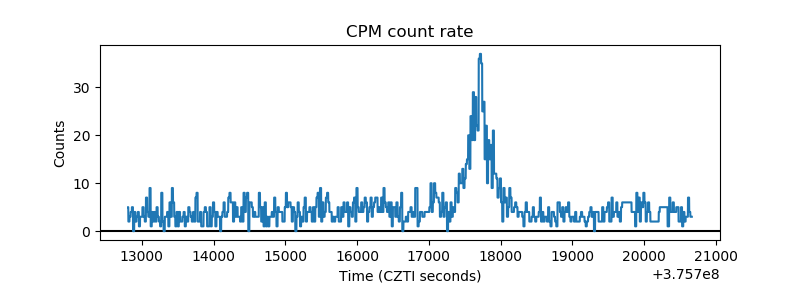 |
| CZT Counter | 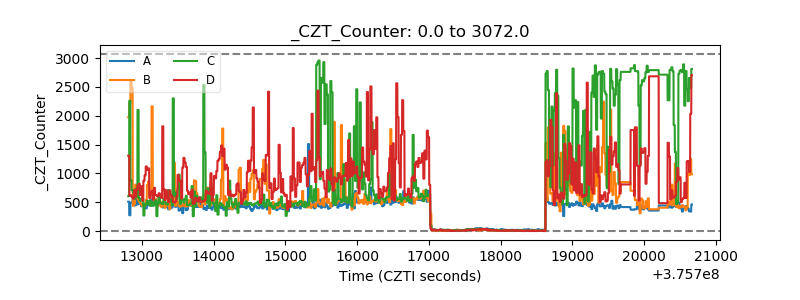 |
| +2.5 Volts monitor |  |
| +5 Volts monitor | 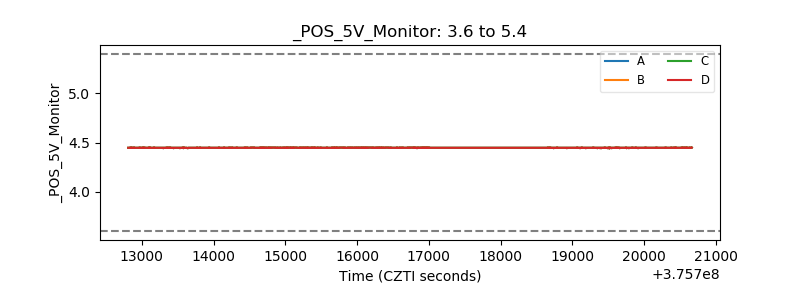 |
| _ROLL_ROT | 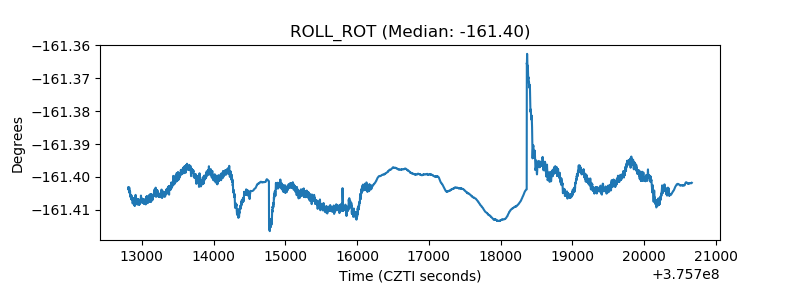 |
| _Roll_DEC | 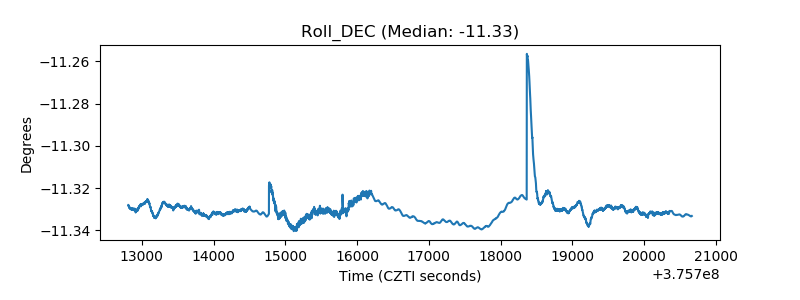 |
| _Roll_RA | 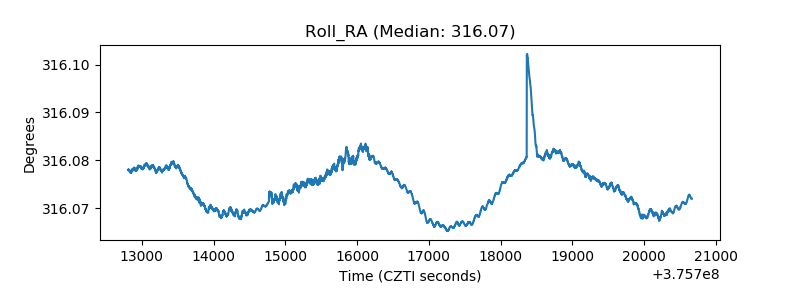 |
| Veto Counter | 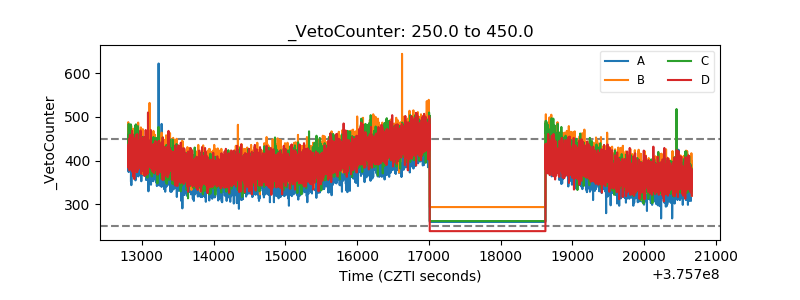 |