| Param | Original file | Final file |
|---|---|---|
| Filename | modeM0/AS1A10_064T02_9000004788_33369cztM0_level2.evt | modeM0/AS1A10_064T02_9000004788_33369cztM0_level2_quad_clean.evt |
| Size (bytes) | 157,000,320 | 19,059,840 |
| Size | 149.7 MB | 18.2 MB |
| Events in quadrant A | 781,344 | 120,674 |
| Events in quadrant B | 1,291,988 | 111,624 |
| Events in quadrant C | 915,240 | 116,696 |
| Events in quadrant D | 1,655,035 | 109,192 |
| Mode M9 | |||
|---|---|---|---|
| Quadrant | BADHDUFLAG | Total packets | Discarded packets |
| A | 0 | 16 | 0 |
| B | 0 | 16 | 0 |
| C | 0 | 16 | 0 |
| D | 0 | 16 | 0 |
| Mode M0 | |||
|---|---|---|---|
| Quadrant | BADHDUFLAG | Total packets | Discarded packets |
| A | 0 | 3269 | 2 |
| B | 0 | 4850 | 1 |
| C | 0 | 3579 | 1 |
| D | 0 | 6050 | 1 |
| Mode SS | |||
|---|---|---|---|
| Quadrant | BADHDUFLAG | Total packets | Discarded packets |
| A | 0 | 34 | 0 |
| B | 0 | 34 | 0 |
| C | 0 | 34 | 0 |
| D | 0 | 34 | 0 |
| Quadrant | Total seconds | Saturated seconds | Saturation percentage |
|---|---|---|---|
| A | 1604 | 2 | 0.124688% |
| B | 1604 | 159 | 9.912718% |
| C | 1604 | 17 | 1.059850% |
| D | 1604 | 164 | 10.224439% |
Noise dominated data is calculated using 1-second bins in cleaned event files. If a bin has >2000 counts, and if more than 50% of those come from <1% of pixels, then it is considered to be noise-dominated and hence unusable.
| Quadrant | # 1 sec bins | Bins with >0 counts | Bins with >2000 counts | High rate bins dominated by noise | Noise dominated (total time) | Noise dominated (detector-on time) | Marked lightcurve |
|---|---|---|---|---|---|---|---|
| A | 3187 | 1605 | 0 | 0 | 0.00% | 0.00% | 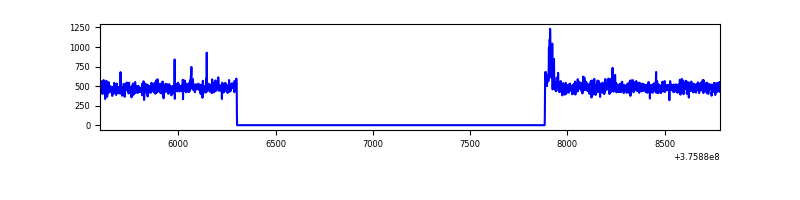 |
| B | 3187 | 1605 | 119 | 119 | 3.73% | 7.41% | 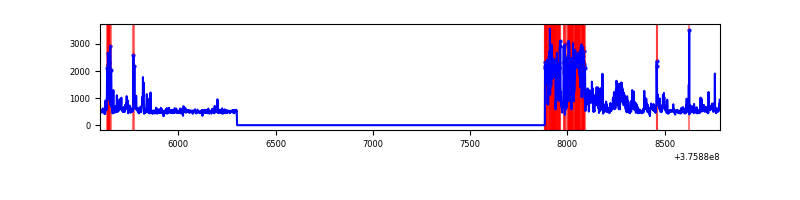 |
| C | 3187 | 1605 | 11 | 11 | 0.35% | 0.69% | 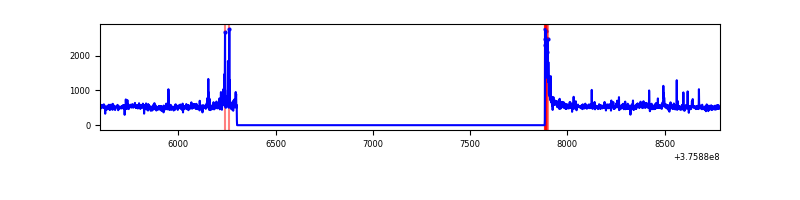 |
| D | 3186 | 1604 | 139 | 139 | 4.36% | 8.67% | 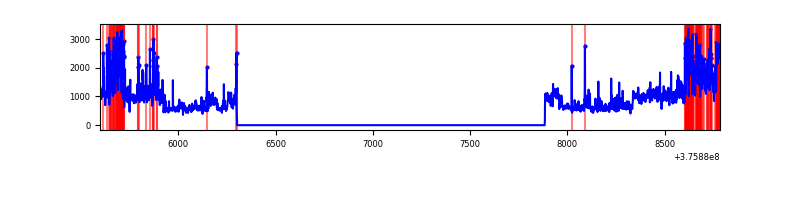 |
Top three noisy pixels from each quadrant. If the there are fewer than three noisy pixels in the level2.evt file, extra rows are filled as -1
| Pixel properties | Quadrant properties | ||||||
|---|---|---|---|---|---|---|---|
| Quadrant | DetID | PixID | Counts | Sigma | Mean | Median | Sigma |
| A | 7 | 16 | 11508 | 273.61 | 199 | 195 | 41.3 |
| A | 13 | 254 | 2566 | 57.34 | 199 | 195 | 41.3 |
| A | 3 | 137 | 1932 | 42.01 | 199 | 195 | 41.3 |
| B | 5 | 172 | 372758 | 9907.24 | 187 | 182 | 37.6 |
| B | 0 | 219 | 159562 | 4238.1 | 187 | 182 | 37.6 |
| B | 0 | 156 | 5049 | 129.41 | 187 | 182 | 37.6 |
| C | 15 | 214 | 72330 | 1609.07 | 188 | 189 | 44.8 |
| C | 0 | 10 | 49456 | 1098.88 | 188 | 189 | 44.8 |
| C | 15 | 208 | 31462 | 697.53 | 188 | 189 | 44.8 |
| D | 8 | 195 | 376289 | 8024.66 | 184 | 179 | 46.9 |
| D | 1 | 52 | 282920 | 6032.54 | 184 | 179 | 46.9 |
| D | 2 | 250 | 107508 | 2289.96 | 184 | 179 | 46.9 |
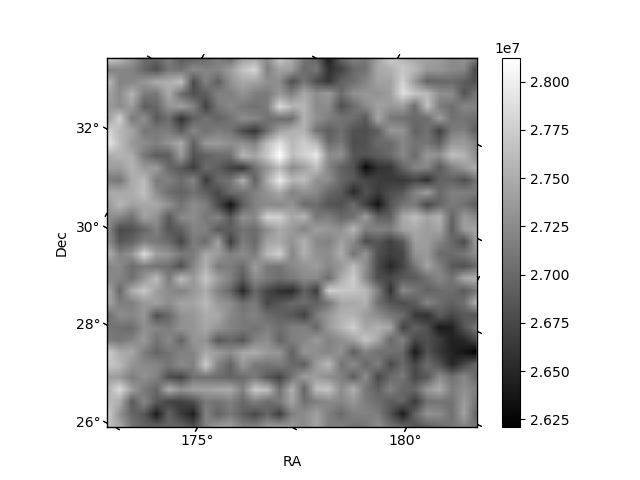
Histogram calculated using DETX and DETY for each event in the final _common_clean file
| Quadrant A | 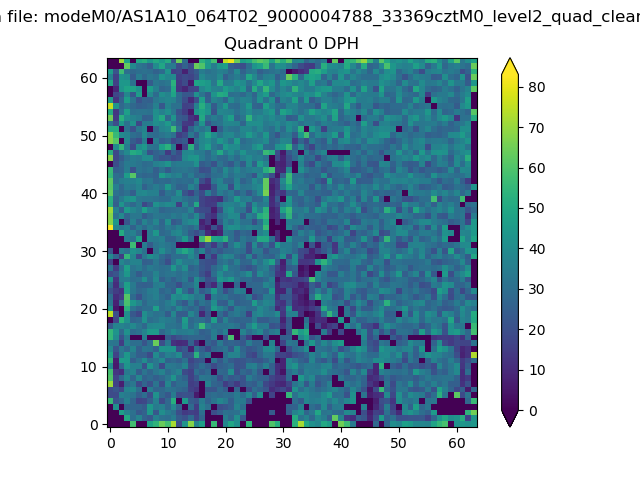 |
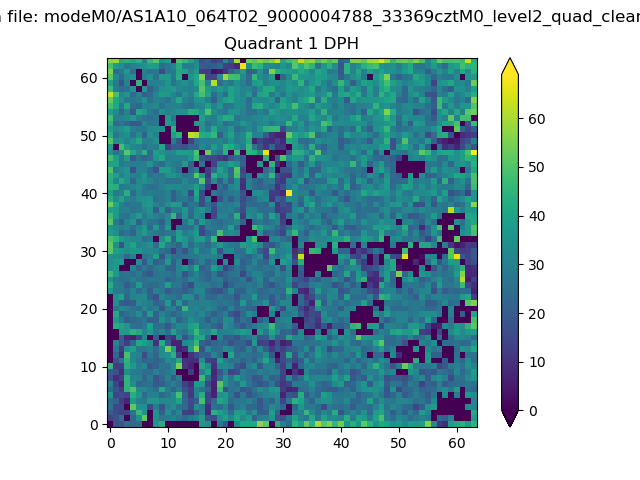 |
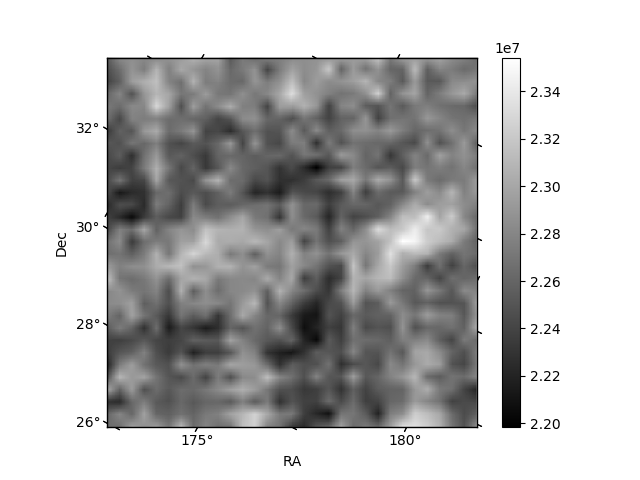
Quadrant B |
|---|---|---|---|
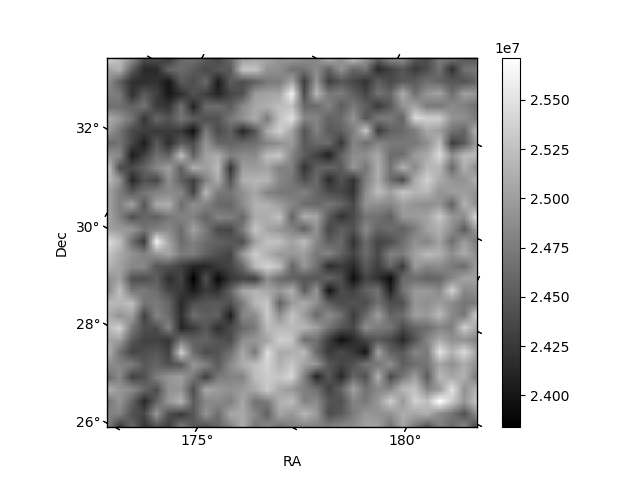
| Quadrant D | 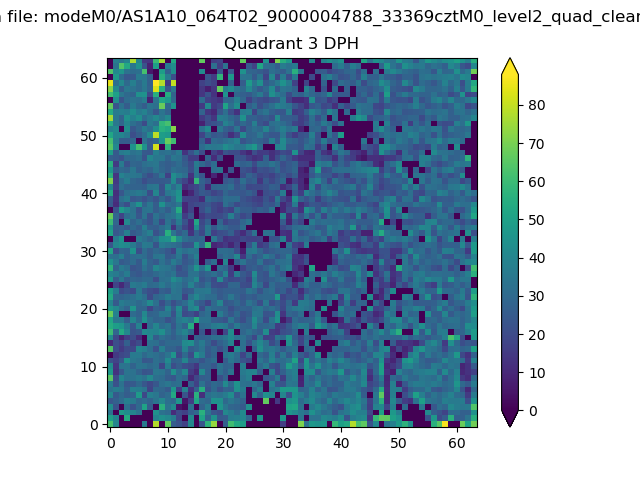 |
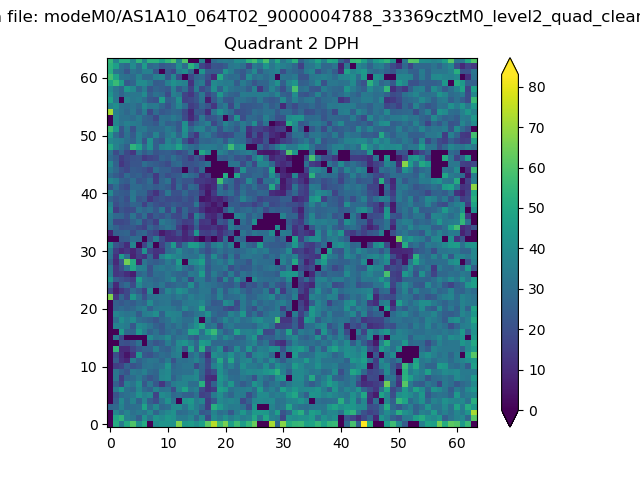 |
Quadrant C |
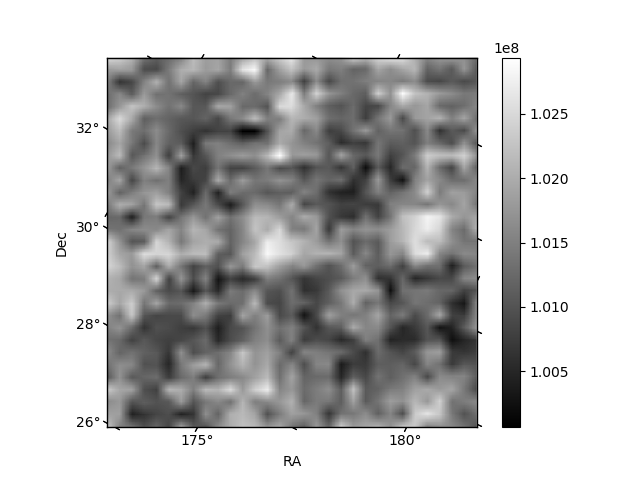
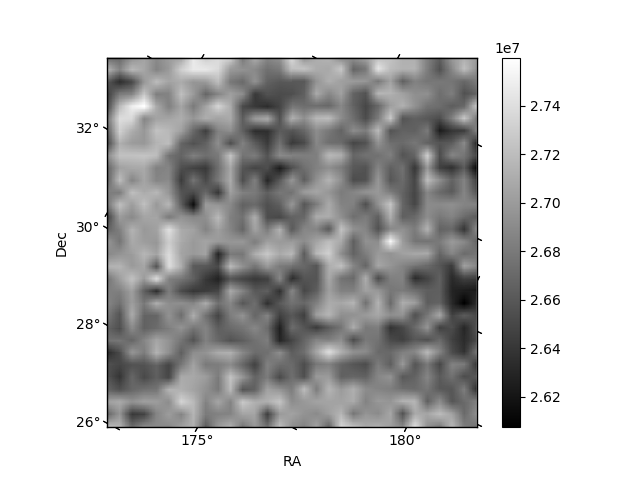
| Plot type | Count rate plots | Images |
|---|---|---|
| Comparison with Poisson distribution Blue bars denote a histogram of data divided into 1 sec bins. Red curve is a Poisson curve with rate = median count rate of data. |
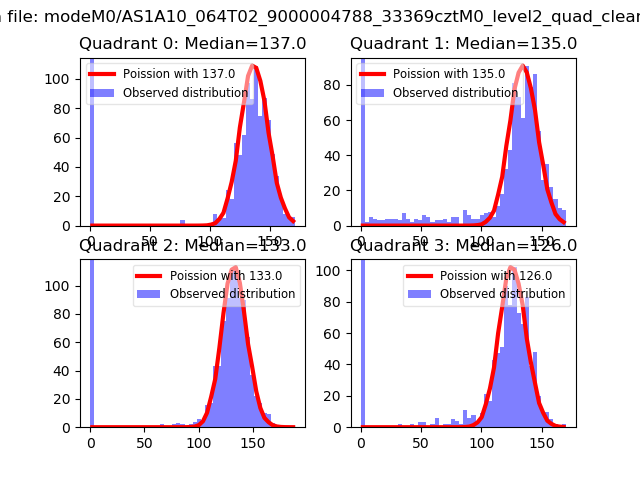 |
 |
| Quadrant-wise count rates Data is divided into 100 sec bins |
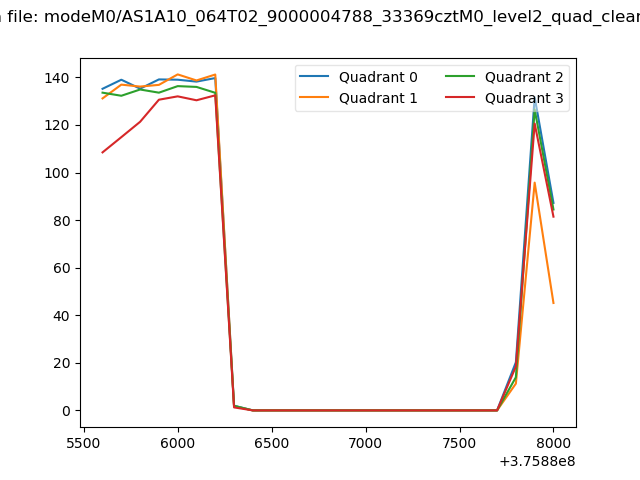 |
|
| Module-wise count rates for Quadrant A Data is divided into 100 sec bins |
 |
 |
| Module-wise count rates for Quadrant B Data is divided into 100 sec bins |
 |
 |
| Module-wise count rates for Quadrant C Data is divided into 100 sec bins |
 |
 |
| Module-wise count rates for Quadrant D Data is divided into 100 sec bins |
 |
 |
| Parameter | Plot |
|---|---|
| CZT HV Monitor |  |
| D_VDD | 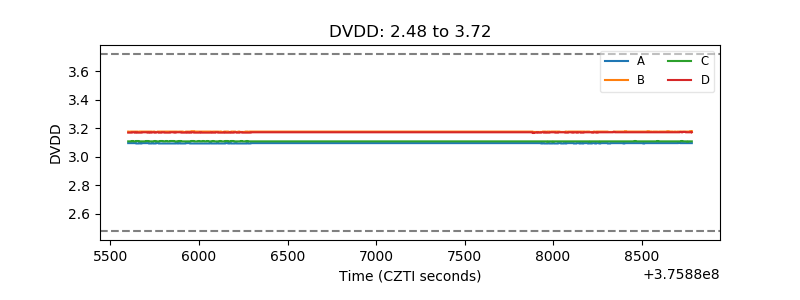 |
| Temperature 1 | 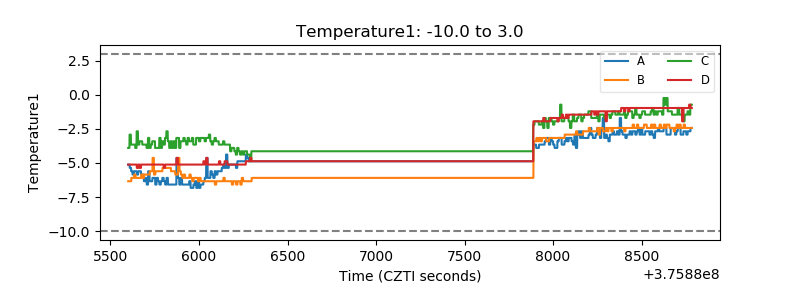 |
| Veto HV Monitor | 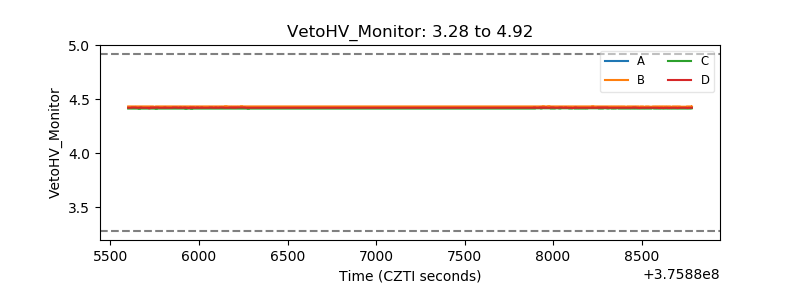 |
| Veto LLD | 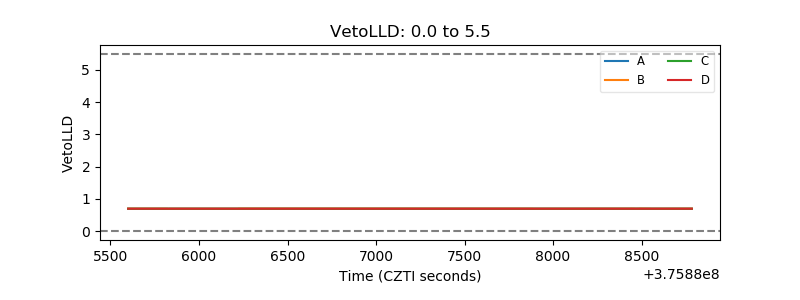 |
| Alpha Counter | 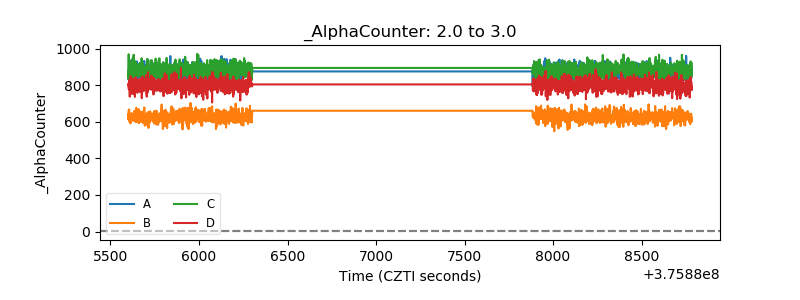 |
| _CPM_Rate | 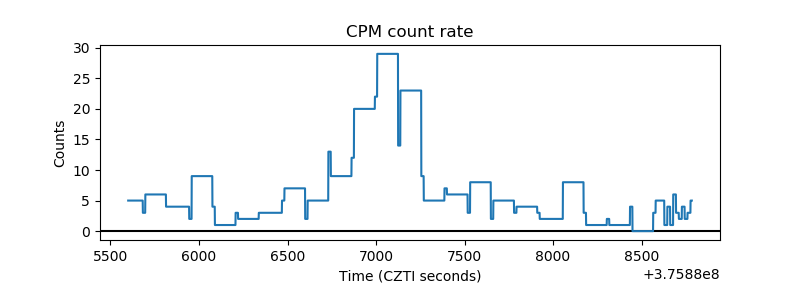 |
| CZT Counter | 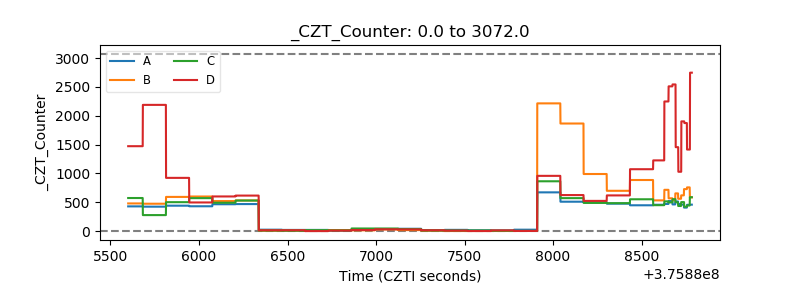 |
| +2.5 Volts monitor |  |
| +5 Volts monitor |  |
| _ROLL_ROT |  |
| _Roll_DEC | 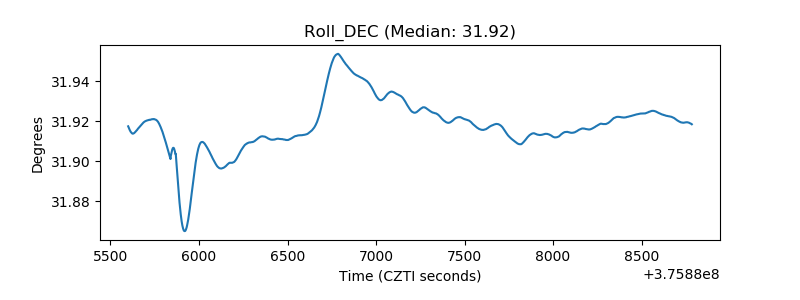 |
| _Roll_RA | 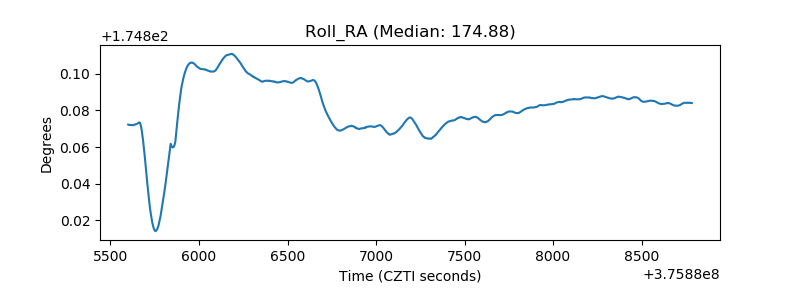 |
| Veto Counter | 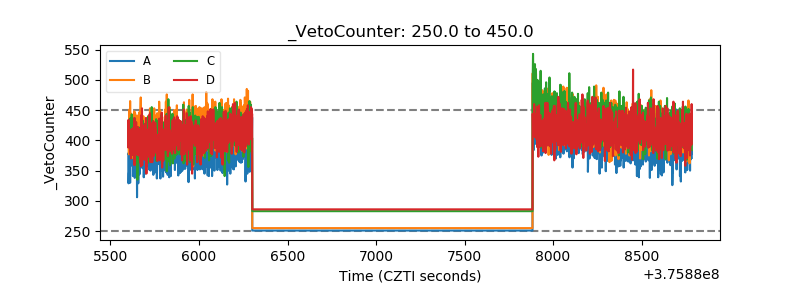 |