| Param | Original file | Final file |
|---|---|---|
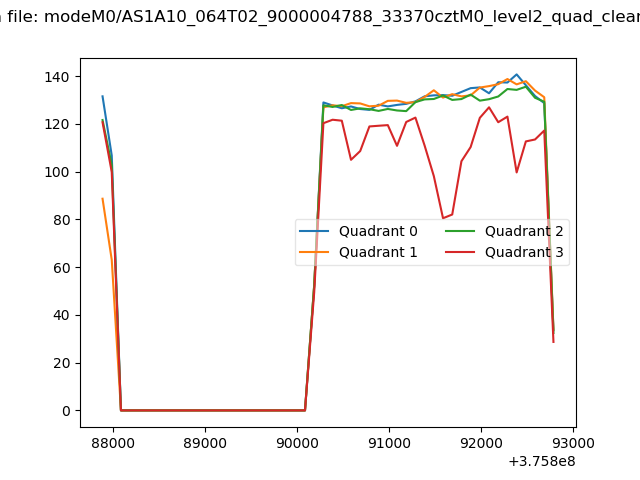
| Filename | modeM0/AS1A10_064T02_9000004788_33370cztM0_level2.evt | modeM0/AS1A10_064T02_9000004788_33370cztM0_level2_quad_clean.evt |
| Size (bytes) | 561,905,280 | 58,858,560 |
| Size | 535.9 MB | 56.1 MB |
| Events in quadrant A | 2,684,875 | 360,367 |
| Events in quadrant B | 3,843,407 | 352,812 |
| Events in quadrant C | 3,169,313 | 354,376 |
| Events in quadrant D | 6,929,312 | 311,001 |
| Mode M9 | |||
|---|---|---|---|
| Quadrant | BADHDUFLAG | Total packets | Discarded packets |
| A | 0 | 16 | 0 |
| B | 0 | 16 | 0 |
| C | 0 | 16 | 0 |
| D | 0 | 17 | 0 |
| Mode M0 | |||
|---|---|---|---|
| Quadrant | BADHDUFLAG | Total packets | Discarded packets |
| A | 0 | 11619 | 3 |
| B | 0 | 15026 | 2 |
| C | 0 | 12605 | 2 |
| D | 0 | 24760 | 2 |
| Mode SS | |||
|---|---|---|---|
| Quadrant | BADHDUFLAG | Total packets | Discarded packets |
| A | 0 | 116 | 0 |
| B | 0 | 116 | 0 |
| C | 0 | 116 | 0 |
| D | 0 | 116 | 0 |
| Quadrant | Total seconds | Saturated seconds | Saturation percentage |
|---|---|---|---|
| A | 5770 | 3 | 0.051993% |
| B | 5770 | 252 | 4.367418% |
| C | 5770 | 41 | 0.710572% |
| D | 5770 | 883 | 15.303293% |
Noise dominated data is calculated using 1-second bins in cleaned event files. If a bin has >2000 counts, and if more than 50% of those come from <1% of pixels, then it is considered to be noise-dominated and hence unusable.
| Quadrant | # 1 sec bins | Bins with >0 counts | Bins with >2000 counts | High rate bins dominated by noise | Noise dominated (total time) | Noise dominated (detector-on time) | Marked lightcurve |
|---|---|---|---|---|---|---|---|
| A | 7114 | 5771 | 0 | 0 | 0.00% | 0.00% | 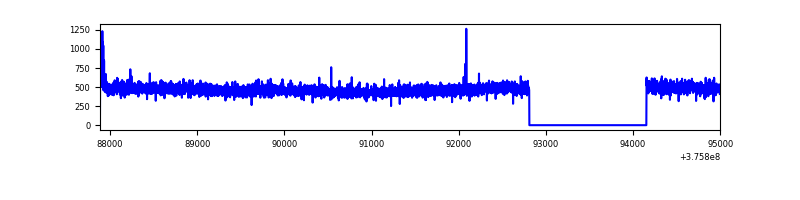 |
| B | 7114 | 5771 | 190 | 190 | 2.67% | 3.29% | 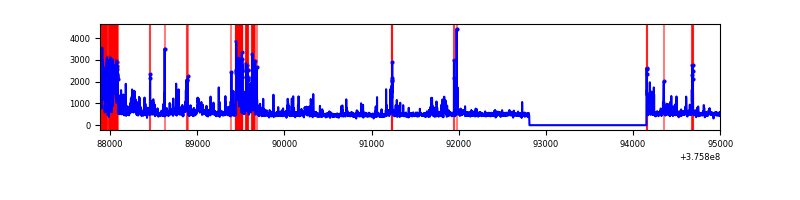 |
| C | 7114 | 5771 | 28 | 28 | 0.39% | 0.49% | 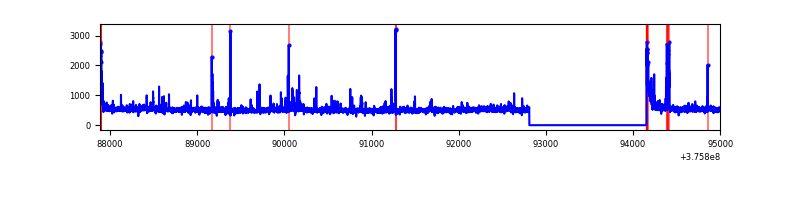 |
| D | 7114 | 5771 | 800 | 800 | 11.25% | 13.86% | 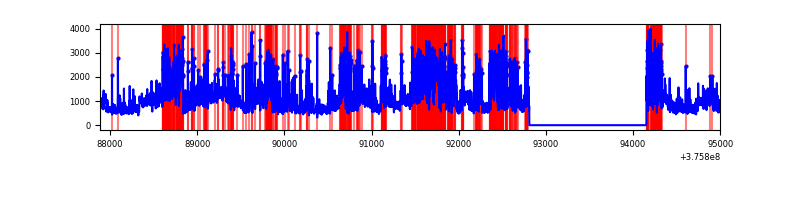 |
Top three noisy pixels from each quadrant. If the there are fewer than three noisy pixels in the level2.evt file, extra rows are filled as -1
| Pixel properties | Quadrant properties | ||||||
|---|---|---|---|---|---|---|---|
| Quadrant | DetID | PixID | Counts | Sigma | Mean | Median | Sigma |
| A | 7 | 16 | 12237 | 83.2 | 690 | 676 | 139.0 |
| A | 13 | 254 | 9063 | 60.36 | 690 | 676 | 139.0 |
| A | 3 | 137 | 6757 | 43.76 | 690 | 676 | 139.0 |
| B | 5 | 172 | 680555 | 5267.56 | 675 | 658 | 129.1 |
| B | 0 | 219 | 311139 | 2405.48 | 675 | 658 | 129.1 |
| B | 15 | 32 | 33520 | 254.6 | 675 | 658 | 129.1 |
| C | 15 | 214 | 251107 | 1627.76 | 666 | 672 | 153.9 |
| C | 0 | 10 | 132560 | 857.24 | 666 | 672 | 153.9 |
| C | 15 | 208 | 75501 | 486.37 | 666 | 672 | 153.9 |
| D | 8 | 195 | 1395360 | 8912.29 | 636 | 618 | 156.5 |
| D | 14 | 173 | 1160316 | 7410.38 | 636 | 618 | 156.5 |
| D | 1 | 52 | 928295 | 5927.78 | 636 | 618 | 156.5 |
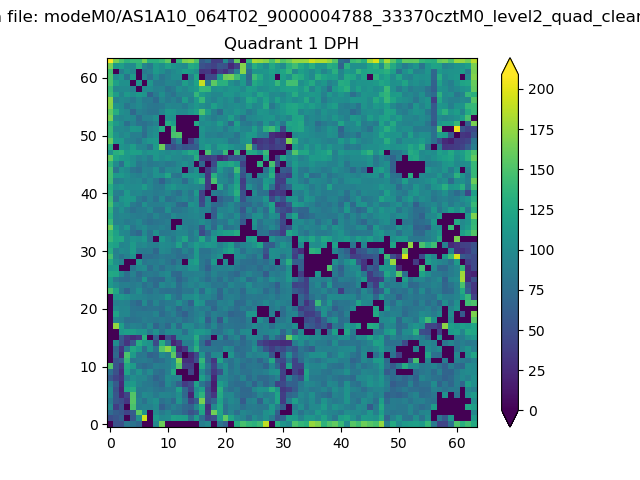
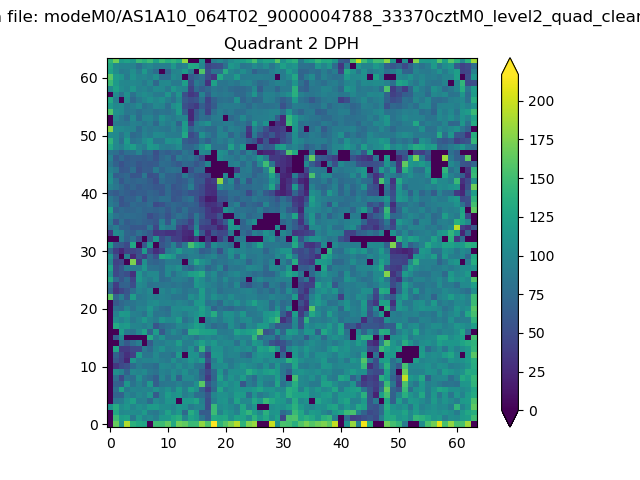
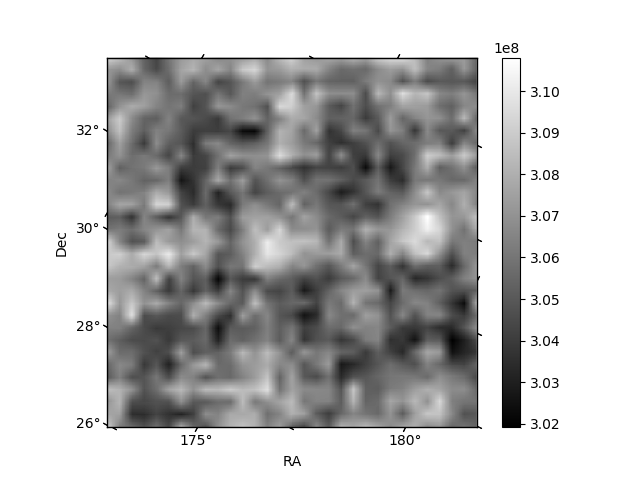
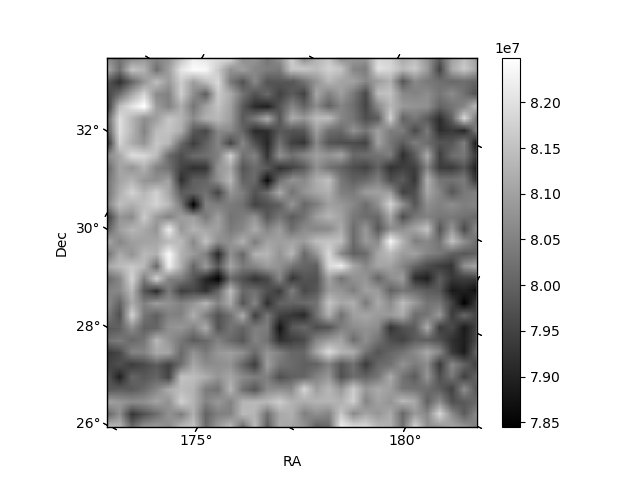
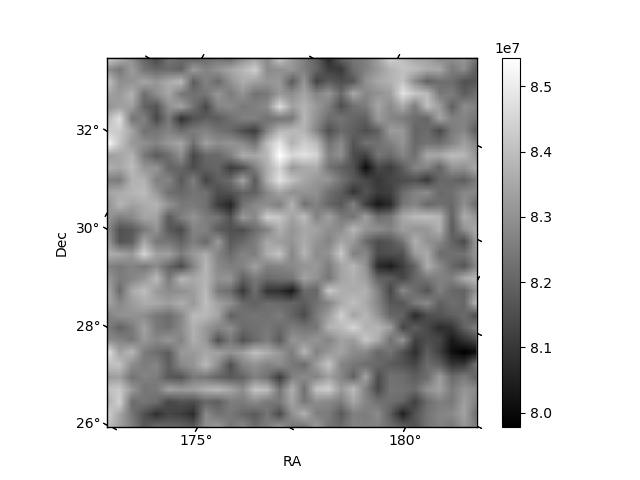
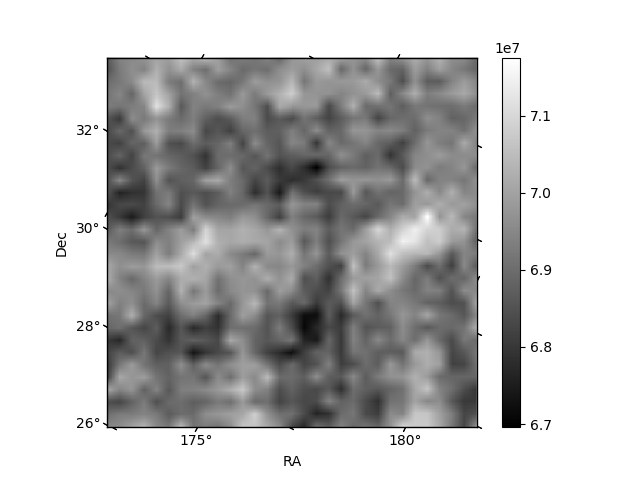
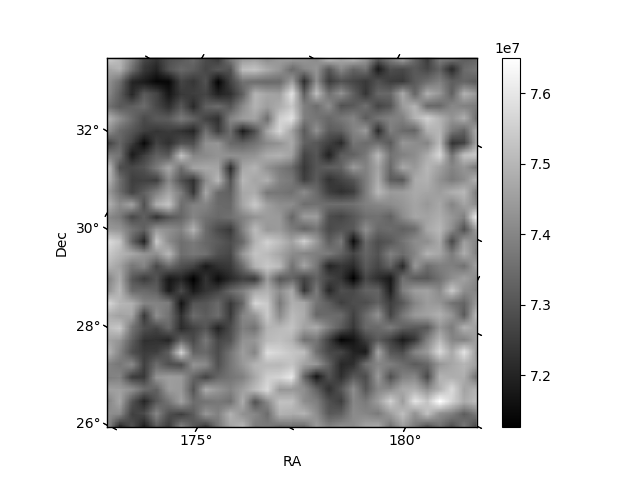
Histogram calculated using DETX and DETY for each event in the final _common_clean file
| Quadrant A |  |
 |
Quadrant B |
|---|---|---|---|
| Quadrant D | 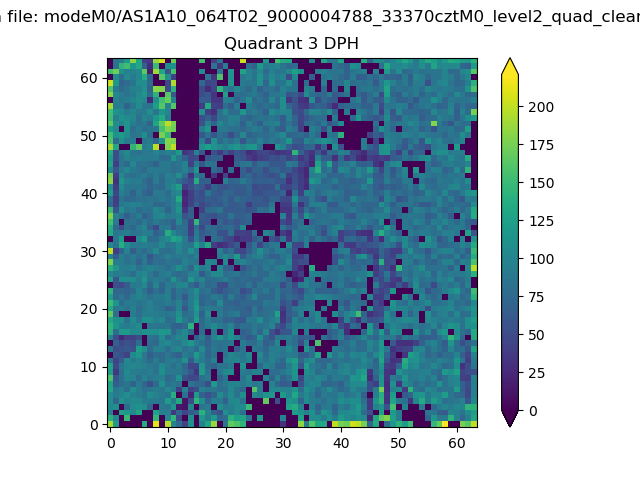 |
 |
Quadrant C |
| Plot type | Count rate plots | Images |
|---|---|---|
| Comparison with Poisson distribution Blue bars denote a histogram of data divided into 1 sec bins. Red curve is a Poisson curve with rate = median count rate of data. |
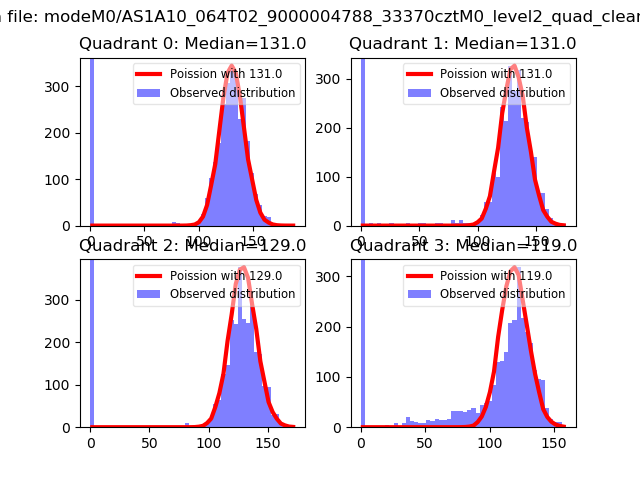 |
 |
| Quadrant-wise count rates Data is divided into 100 sec bins |
 |
|
| Module-wise count rates for Quadrant A Data is divided into 100 sec bins |
 |
 |
| Module-wise count rates for Quadrant B Data is divided into 100 sec bins |
 |
 |
| Module-wise count rates for Quadrant C Data is divided into 100 sec bins |
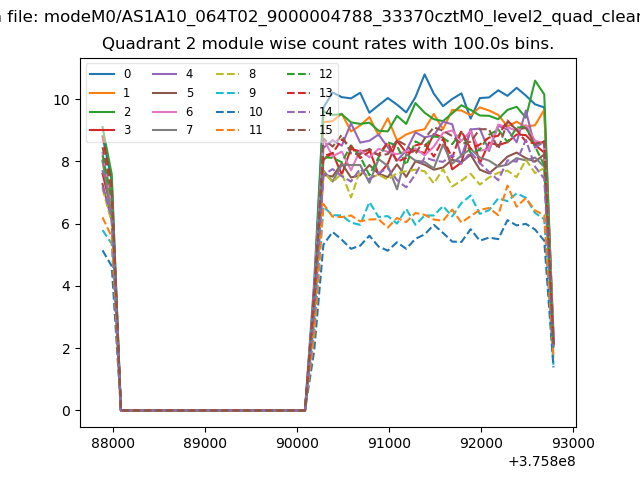 |
 |
| Module-wise count rates for Quadrant D Data is divided into 100 sec bins |
 |
 |
| Parameter | Plot |
|---|---|
| CZT HV Monitor | 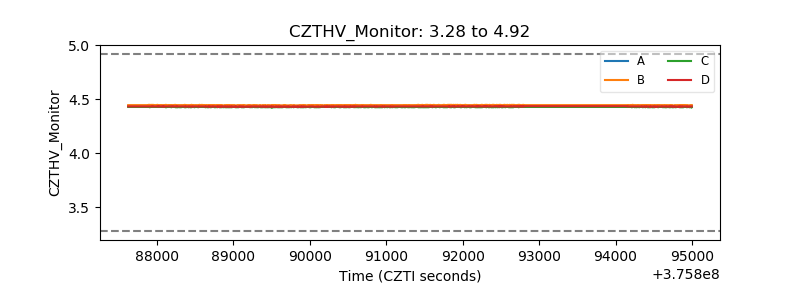 |
| D_VDD | 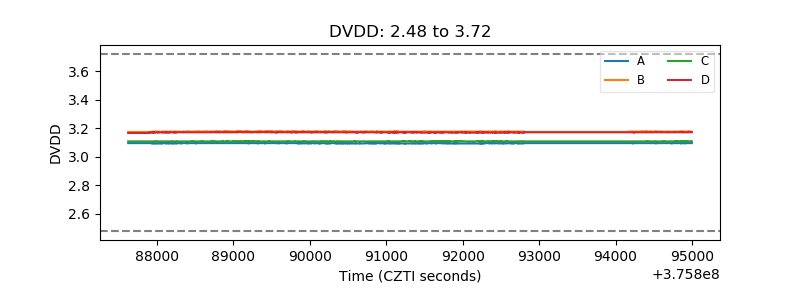 |
| Temperature 1 | 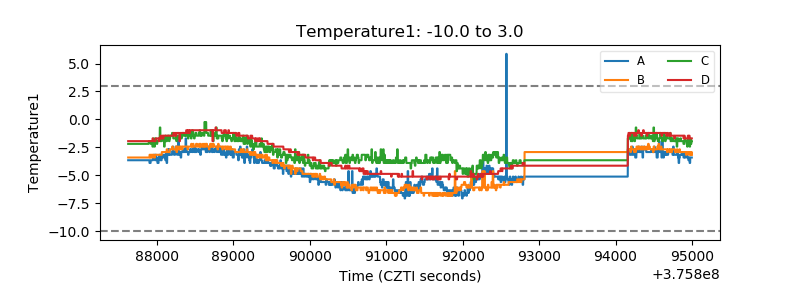 |
| Veto HV Monitor | 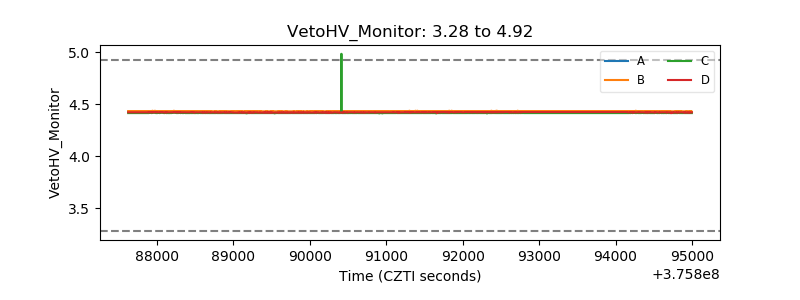 |
| Veto LLD | 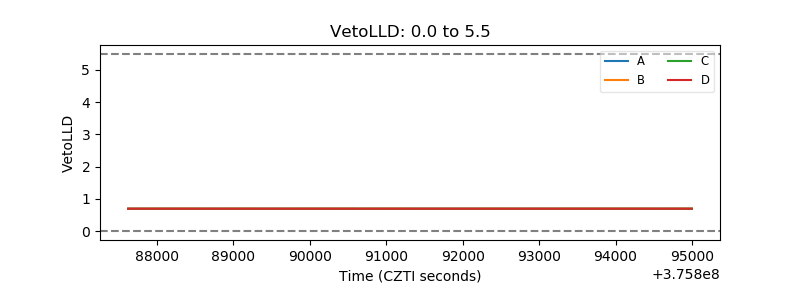 |
| Alpha Counter | 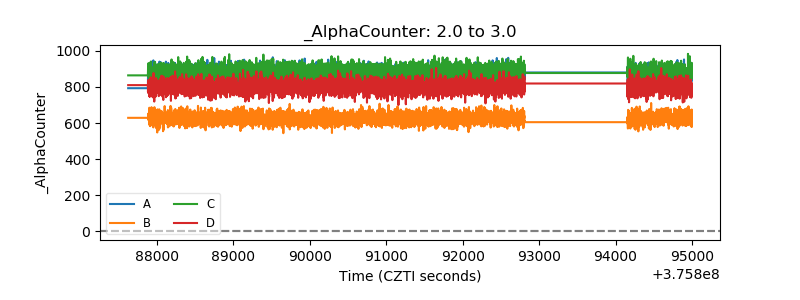 |
| _CPM_Rate | 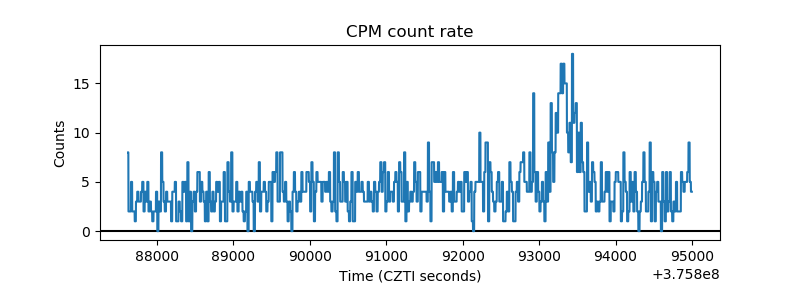 |
| CZT Counter | 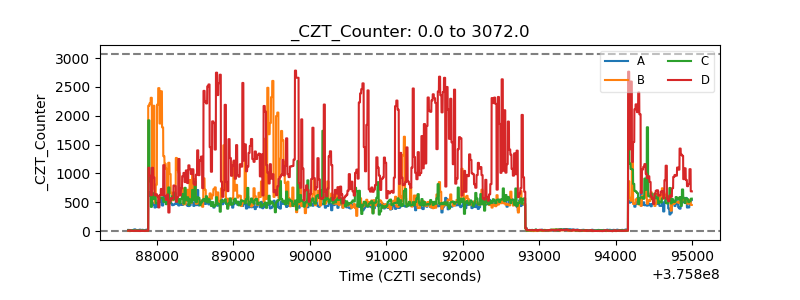 |
| +2.5 Volts monitor | 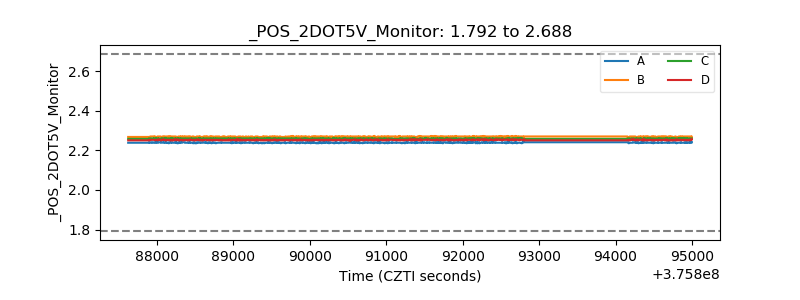 |
| +5 Volts monitor |  |
| _ROLL_ROT |  |
| _Roll_DEC |  |
| _Roll_RA | 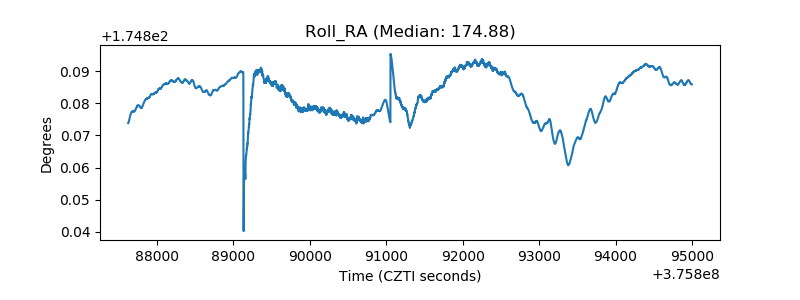 |
| Veto Counter | 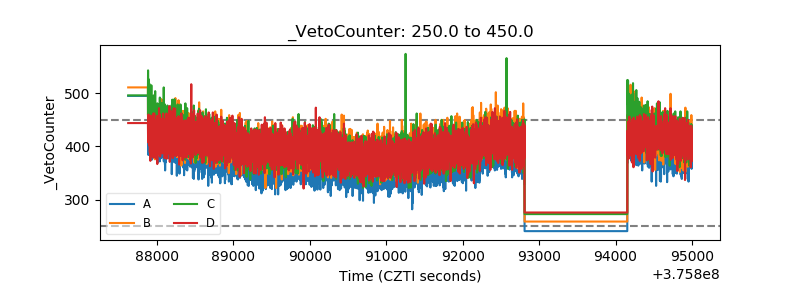 |