| Param | Original file | Final file |
|---|---|---|
| Filename | modeM0/AS1A10_064T02_9000004788_33373cztM0_level2.evt | modeM0/AS1A10_064T02_9000004788_33373cztM0_level2_quad_clean.evt |
| Size (bytes) | 779,400,000 | 124,871,040 |
| Size | 743.3 MB | 119.1 MB |
| Events in quadrant A | 4,190,976 | 817,939 |
| Events in quadrant B | 5,679,038 | 808,775 |
| Events in quadrant C | 4,865,587 | 808,813 |
| Events in quadrant D | 8,258,553 | 719,655 |
| Mode M9 | |||
|---|---|---|---|
| Quadrant | BADHDUFLAG | Total packets | Discarded packets |
| A | 0 | 18 | 0 |
| B | 0 | 18 | 0 |
| C | 0 | 18 | 0 |
| D | 0 | 19 | 0 |
| Mode M0 | |||
|---|---|---|---|
| Quadrant | BADHDUFLAG | Total packets | Discarded packets |
| A | 0 | 19866 | 1435 |
| B | 0 | 24366 | 1659 |
| C | 0 | 21481 | 1565 |
| D | 0 | 34667 | 3975 |
| Mode SS | |||
|---|---|---|---|
| Quadrant | BADHDUFLAG | Total packets | Discarded packets |
| A | 0 | 199 | 13 |
| B | 0 | 199 | 13 |
| C | 0 | 198 | 14 |
| D | 0 | 199 | 17 |
| Quadrant | Total seconds | Saturated seconds | Saturation percentage |
|---|---|---|---|
| A | 9065 | 6 | 0.066189% |
| B | 9038 | 339 | 3.750830% |
| C | 9049 | 60 | 0.663057% |
| D | 8901 | 746 | 8.381081% |
Noise dominated data is calculated using 1-second bins in cleaned event files. If a bin has >2000 counts, and if more than 50% of those come from <1% of pixels, then it is considered to be noise-dominated and hence unusable.
| Quadrant | # 1 sec bins | Bins with >0 counts | Bins with >2000 counts | High rate bins dominated by noise | Noise dominated (total time) | Noise dominated (detector-on time) | Marked lightcurve |
|---|---|---|---|---|---|---|---|
| A | 11091 | 9233 | 0 | 0 | 0.00% | 0.00% | 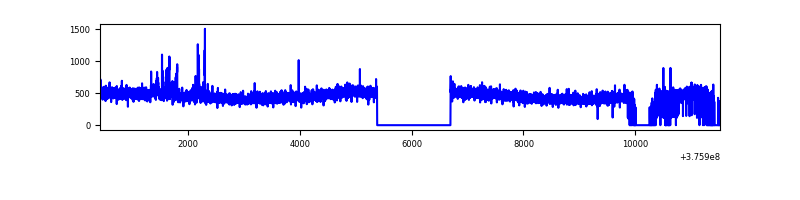 |
| B | 10987 | 9179 | 224 | 224 | 2.04% | 2.44% | 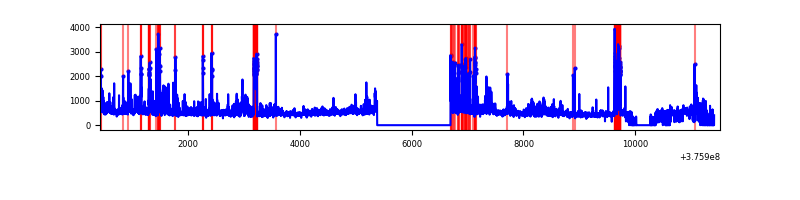 |
| C | 11081 | 9204 | 47 | 47 | 0.42% | 0.51% | 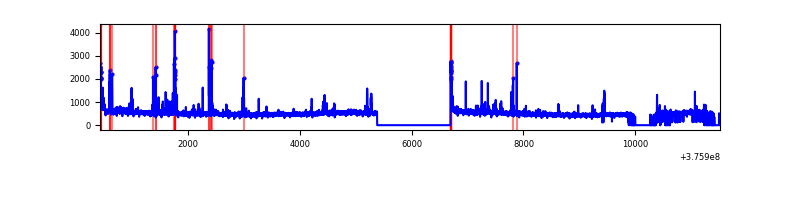 |
| D | 10980 | 9035 | 689 | 689 | 6.28% | 7.63% | 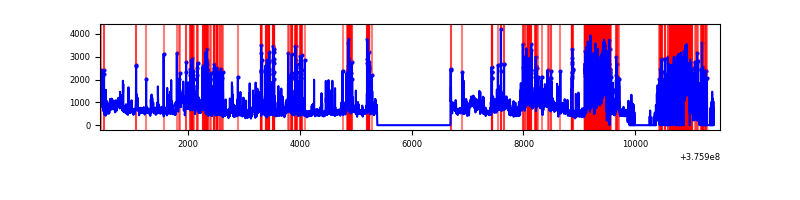 |
Top three noisy pixels from each quadrant. If the there are fewer than three noisy pixels in the level2.evt file, extra rows are filled as -1
| Pixel properties | Quadrant properties | ||||||
|---|---|---|---|---|---|---|---|
| Quadrant | DetID | PixID | Counts | Sigma | Mean | Median | Sigma |
| A | 15 | 174 | 54455 | 248.12 | 1062 | 1039 | 215.3 |
| A | 7 | 16 | 18894 | 82.94 | 1062 | 1039 | 215.3 |
| A | 13 | 254 | 14060 | 60.48 | 1062 | 1039 | 215.3 |
| B | 5 | 172 | 780073 | 3915.12 | 1041 | 1014 | 199.0 |
| B | 0 | 219 | 586058 | 2940.11 | 1041 | 1014 | 199.0 |
| B | 5 | 200 | 84740 | 420.76 | 1041 | 1014 | 199.0 |
| C | 15 | 214 | 386682 | 1628.52 | 1027 | 1036 | 236.8 |
| C | 0 | 10 | 131029 | 548.94 | 1027 | 1036 | 236.8 |
| C | 15 | 208 | 110317 | 461.48 | 1027 | 1036 | 236.8 |
| D | 8 | 195 | 1703164 | 6997.24 | 978 | 953 | 243.3 |
| D | 2 | 250 | 1678032 | 6893.93 | 978 | 953 | 243.3 |
| D | 12 | 218 | 468519 | 1922.01 | 978 | 953 | 243.3 |
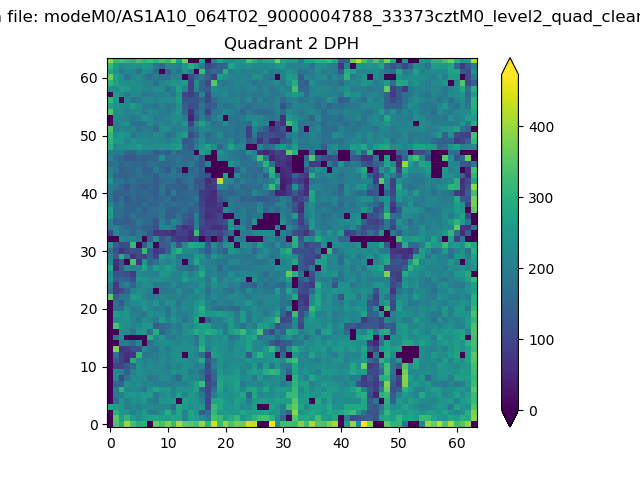
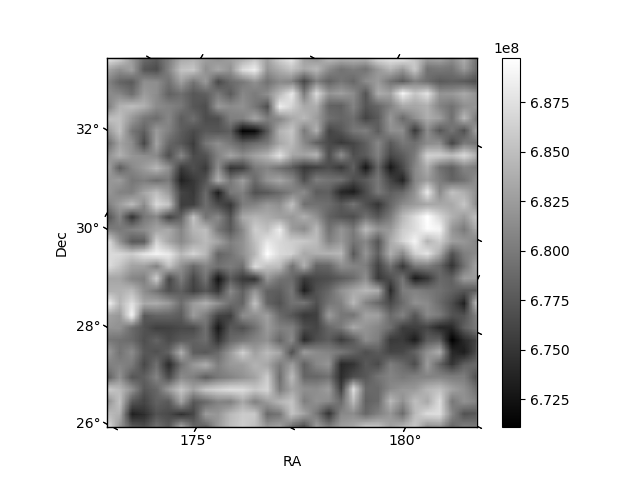
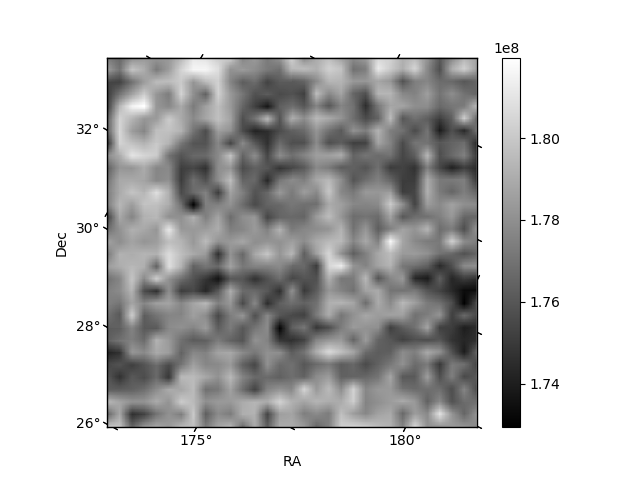
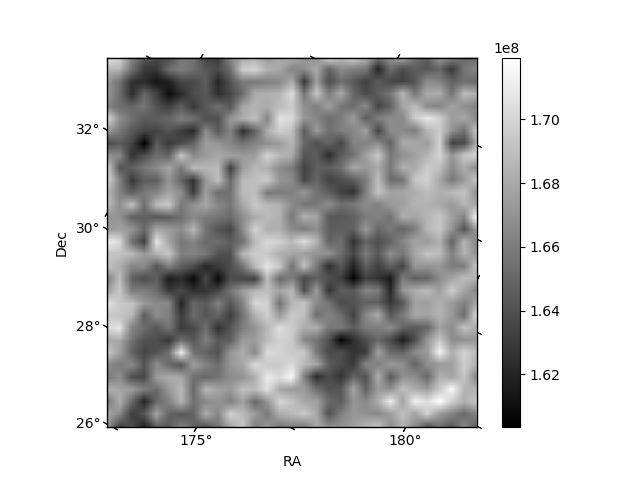
Histogram calculated using DETX and DETY for each event in the final _common_clean file
| Quadrant A | 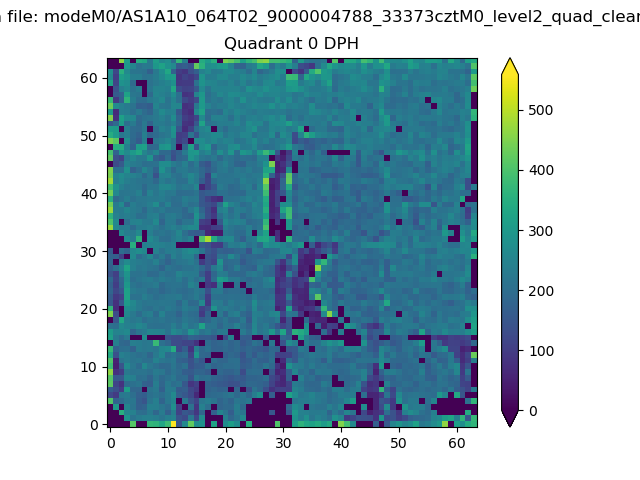 |
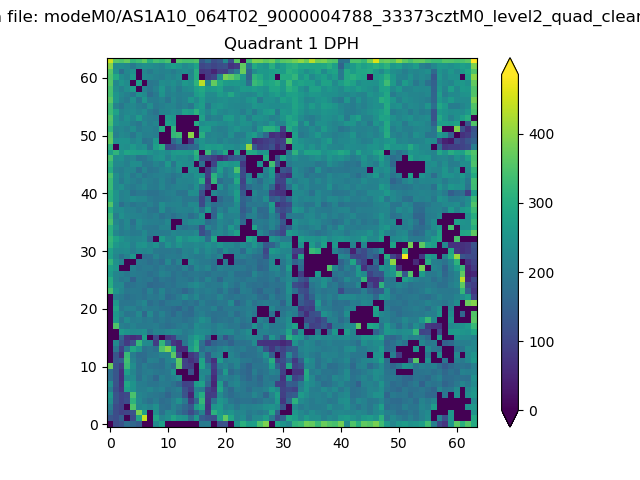 |
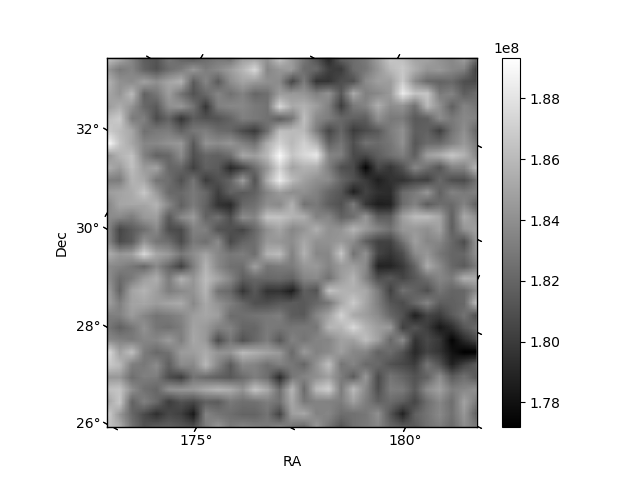
Quadrant B |
|---|---|---|---|
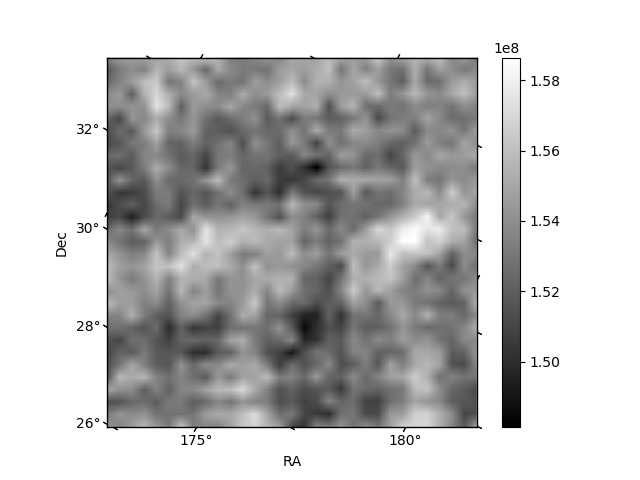
| Quadrant D | 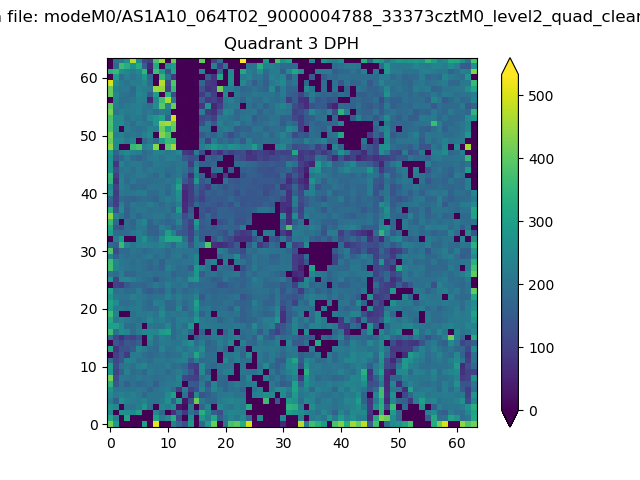 |
 |
Quadrant C |
| Plot type | Count rate plots | Images |
|---|---|---|
| Comparison with Poisson distribution Blue bars denote a histogram of data divided into 1 sec bins. Red curve is a Poisson curve with rate = median count rate of data. |
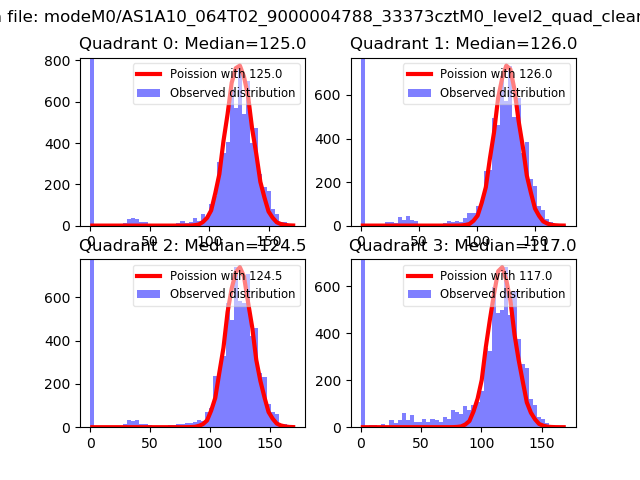 |
 |
| Quadrant-wise count rates Data is divided into 100 sec bins |
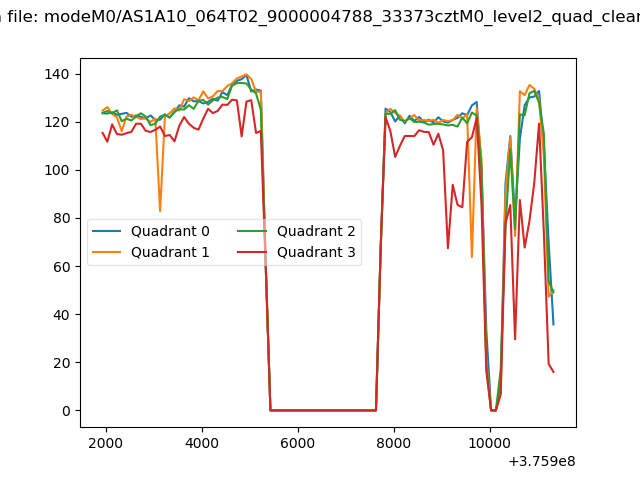 |
|
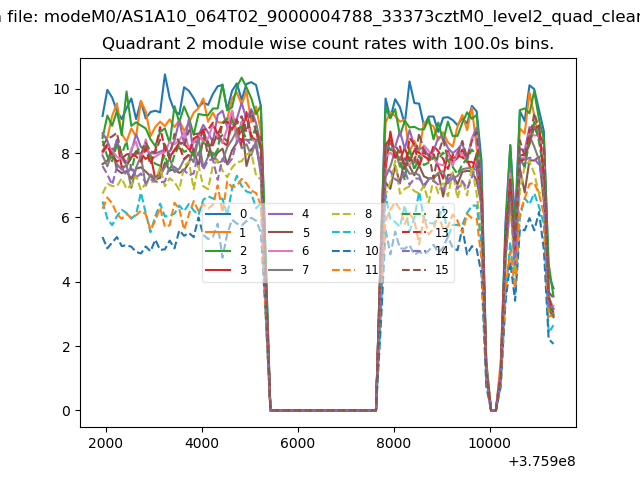
| Module-wise count rates for Quadrant A Data is divided into 100 sec bins |
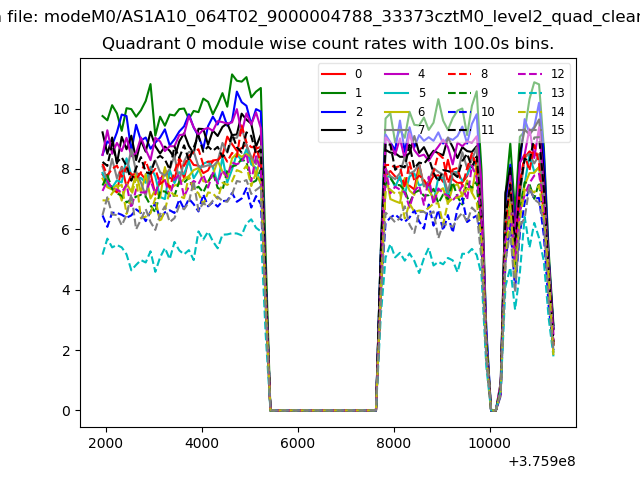 |
 |
| Module-wise count rates for Quadrant B Data is divided into 100 sec bins |
 |
 |
| Module-wise count rates for Quadrant C Data is divided into 100 sec bins |
 |
 |
| Module-wise count rates for Quadrant D Data is divided into 100 sec bins |
 |
 |
| Parameter | Plot |
|---|---|
| CZT HV Monitor | 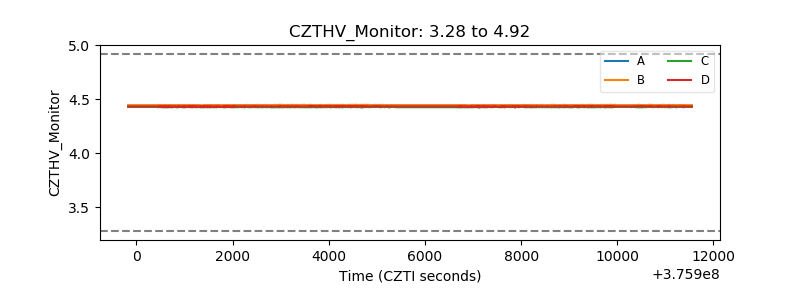 |
| D_VDD | 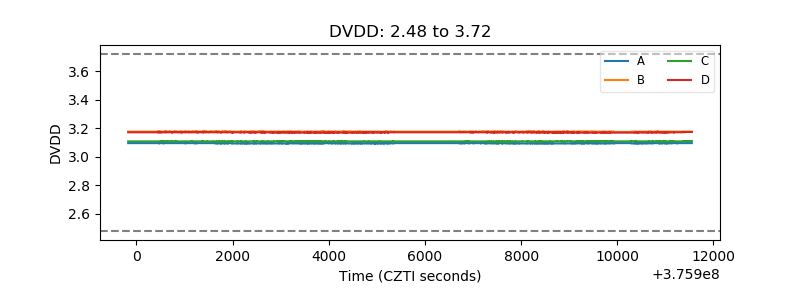 |
| Temperature 1 | 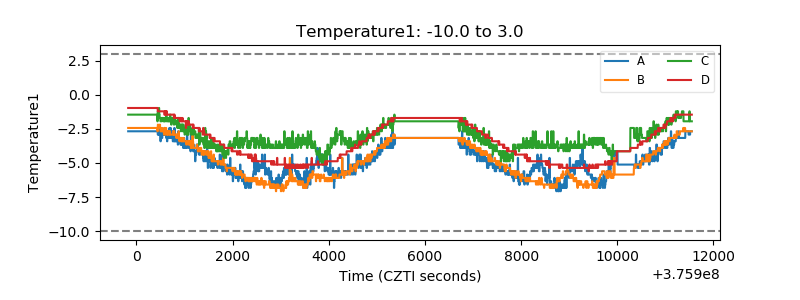 |
| Veto HV Monitor | 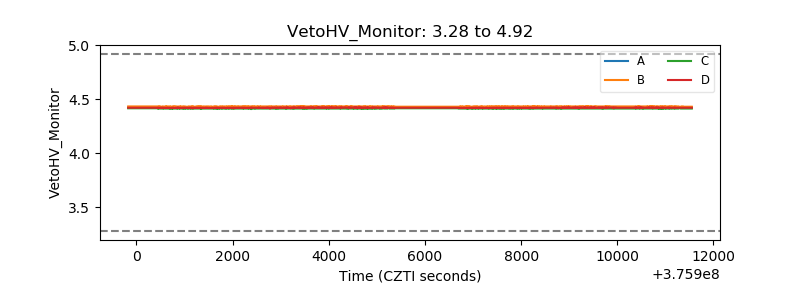 |
| Veto LLD | 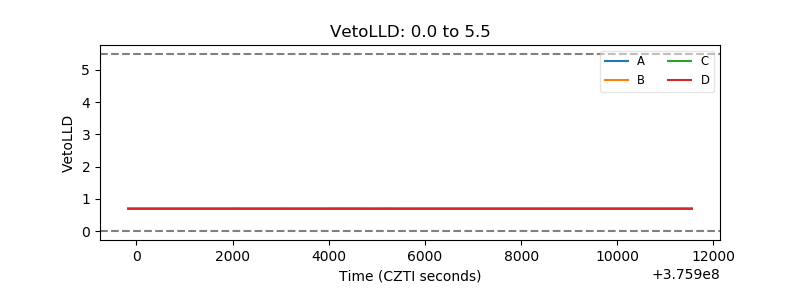 |
| Alpha Counter | 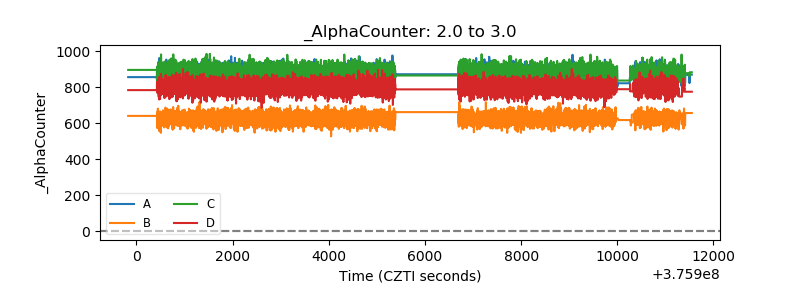 |
| _CPM_Rate | 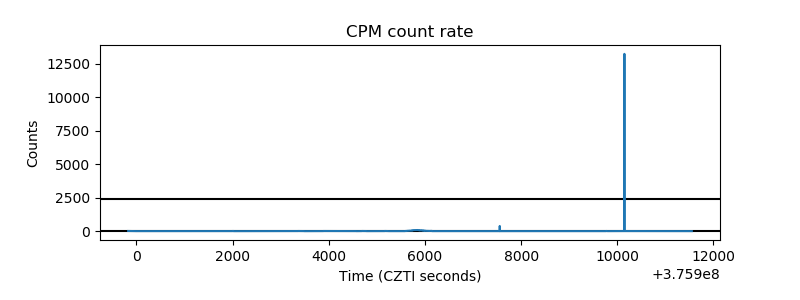 |
| CZT Counter | 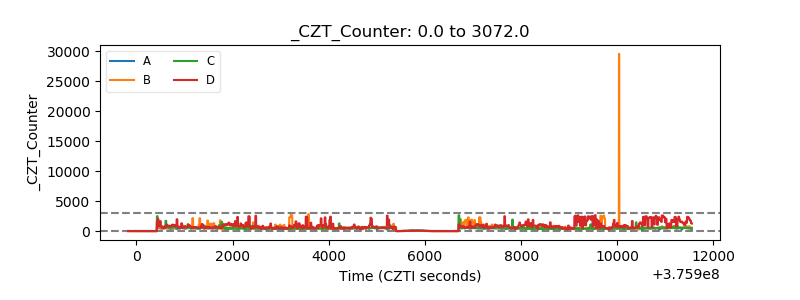 |
| +2.5 Volts monitor | 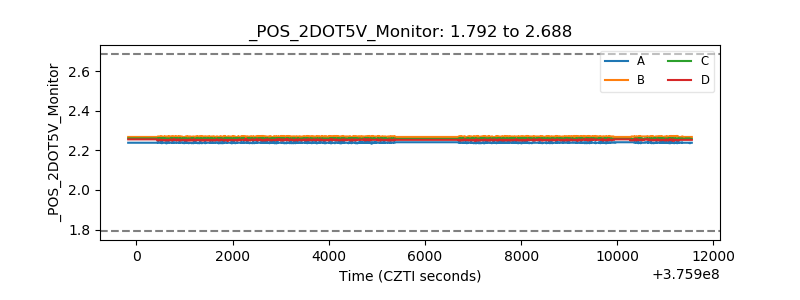 |
| +5 Volts monitor | 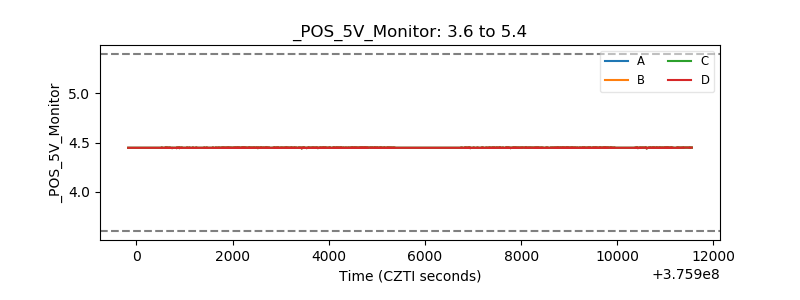 |
| _ROLL_ROT |  |
| _Roll_DEC | 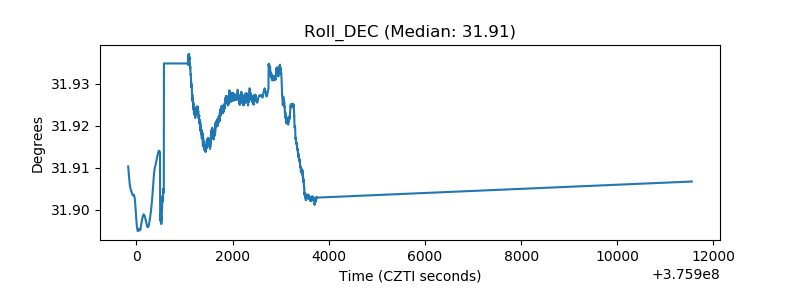 |
| _Roll_RA | 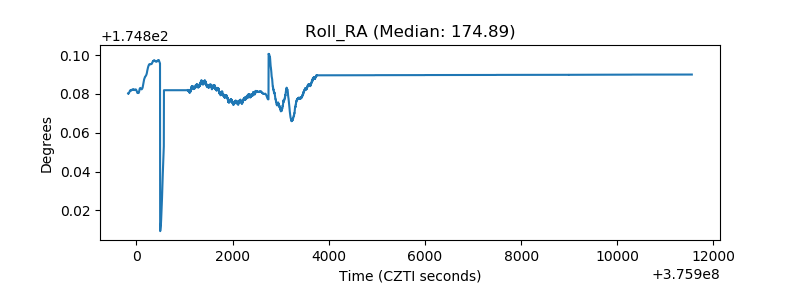 |
| Veto Counter | 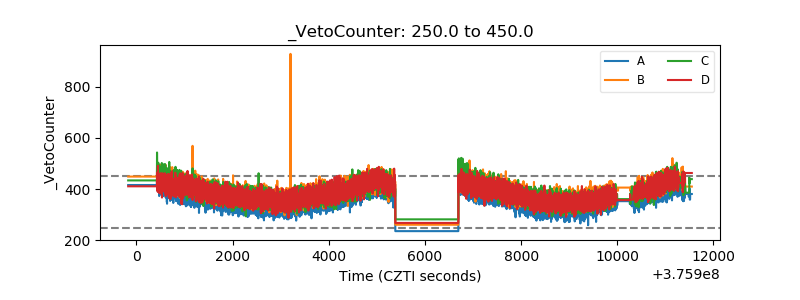 |