| Param | Original file | Final file |
|---|---|---|
| Filename | modeM0/AS1A10_064T02_9000004788_33374cztM0_level2.evt | modeM0/AS1A10_064T02_9000004788_33374cztM0_level2_quad_clean.evt |
| Size (bytes) | 567,950,400 | 91,333,440 |
| Size | 541.6 MB | 87.1 MB |
| Events in quadrant A | 2,874,671 | 601,613 |
| Events in quadrant B | 3,805,803 | 604,276 |
| Events in quadrant C | 3,329,262 | 595,912 |
| Events in quadrant D | 6,770,902 | 531,020 |
| Mode M9 | |||
|---|---|---|---|
| Quadrant | BADHDUFLAG | Total packets | Discarded packets |
| A | 0 | 30 | 0 |
| B | 0 | 30 | 0 |
| C | 0 | 30 | 0 |
| D | 0 | 30 | 0 |
| Mode M0 | |||
|---|---|---|---|
| Quadrant | BADHDUFLAG | Total packets | Discarded packets |
| A | 0 | 12519 | 3 |
| B | 0 | 15441 | 2 |
| C | 0 | 13636 | 2 |
| D | 0 | 24533 | 2 |
| Mode SS | |||
|---|---|---|---|
| Quadrant | BADHDUFLAG | Total packets | Discarded packets |
| A | 0 | 128 | 0 |
| B | 0 | 128 | 0 |
| C | 0 | 128 | 0 |
| D | 0 | 128 | 0 |
| Quadrant | Total seconds | Saturated seconds | Saturation percentage |
|---|---|---|---|
| A | 6201 | 8 | 0.129011% |
| B | 6201 | 70 | 1.128850% |
| C | 6201 | 57 | 0.919207% |
| D | 6201 | 748 | 12.062571% |
Noise dominated data is calculated using 1-second bins in cleaned event files. If a bin has >2000 counts, and if more than 50% of those come from <1% of pixels, then it is considered to be noise-dominated and hence unusable.
| Quadrant | # 1 sec bins | Bins with >0 counts | Bins with >2000 counts | High rate bins dominated by noise | Noise dominated (total time) | Noise dominated (detector-on time) | Marked lightcurve |
|---|---|---|---|---|---|---|---|
| A | 9126 | 6203 | 0 | 0 | 0.00% | 0.00% |  |
| B | 9126 | 6203 | 11 | 11 | 0.12% | 0.18% |  |
| C | 9126 | 6203 | 42 | 42 | 0.46% | 0.68% |  |
| D | 9126 | 6203 | 622 | 622 | 6.82% | 10.03% |  |
Top three noisy pixels from each quadrant. If the there are fewer than three noisy pixels in the level2.evt file, extra rows are filled as -1
| Pixel properties | Quadrant properties | ||||||
|---|---|---|---|---|---|---|---|
| Quadrant | DetID | PixID | Counts | Sigma | Mean | Median | Sigma |
| A | 13 | 6 | 10904 | 68.43 | 740 | 725 | 148.7 |
| A | 13 | 254 | 10003 | 62.38 | 740 | 725 | 148.7 |
| A | 3 | 137 | 7469 | 45.34 | 740 | 725 | 148.7 |
| B | 0 | 219 | 722652 | 5088.56 | 736 | 718 | 141.9 |
| B | 4 | 170 | 49606 | 344.59 | 736 | 718 | 141.9 |
| B | 5 | 200 | 27369 | 187.85 | 736 | 718 | 141.9 |
| C | 15 | 214 | 268454 | 1604.85 | 716 | 722 | 166.8 |
| C | 0 | 10 | 147896 | 882.19 | 716 | 722 | 166.8 |
| C | 14 | 254 | 70866 | 420.46 | 716 | 722 | 166.8 |
| D | 8 | 195 | 1477437 | 8610.85 | 688 | 668 | 171.5 |
| D | 2 | 250 | 1038643 | 6052.3 | 688 | 668 | 171.5 |
| D | 12 | 6 | 461012 | 2684.21 | 688 | 668 | 171.5 |
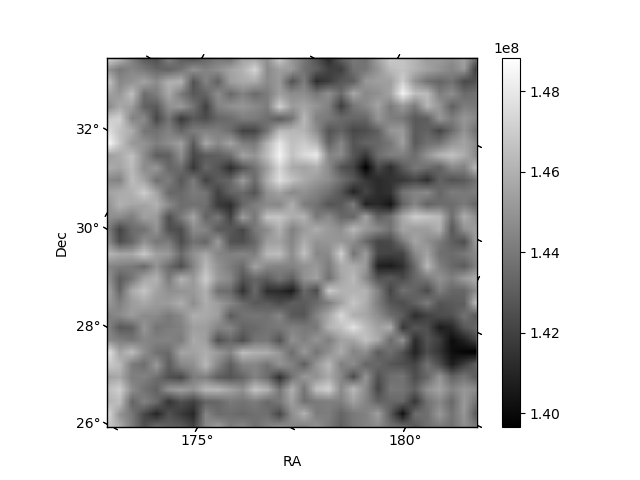
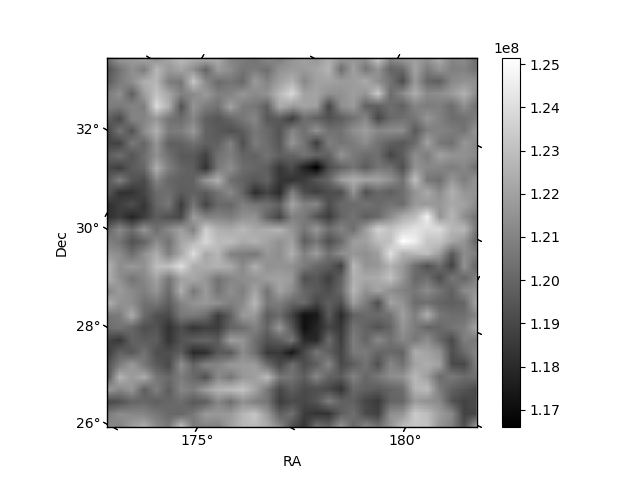
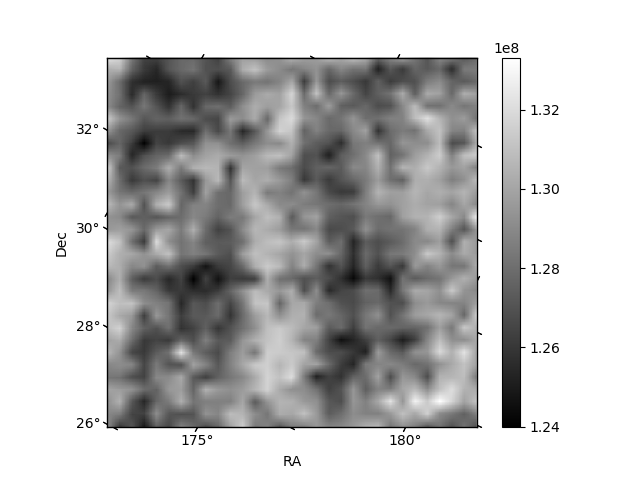
Histogram calculated using DETX and DETY for each event in the final _common_clean file
| Quadrant A | 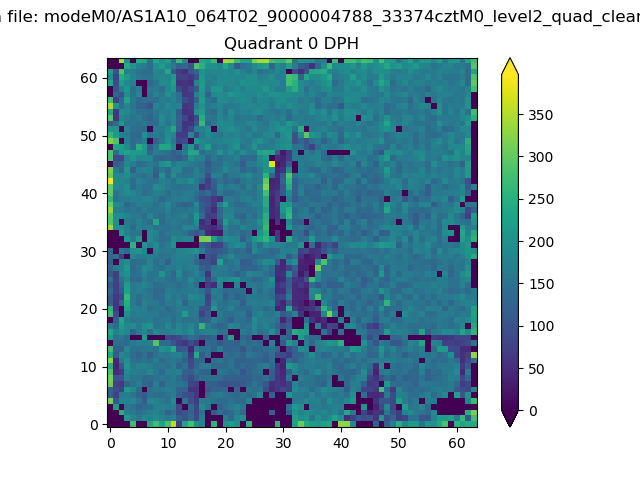 |
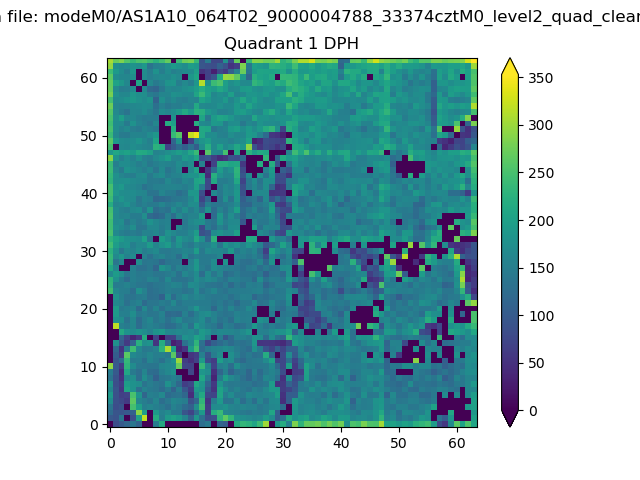 |
Quadrant B |
|---|---|---|---|
| Quadrant D | 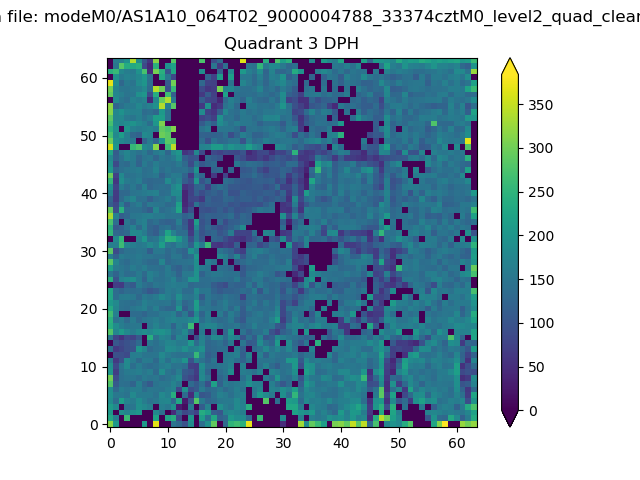 |
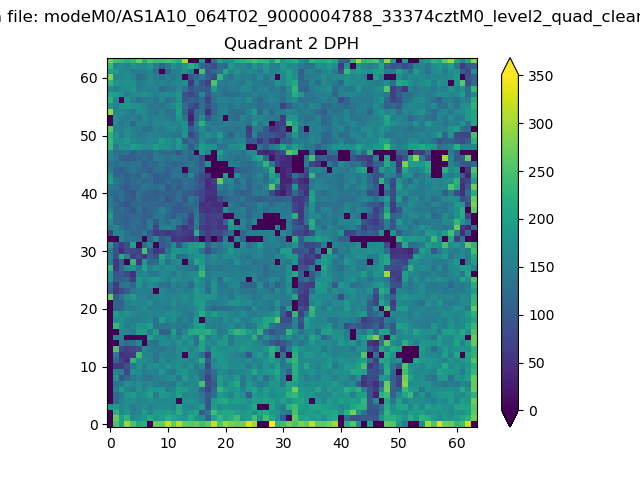 |
Quadrant C |
| Plot type | Count rate plots | Images |
|---|---|---|
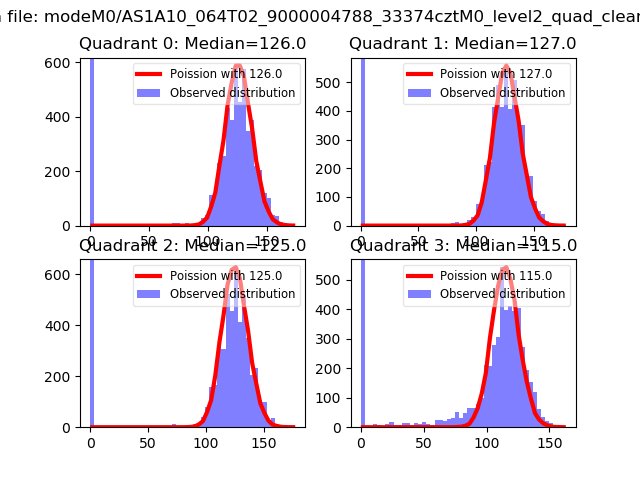
| Comparison with Poisson distribution Blue bars denote a histogram of data divided into 1 sec bins. Red curve is a Poisson curve with rate = median count rate of data. |
 |
 |
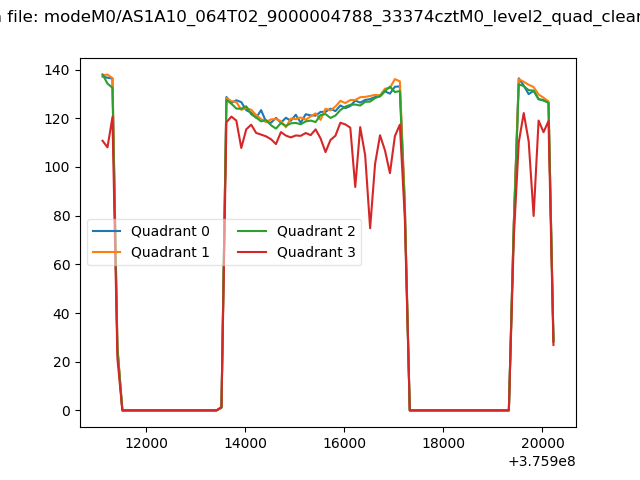
| Quadrant-wise count rates Data is divided into 100 sec bins |
 |
|
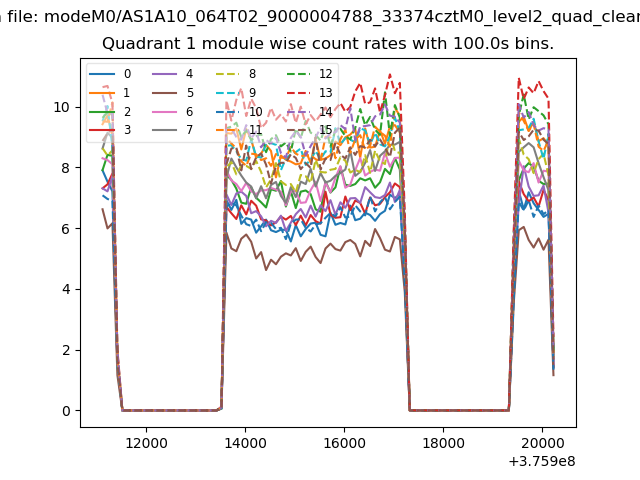
| Module-wise count rates for Quadrant A Data is divided into 100 sec bins |
 |
 |
| Module-wise count rates for Quadrant B Data is divided into 100 sec bins |
 |
 |
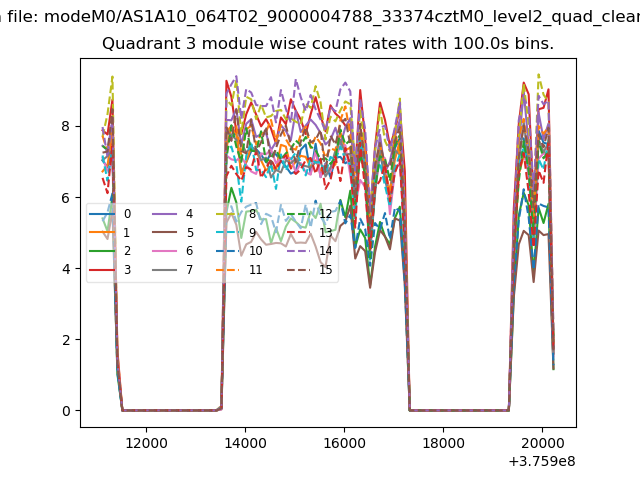
| Module-wise count rates for Quadrant C Data is divided into 100 sec bins |
 |
 |
| Module-wise count rates for Quadrant D Data is divided into 100 sec bins |
 |
 |
| Parameter | Plot |
|---|---|
| CZT HV Monitor | 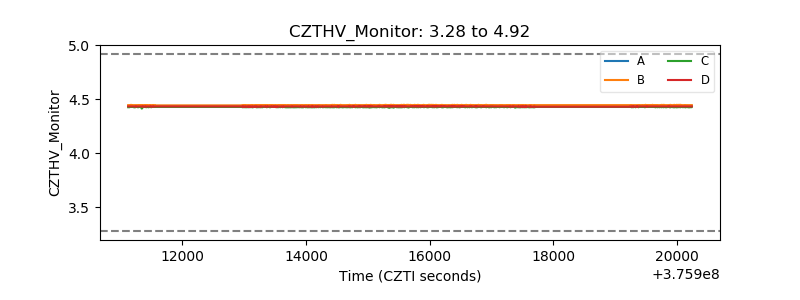 |
| D_VDD | 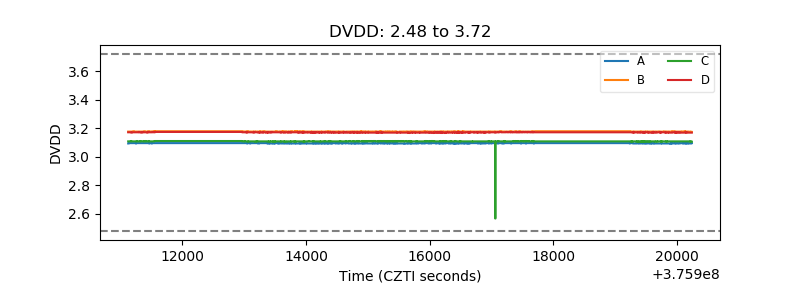 |
| Temperature 1 | 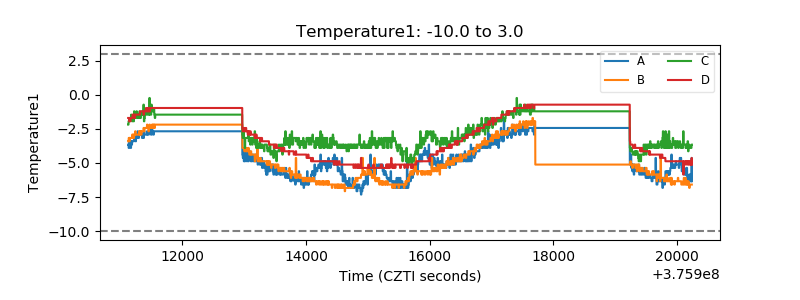 |
| Veto HV Monitor |  |
| Veto LLD | 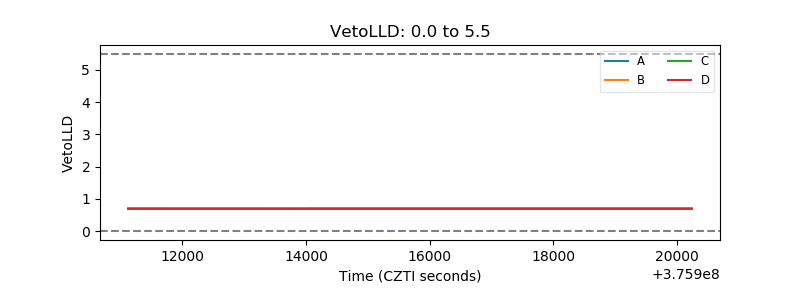 |
| Alpha Counter | 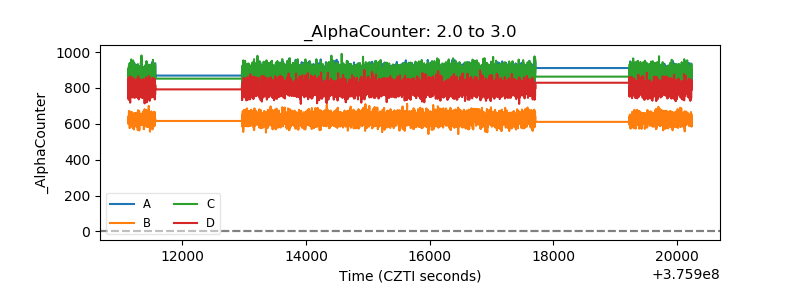 |
| _CPM_Rate | 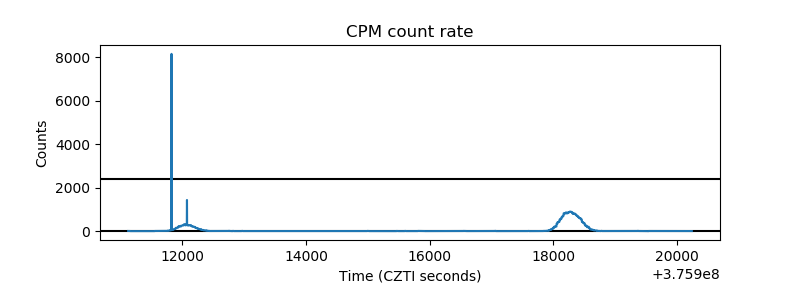 |
| CZT Counter | 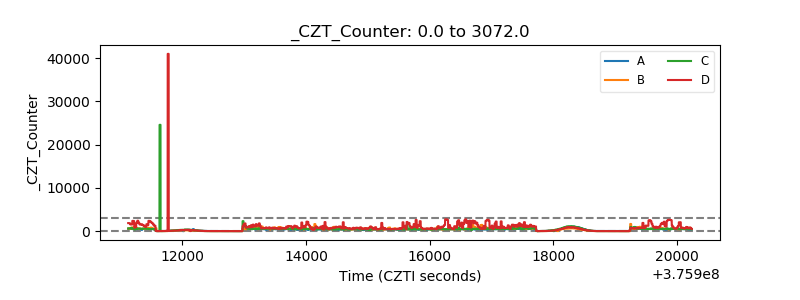 |
| +2.5 Volts monitor | 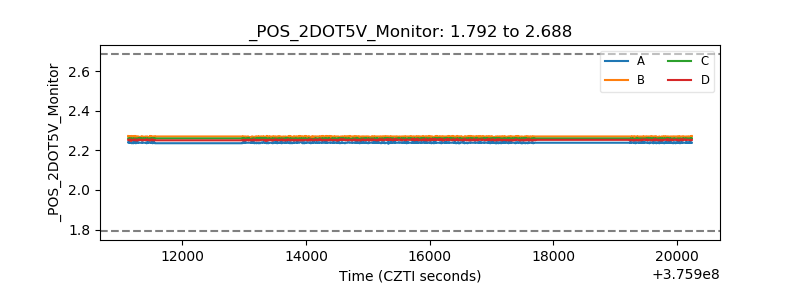 |
| +5 Volts monitor | 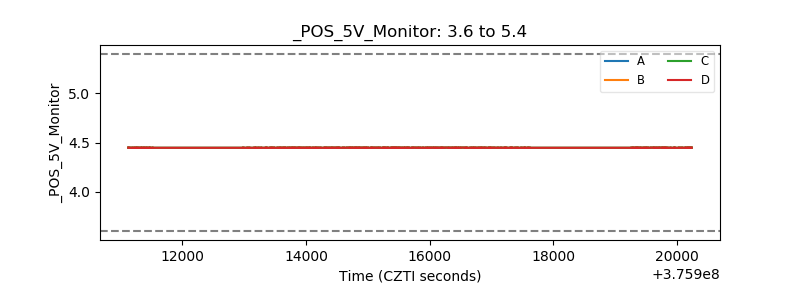 |
| _ROLL_ROT | 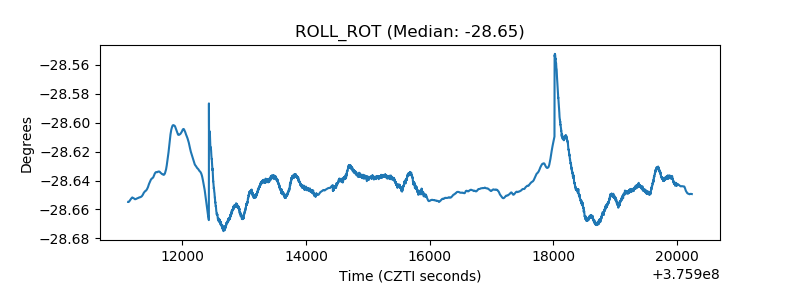 |
| _Roll_DEC |  |
| _Roll_RA | 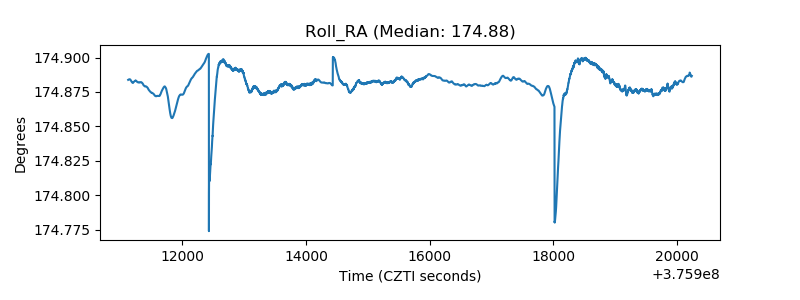 |
| Veto Counter |  |