| Param | Original file | Final file |
|---|---|---|
| Filename | modeM0/AS1A10_064T02_9000004788_33378cztM0_level2.evt | modeM0/AS1A10_064T02_9000004788_33378cztM0_level2_quad_clean.evt |
| Size (bytes) | 2,483,663,040 | 431,328,960 |
| Size | 2.3 GB | 411.3 MB |
| Events in quadrant A | 13,490,133 | 2,849,968 |
| Events in quadrant B | 16,903,716 | 2,868,799 |
| Events in quadrant C | 15,073,067 | 2,825,418 |
| Events in quadrant D | 27,834,707 | 2,562,525 |
| Mode M9 | |||
|---|---|---|---|
| Quadrant | BADHDUFLAG | Total packets | Discarded packets |
| A | 0 | 96 | 0 |
| B | 0 | 96 | 0 |
| C | 0 | 96 | 0 |
| D | 0 | 96 | 0 |
| Mode M0 | |||
|---|---|---|---|
| Quadrant | BADHDUFLAG | Total packets | Discarded packets |
| A | 0 | 58908 | 7 |
| B | 0 | 68849 | 6 |
| C | 0 | 61727 | 6 |
| D | 0 | 102527 | 6 |
| Mode SS | |||
|---|---|---|---|
| Quadrant | BADHDUFLAG | Total packets | Discarded packets |
| A | 0 | 582 | 0 |
| B | 0 | 582 | 0 |
| C | 0 | 582 | 0 |
| D | 0 | 582 | 0 |
| Quadrant | Total seconds | Saturated seconds | Saturation percentage |
|---|---|---|---|
| A | 28476 | 35 | 0.122911% |
| B | 28476 | 698 | 2.451187% |
| C | 28476 | 159 | 0.558365% |
| D | 28476 | 2658 | 9.334176% |
Noise dominated data is calculated using 1-second bins in cleaned event files. If a bin has >2000 counts, and if more than 50% of those come from <1% of pixels, then it is considered to be noise-dominated and hence unusable.
| Quadrant | # 1 sec bins | Bins with >0 counts | Bins with >2000 counts | High rate bins dominated by noise | Noise dominated (total time) | Noise dominated (detector-on time) | Marked lightcurve |
|---|---|---|---|---|---|---|---|
| A | 38094 | 28482 | 11 | 11 | 0.03% | 0.04% | 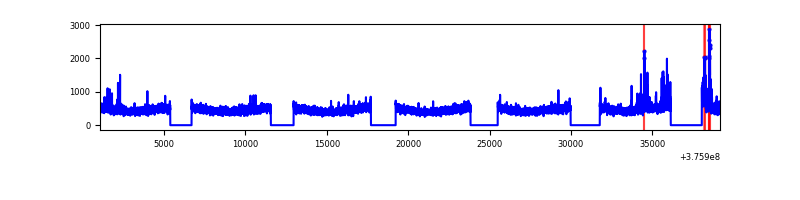 |
| B | 38094 | 28482 | 401 | 401 | 1.05% | 1.41% | 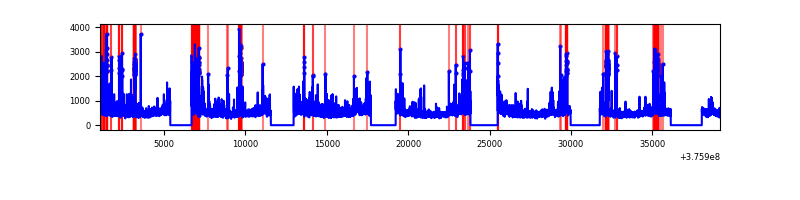 |
| C | 38094 | 28482 | 118 | 118 | 0.31% | 0.41% | 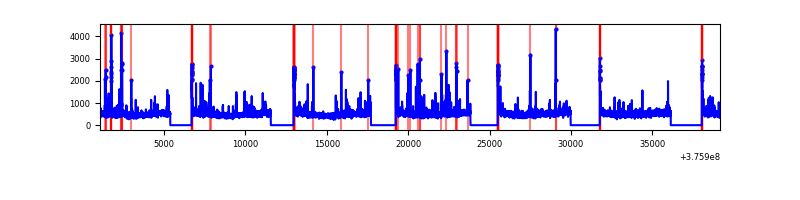 |
| D | 38094 | 28482 | 2364 | 2364 | 6.21% | 8.30% | 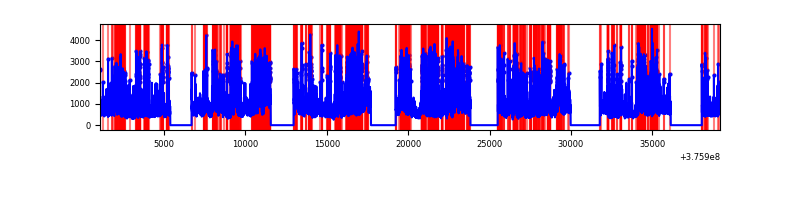 |
Top three noisy pixels from each quadrant. If the there are fewer than three noisy pixels in the level2.evt file, extra rows are filled as -1
| Pixel properties | Quadrant properties | ||||||
|---|---|---|---|---|---|---|---|
| Quadrant | DetID | PixID | Counts | Sigma | Mean | Median | Sigma |
| A | 12 | 16 | 352133 | 521.04 | 3361 | 3295 | 669.5 |
| A | 12 | 194 | 73057 | 104.2 | 3361 | 3295 | 669.5 |
| A | 15 | 174 | 58062 | 81.8 | 3361 | 3295 | 669.5 |
| B | 0 | 219 | 1914119 | 3012.64 | 3328 | 3238 | 634.3 |
| B | 5 | 172 | 1223406 | 1923.68 | 3328 | 3238 | 634.3 |
| B | 4 | 170 | 143933 | 221.82 | 3328 | 3238 | 634.3 |
| C | 15 | 214 | 1219231 | 1640.49 | 3246 | 3279 | 741.2 |
| C | 0 | 10 | 436108 | 583.95 | 3246 | 3279 | 741.2 |
| C | 15 | 208 | 292557 | 390.28 | 3246 | 3279 | 741.2 |
| D | 8 | 195 | 5125256 | 6698.59 | 3140 | 3053 | 764.7 |
| D | 2 | 250 | 4997916 | 6532.06 | 3140 | 3053 | 764.7 |
| D | 12 | 218 | 1613051 | 2105.48 | 3140 | 3053 | 764.7 |
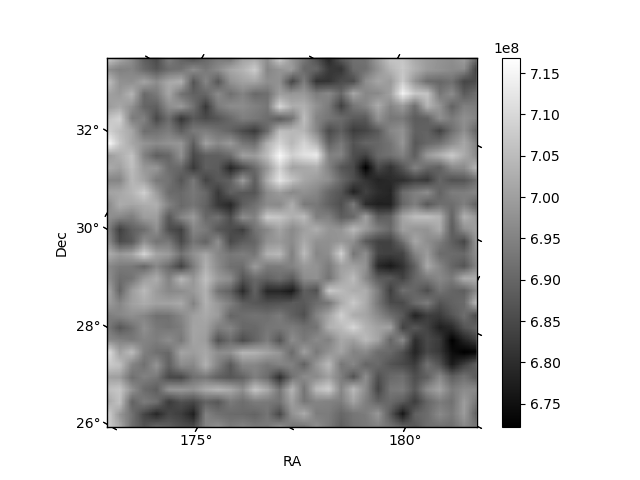
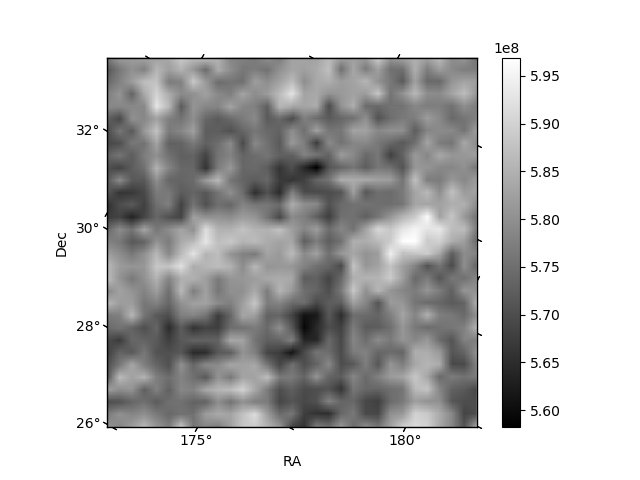
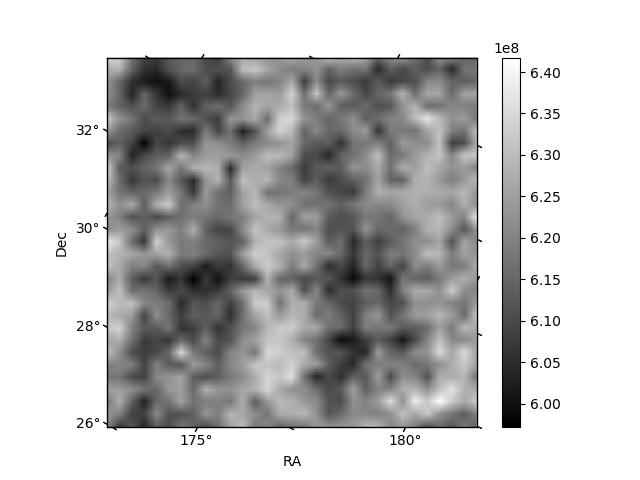
Histogram calculated using DETX and DETY for each event in the final _common_clean file
| Quadrant A | 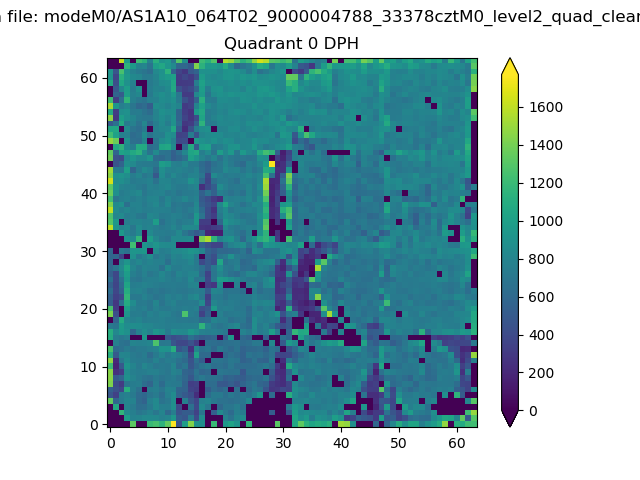 |
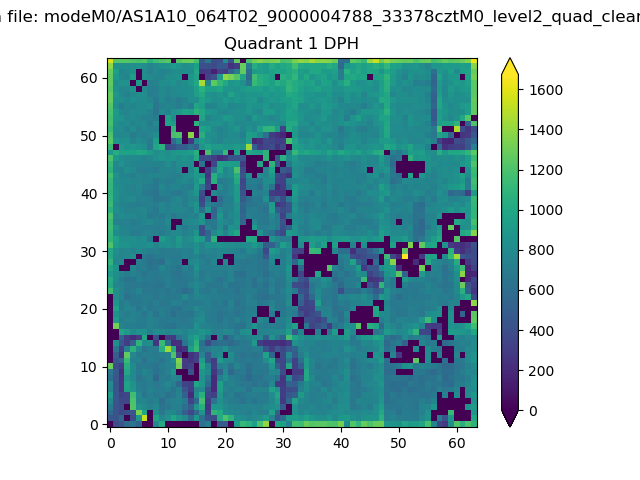 |
Quadrant B |
|---|---|---|---|
| Quadrant D | 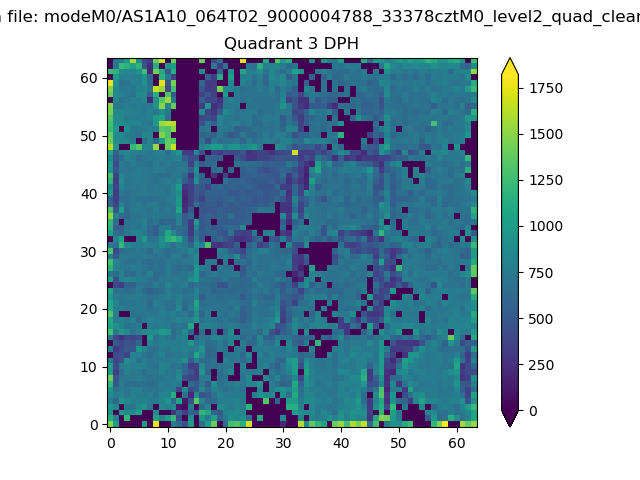 |
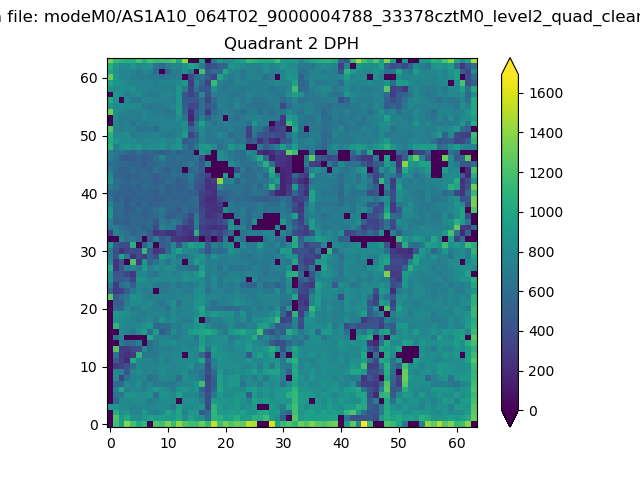 |
Quadrant C |
| Plot type | Count rate plots | Images |
|---|---|---|
| Comparison with Poisson distribution Blue bars denote a histogram of data divided into 1 sec bins. Red curve is a Poisson curve with rate = median count rate of data. |
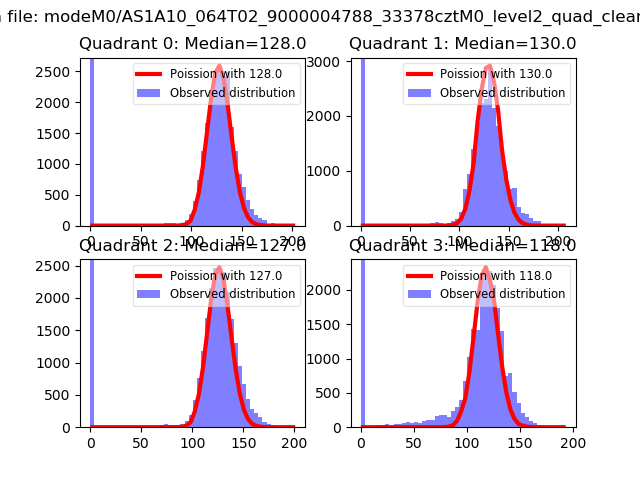 |
 |
| Quadrant-wise count rates Data is divided into 100 sec bins |
 |
|
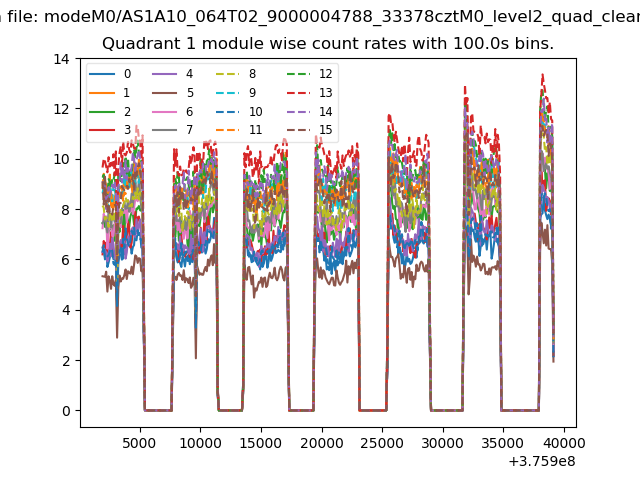
| Module-wise count rates for Quadrant A Data is divided into 100 sec bins |
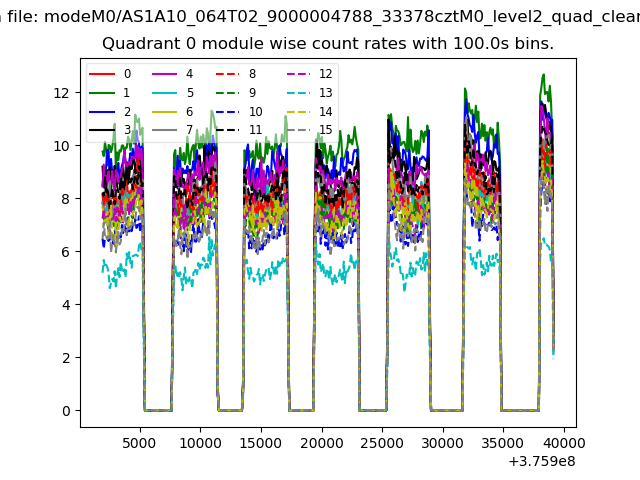 |
 |
| Module-wise count rates for Quadrant B Data is divided into 100 sec bins |
 |
 |
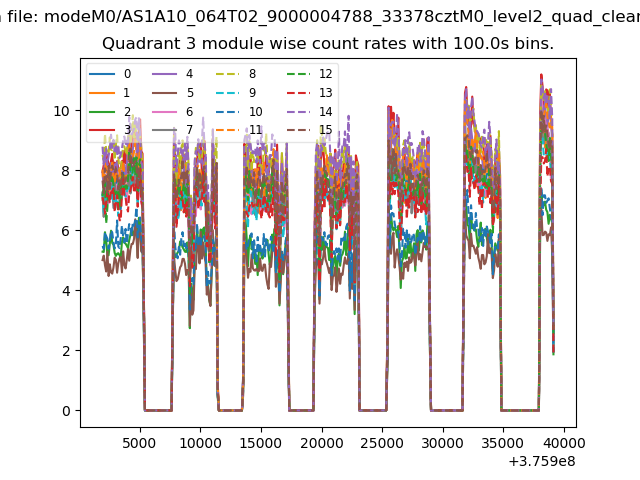
| Module-wise count rates for Quadrant C Data is divided into 100 sec bins |
 |
 |
| Module-wise count rates for Quadrant D Data is divided into 100 sec bins |
 |
 |
| Parameter | Plot |
|---|---|
| CZT HV Monitor | 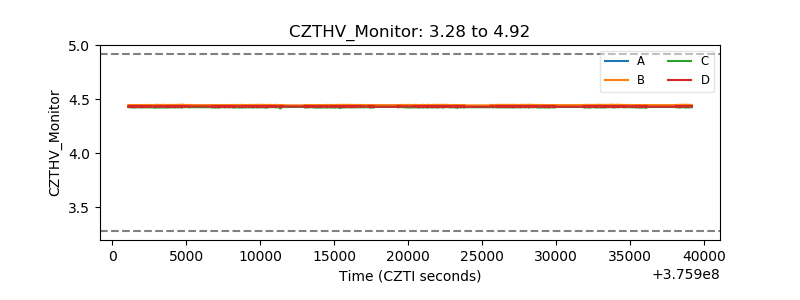 |
| D_VDD | 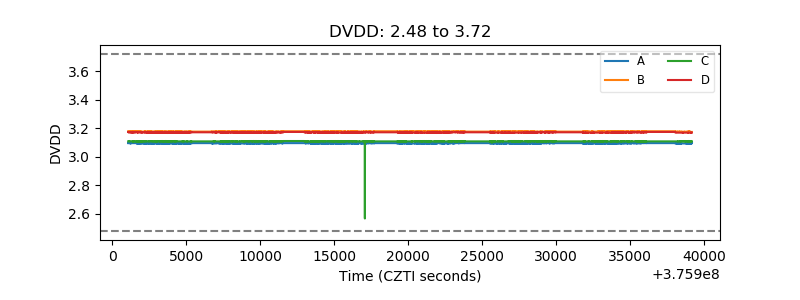 |
| Temperature 1 | 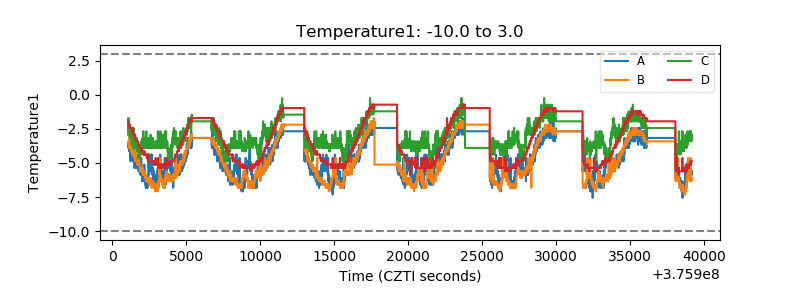 |
| Veto HV Monitor | 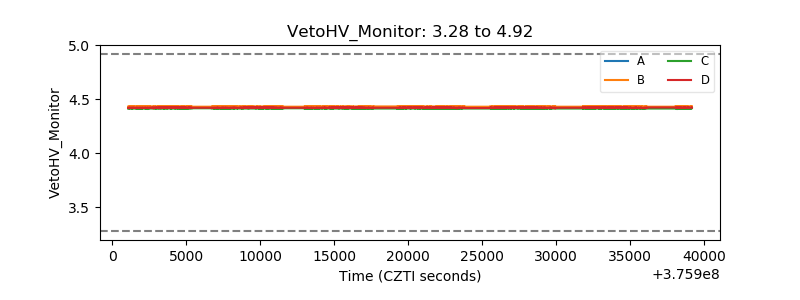 |
| Veto LLD | 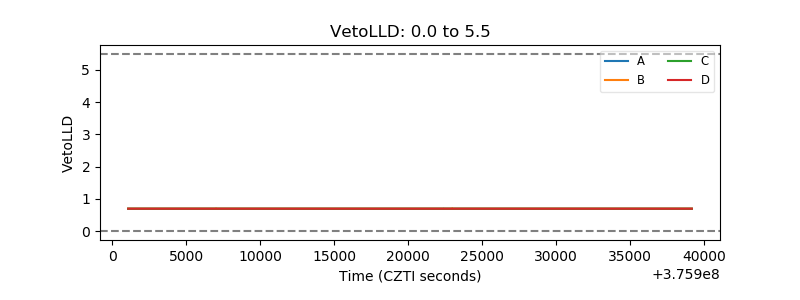 |
| Alpha Counter | 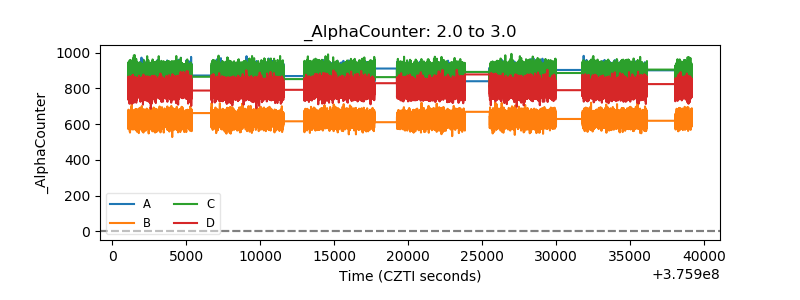 |
| _CPM_Rate | 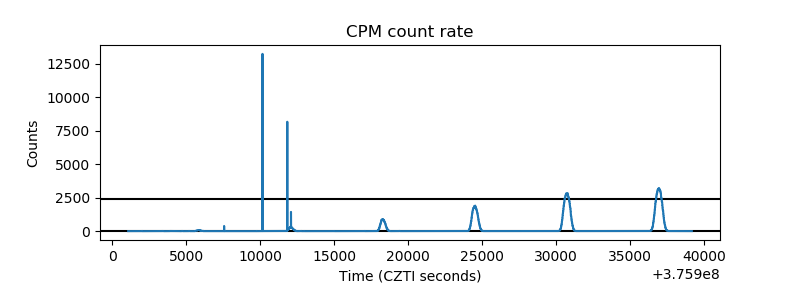 |
| CZT Counter | 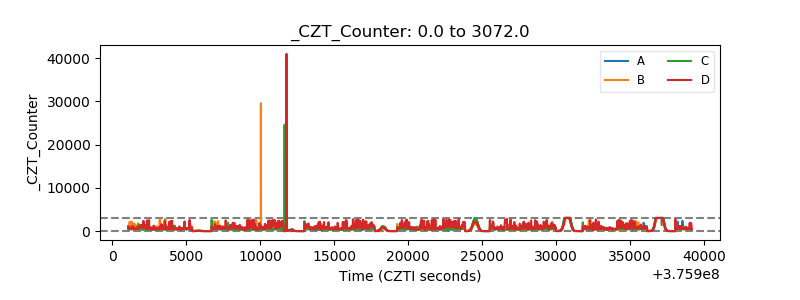 |
| +2.5 Volts monitor |  |
| +5 Volts monitor |  |
| _ROLL_ROT |  |
| _Roll_DEC | 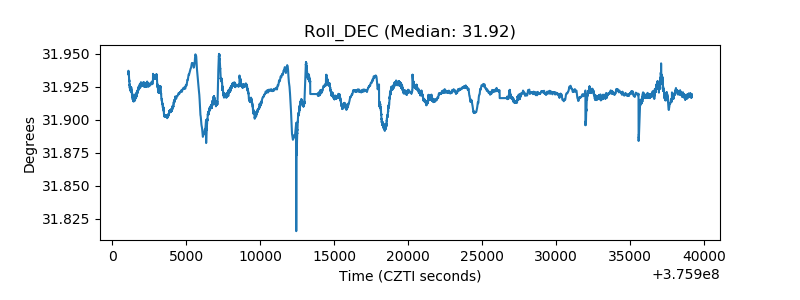 |
| _Roll_RA | 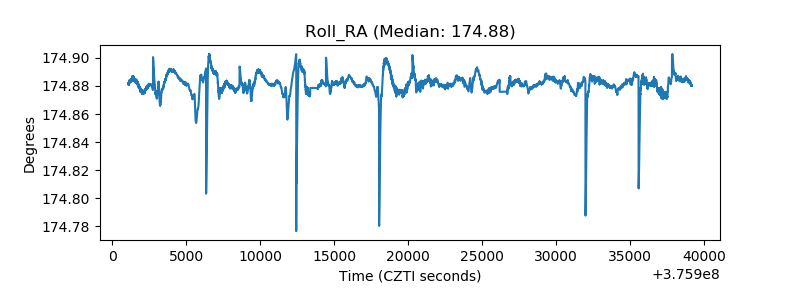 |
| Veto Counter | 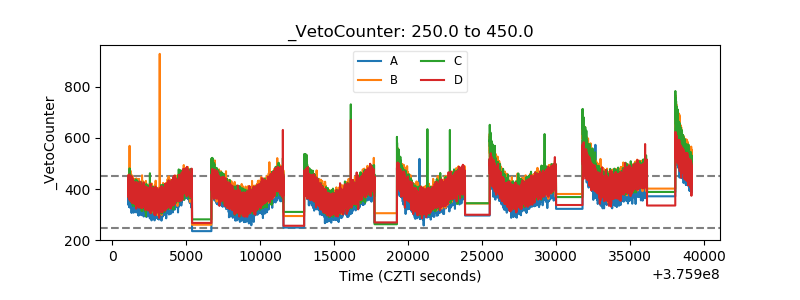 |