| Param | Original file | Final file |
|---|---|---|
| Filename | modeM0/AS1A10_064T02_9000004788_33380cztM0_level2.evt | modeM0/AS1A10_064T02_9000004788_33380cztM0_level2_quad_clean.evt |
| Size (bytes) | 437,414,400 | 72,639,360 |
| Size | 417.2 MB | 69.3 MB |
| Events in quadrant A | 2,535,690 | 470,047 |
| Events in quadrant B | 2,813,979 | 483,009 |
| Events in quadrant C | 3,036,613 | 458,592 |
| Events in quadrant D | 4,513,891 | 429,621 |
| Mode M9 | |||
|---|---|---|---|
| Quadrant | BADHDUFLAG | Total packets | Discarded packets |
| A | 0 | 22 | 0 |
| B | 0 | 22 | 0 |
| C | 0 | 22 | 0 |
| D | 0 | 23 | 0 |
| Mode M0 | |||
|---|---|---|---|
| Quadrant | BADHDUFLAG | Total packets | Discarded packets |
| A | 0 | 10439 | 3 |
| B | 0 | 11299 | 2 |
| C | 0 | 11970 | 2 |
| D | 0 | 17070 | 2 |
| Mode SS | |||
|---|---|---|---|
| Quadrant | BADHDUFLAG | Total packets | Discarded packets |
| A | 0 | 106 | 0 |
| B | 0 | 106 | 0 |
| C | 0 | 106 | 0 |
| D | 0 | 106 | 0 |
| Quadrant | Total seconds | Saturated seconds | Saturation percentage |
|---|---|---|---|
| A | 5108 | 7 | 0.137040% |
| B | 5108 | 36 | 0.704777% |
| C | 5108 | 56 | 1.096319% |
| D | 5108 | 266 | 5.207518% |
Noise dominated data is calculated using 1-second bins in cleaned event files. If a bin has >2000 counts, and if more than 50% of those come from <1% of pixels, then it is considered to be noise-dominated and hence unusable.
| Quadrant | # 1 sec bins | Bins with >0 counts | Bins with >2000 counts | High rate bins dominated by noise | Noise dominated (total time) | Noise dominated (detector-on time) | Marked lightcurve |
|---|---|---|---|---|---|---|---|
| A | 7230 | 5109 | 0 | 0 | 0.00% | 0.00% | 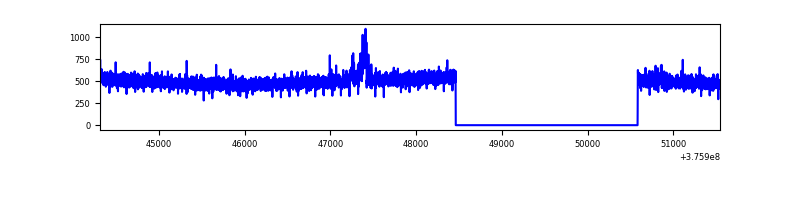 |
| B | 7230 | 5109 | 22 | 22 | 0.30% | 0.43% | 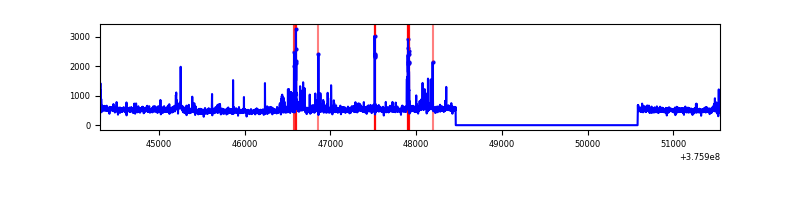 |
| C | 7230 | 5109 | 59 | 59 | 0.82% | 1.15% | 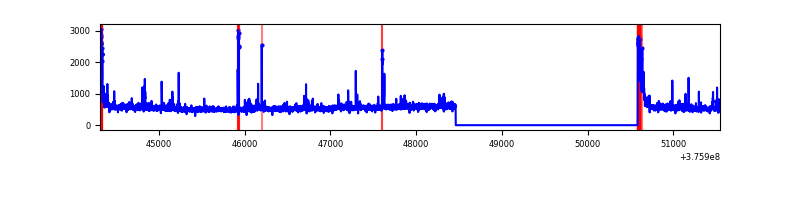 |
| D | 7230 | 5108 | 247 | 247 | 3.42% | 4.84% | 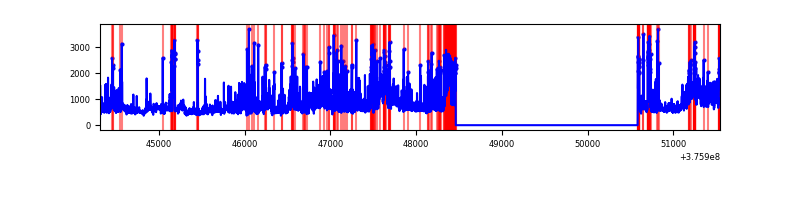 |
Top three noisy pixels from each quadrant. If the there are fewer than three noisy pixels in the level2.evt file, extra rows are filled as -1
| Pixel properties | Quadrant properties | ||||||
|---|---|---|---|---|---|---|---|
| Quadrant | DetID | PixID | Counts | Sigma | Mean | Median | Sigma |
| A | 15 | 169 | 30939 | 237.34 | 647 | 638 | 127.7 |
| A | 13 | 254 | 7993 | 57.61 | 647 | 638 | 127.7 |
| A | 3 | 137 | 5669 | 39.41 | 647 | 638 | 127.7 |
| B | 0 | 219 | 119807 | 981.08 | 643 | 628 | 121.5 |
| B | 5 | 172 | 95933 | 784.55 | 643 | 628 | 121.5 |
| B | 5 | 200 | 28553 | 229.88 | 643 | 628 | 121.5 |
| C | 15 | 214 | 223278 | 1566.05 | 623 | 630 | 142.2 |
| C | 0 | 10 | 215574 | 1511.87 | 623 | 630 | 142.2 |
| C | 15 | 208 | 88639 | 619.03 | 623 | 630 | 142.2 |
| D | 8 | 195 | 598784 | 3953.82 | 614 | 596 | 151.3 |
| D | 1 | 52 | 444783 | 2935.93 | 614 | 596 | 151.3 |
| D | 12 | 218 | 292679 | 1930.57 | 614 | 596 | 151.3 |
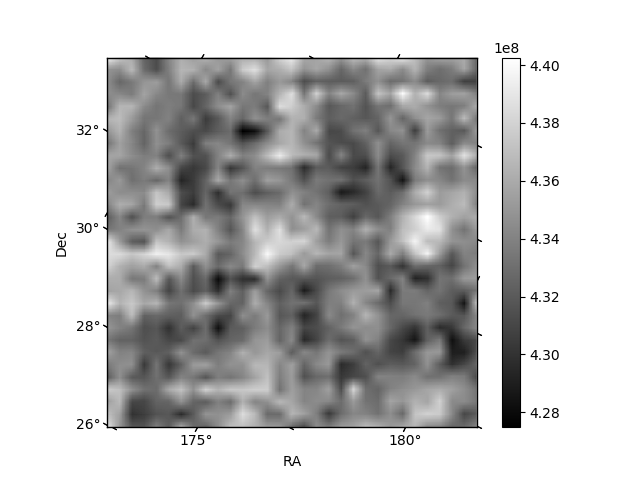
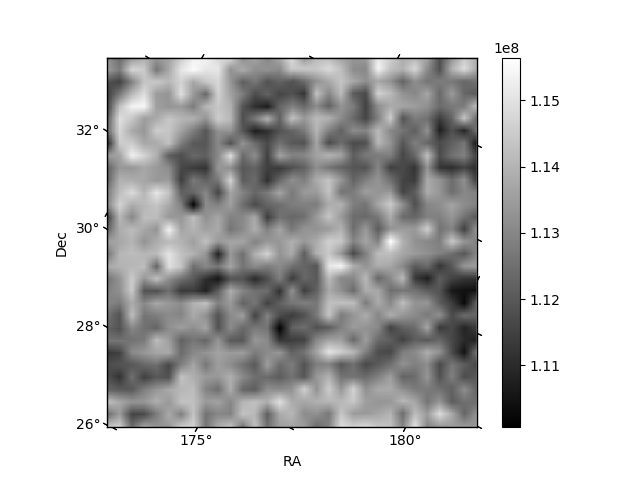
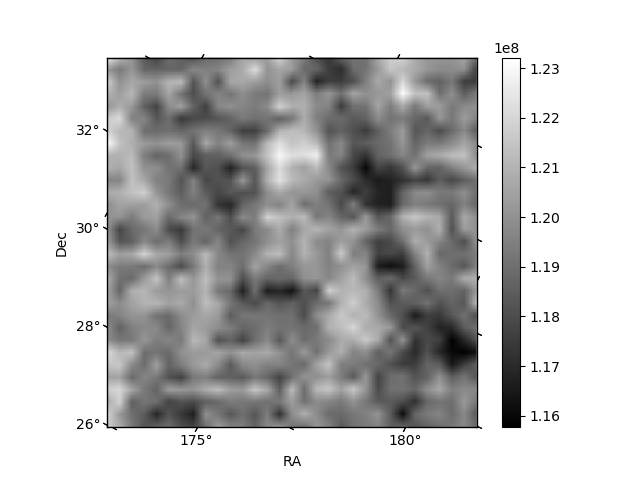
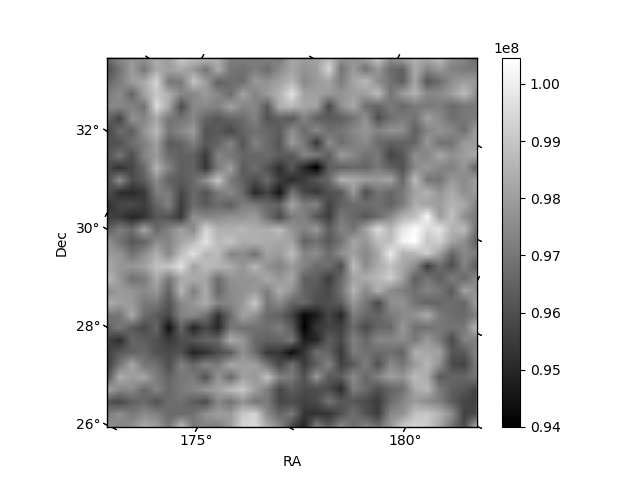
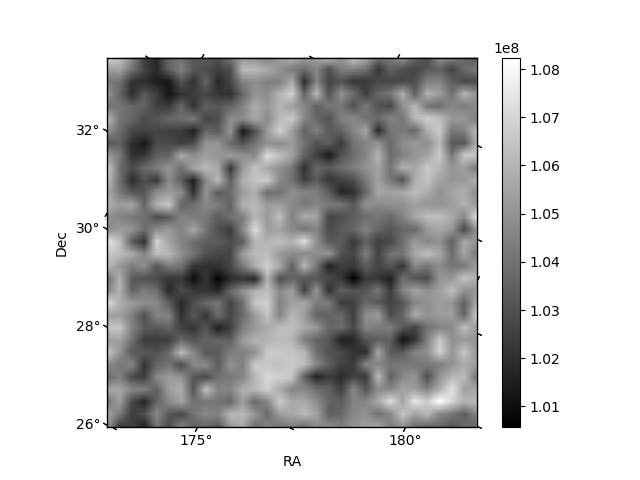
Histogram calculated using DETX and DETY for each event in the final _common_clean file
| Quadrant A | 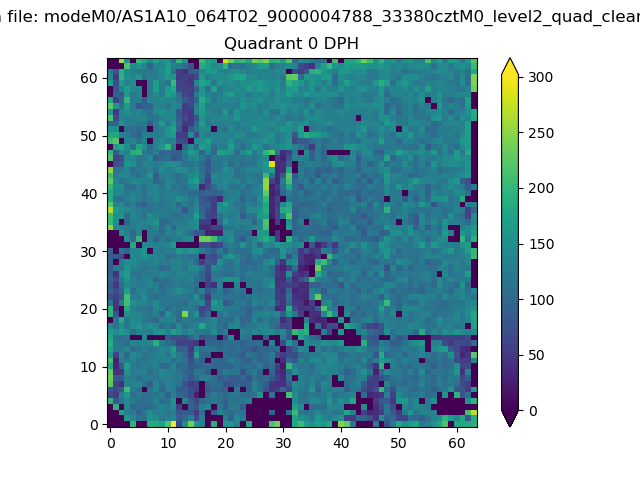 |
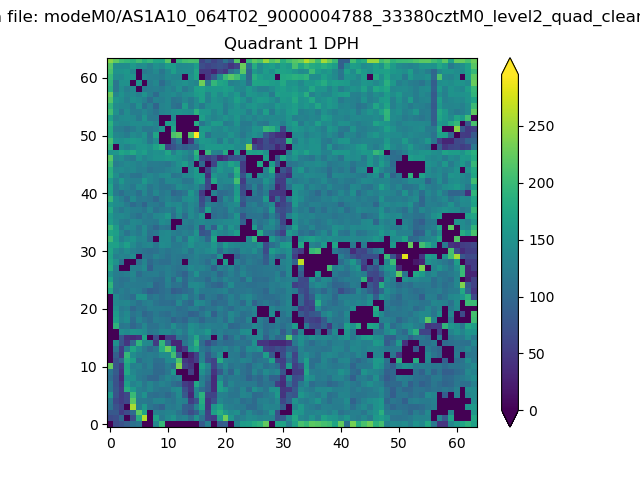 |
Quadrant B |
|---|---|---|---|
| Quadrant D | 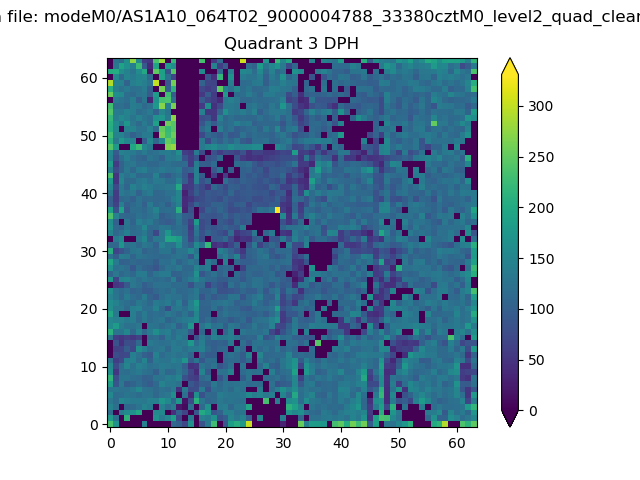 |
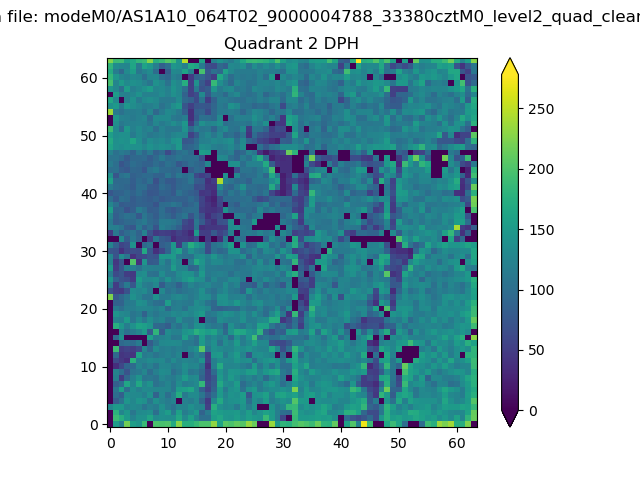 |
Quadrant C |
| Plot type | Count rate plots | Images |
|---|---|---|
| Comparison with Poisson distribution Blue bars denote a histogram of data divided into 1 sec bins. Red curve is a Poisson curve with rate = median count rate of data. |
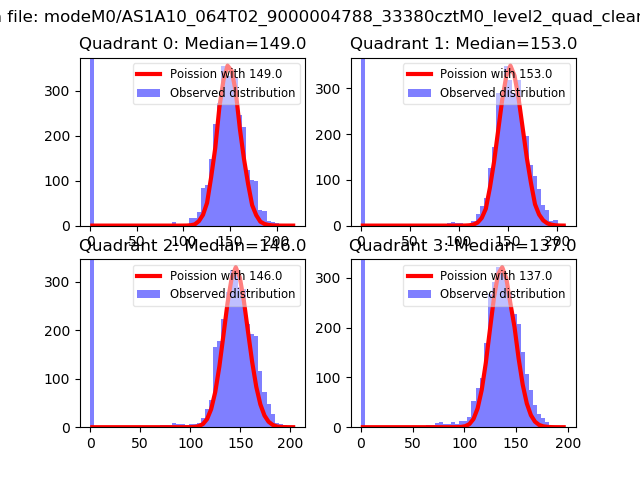 |
 |
| Quadrant-wise count rates Data is divided into 100 sec bins |
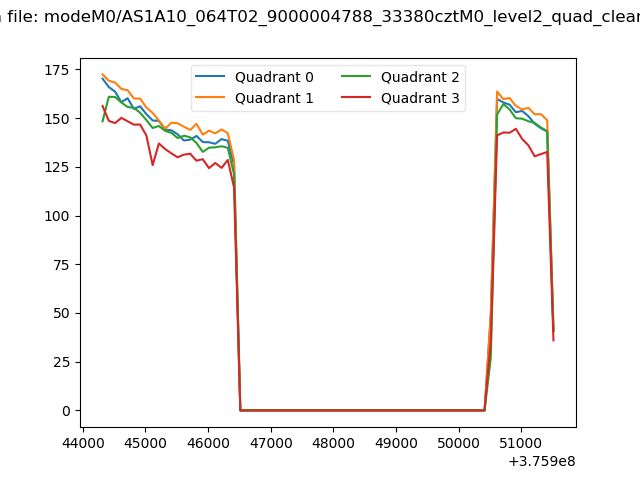 |
|
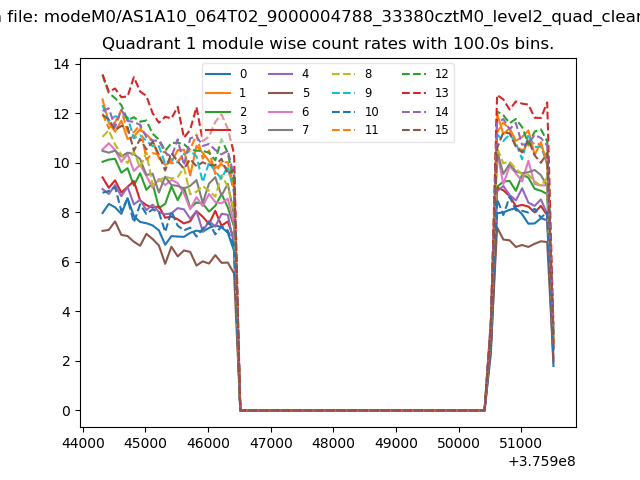
| Module-wise count rates for Quadrant A Data is divided into 100 sec bins |
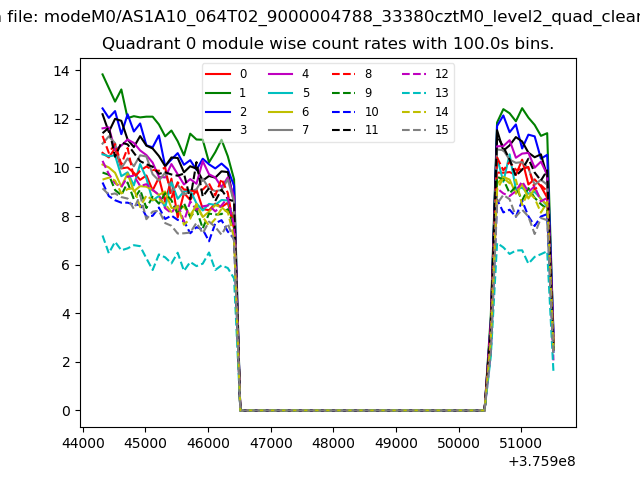 |
 |
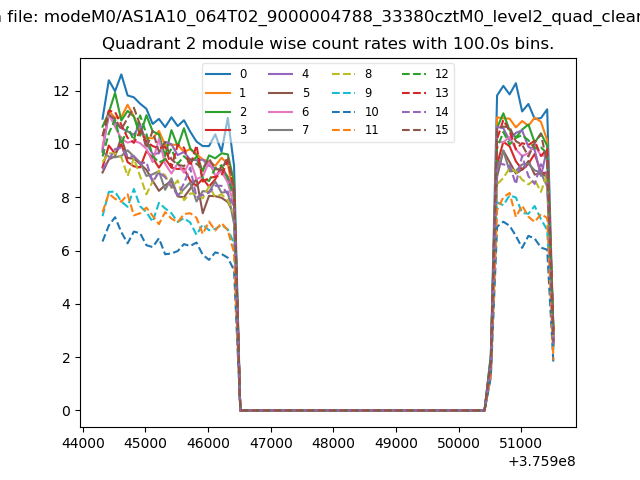
| Module-wise count rates for Quadrant B Data is divided into 100 sec bins |
 |
 |
| Module-wise count rates for Quadrant C Data is divided into 100 sec bins |
 |
 |
| Module-wise count rates for Quadrant D Data is divided into 100 sec bins |
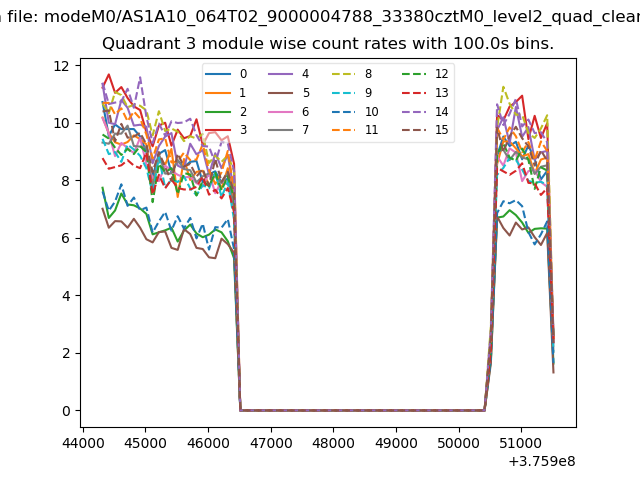 |
 |
| Parameter | Plot |
|---|---|
| CZT HV Monitor |  |
| D_VDD | 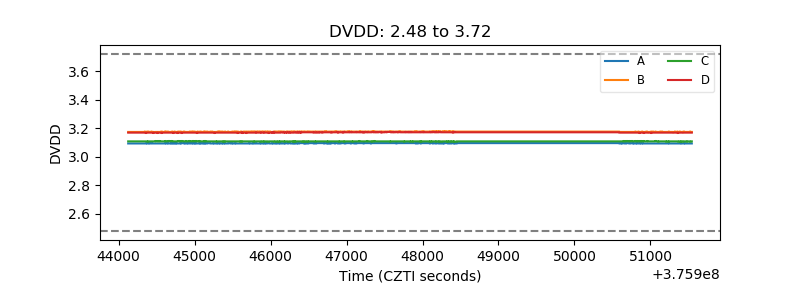 |
| Temperature 1 | 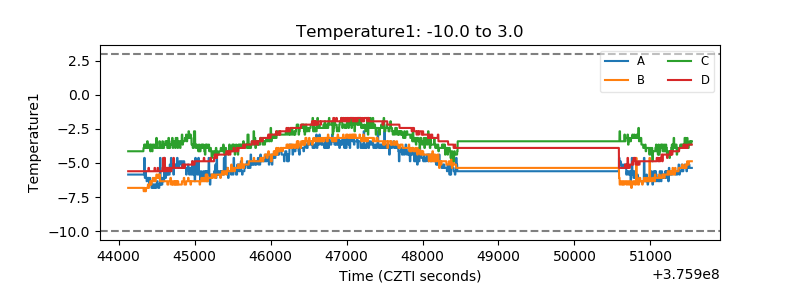 |
| Veto HV Monitor | 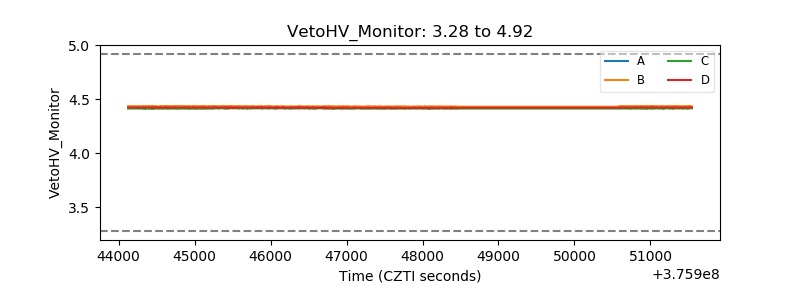 |
| Veto LLD | 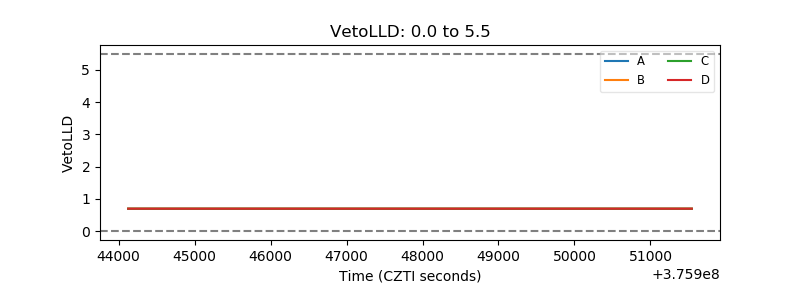 |
| Alpha Counter | 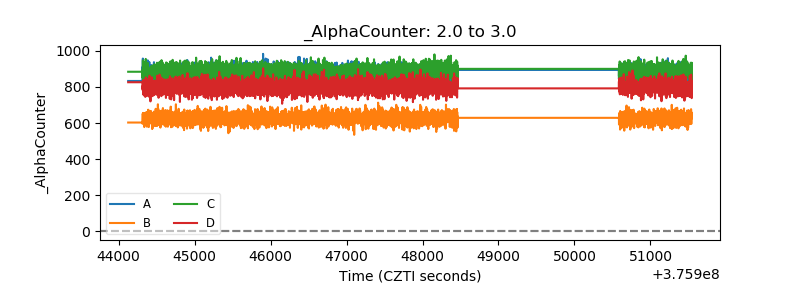 |
| _CPM_Rate | 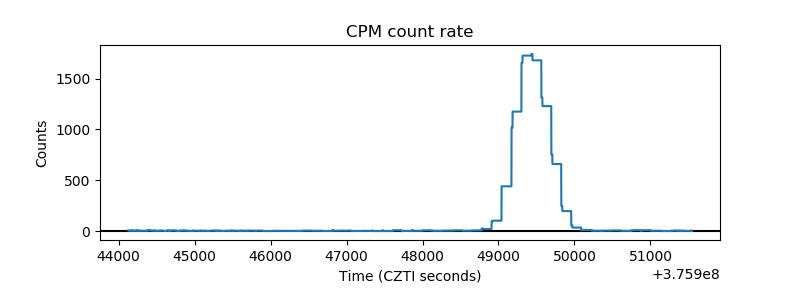 |
| CZT Counter | 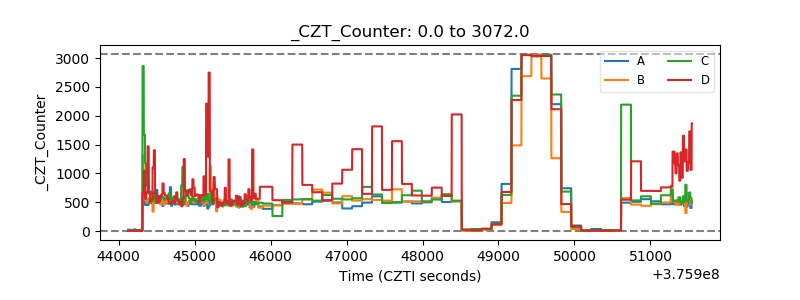 |
| +2.5 Volts monitor |  |
| +5 Volts monitor |  |
| _ROLL_ROT | 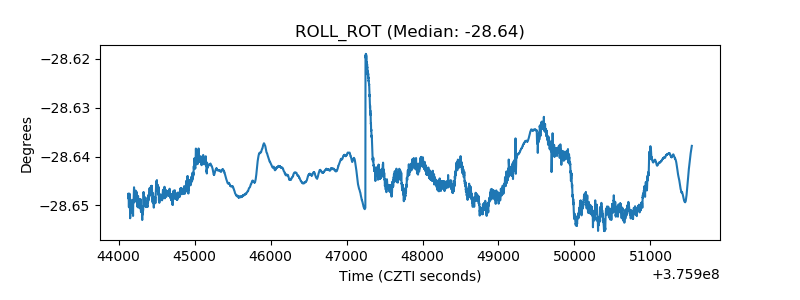 |
| _Roll_DEC | 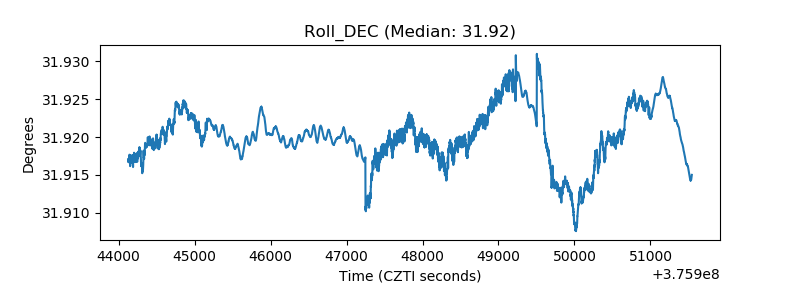 |
| _Roll_RA | 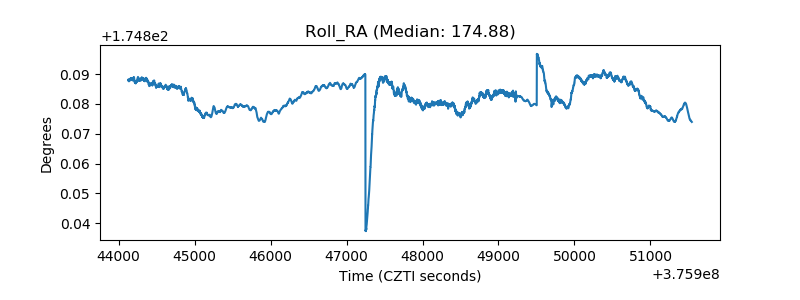 |
| Veto Counter | 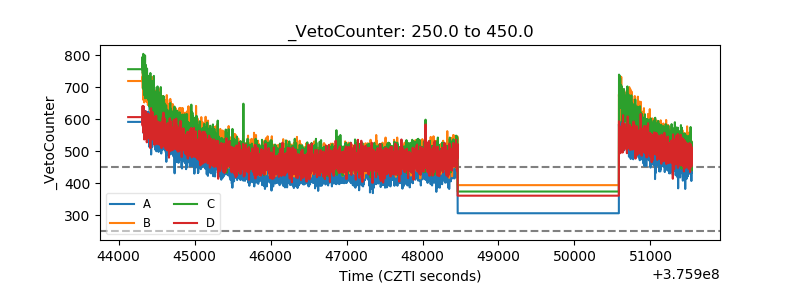 |