| Param | Original file | Final file |
|---|---|---|
| Filename | modeM0/AS1A10_064T02_9000004788_33381cztM0_level2.evt | modeM0/AS1A10_064T02_9000004788_33381cztM0_level2_quad_clean.evt |
| Size (bytes) | 501,814,080 | 63,336,960 |
| Size | 478.6 MB | 60.4 MB |
| Events in quadrant A | 2,409,034 | 401,320 |
| Events in quadrant B | 3,436,757 | 412,671 |
| Events in quadrant C | 3,126,961 | 393,413 |
| Events in quadrant D | 5,888,642 | 362,585 |
| Mode M9 | |||
|---|---|---|---|
| Quadrant | BADHDUFLAG | Total packets | Discarded packets |
| A | 0 | 26 | 0 |
| B | 0 | 26 | 0 |
| C | 0 | 26 | 0 |
| D | 0 | 27 | 0 |
| Mode M0 | |||
|---|---|---|---|
| Quadrant | BADHDUFLAG | Total packets | Discarded packets |
| A | 0 | 9992 | 3 |
| B | 0 | 13183 | 2 |
| C | 0 | 12178 | 2 |
| D | 0 | 21018 | 2 |
| Mode SS | |||
|---|---|---|---|
| Quadrant | BADHDUFLAG | Total packets | Discarded packets |
| A | 0 | 102 | 0 |
| B | 0 | 102 | 0 |
| C | 0 | 102 | 0 |
| D | 0 | 102 | 0 |
| Quadrant | Total seconds | Saturated seconds | Saturation percentage |
|---|---|---|---|
| A | 4955 | 9 | 0.181635% |
| B | 4955 | 347 | 7.003027% |
| C | 4955 | 72 | 1.453078% |
| D | 4955 | 926 | 18.688194% |
Noise dominated data is calculated using 1-second bins in cleaned event files. If a bin has >2000 counts, and if more than 50% of those come from <1% of pixels, then it is considered to be noise-dominated and hence unusable.
| Quadrant | # 1 sec bins | Bins with >0 counts | Bins with >2000 counts | High rate bins dominated by noise | Noise dominated (total time) | Noise dominated (detector-on time) | Marked lightcurve |
|---|---|---|---|---|---|---|---|
| A | 7077 | 4956 | 0 | 0 | 0.00% | 0.00% | 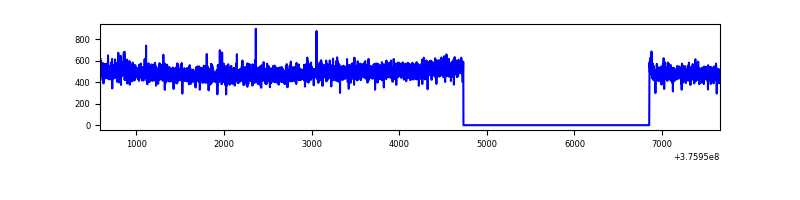 |
| B | 7077 | 4956 | 212 | 212 | 3.00% | 4.28% | 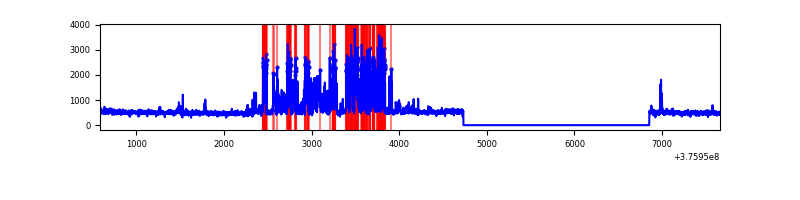 |
| C | 7077 | 4956 | 62 | 62 | 0.88% | 1.25% | 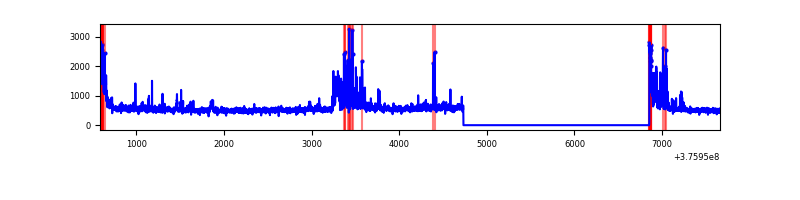 |
| D | 7077 | 4956 | 819 | 819 | 11.57% | 16.53% | 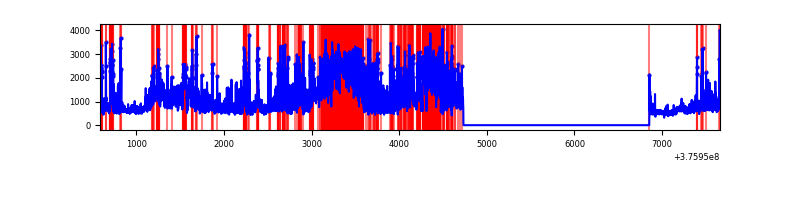 |
Top three noisy pixels from each quadrant. If the there are fewer than three noisy pixels in the level2.evt file, extra rows are filled as -1
| Pixel properties | Quadrant properties | ||||||
|---|---|---|---|---|---|---|---|
| Quadrant | DetID | PixID | Counts | Sigma | Mean | Median | Sigma |
| A | 13 | 254 | 7284 | 53.62 | 622 | 611 | 124.4 |
| A | 3 | 137 | 5701 | 40.9 | 622 | 611 | 124.4 |
| A | 0 | 226 | 5371 | 38.25 | 622 | 611 | 124.4 |
| B | 5 | 172 | 664465 | 5816.88 | 604 | 589 | 114.1 |
| B | 0 | 219 | 271284 | 2371.83 | 604 | 589 | 114.1 |
| B | 5 | 200 | 90226 | 785.4 | 604 | 589 | 114.1 |
| C | 15 | 159 | 264137 | 1931.78 | 599 | 605 | 136.4 |
| C | 0 | 10 | 225393 | 1647.77 | 599 | 605 | 136.4 |
| C | 15 | 214 | 215900 | 1578.18 | 599 | 605 | 136.4 |
| D | 1 | 52 | 1811275 | 13135.59 | 564 | 548 | 137.8 |
| D | 8 | 195 | 712497 | 5164.7 | 564 | 548 | 137.8 |
| D | 2 | 250 | 391809 | 2838.33 | 564 | 548 | 137.8 |
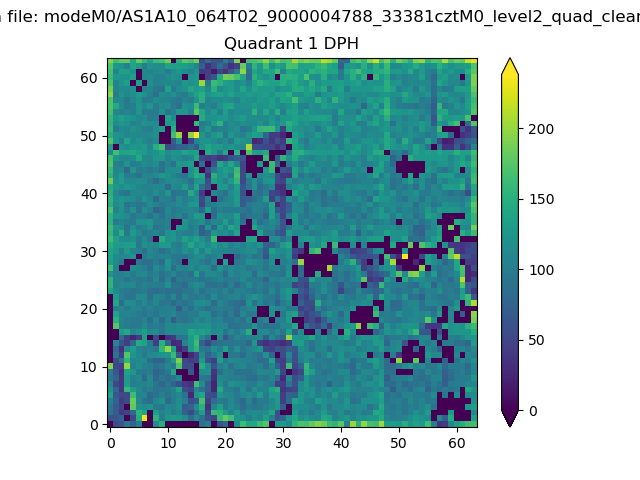
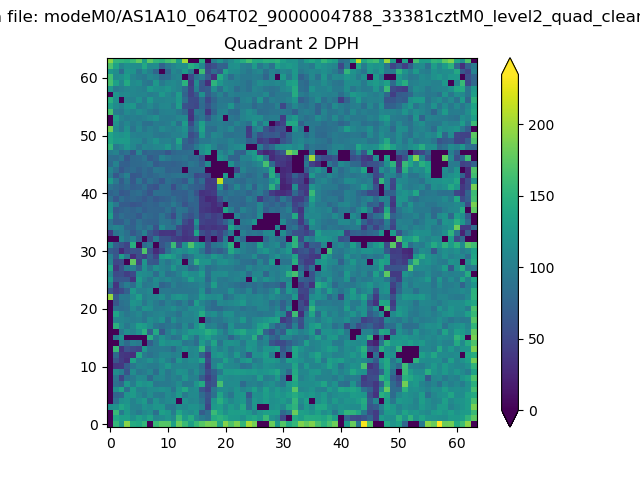
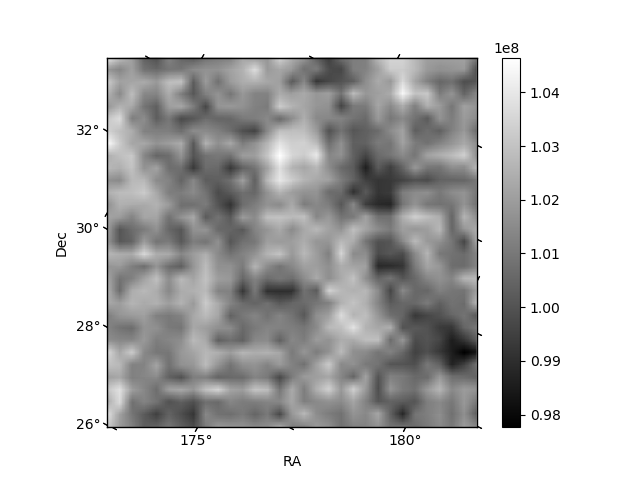
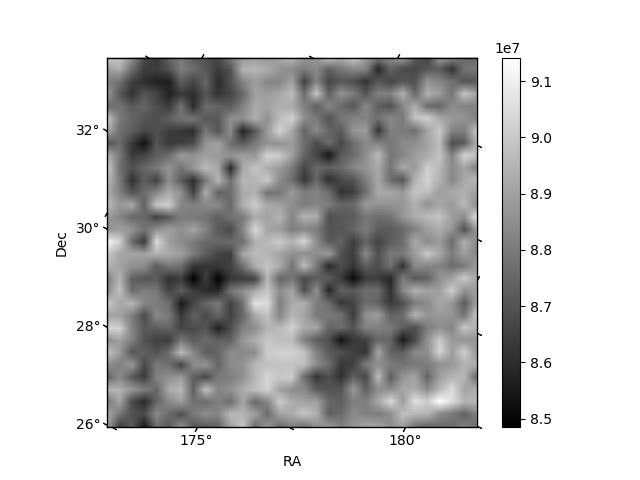
Histogram calculated using DETX and DETY for each event in the final _common_clean file
| Quadrant A |  |
 |
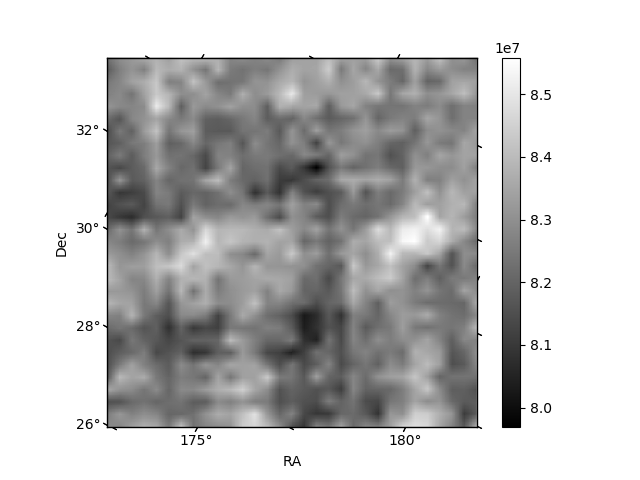
Quadrant B |
|---|---|---|---|
| Quadrant D | 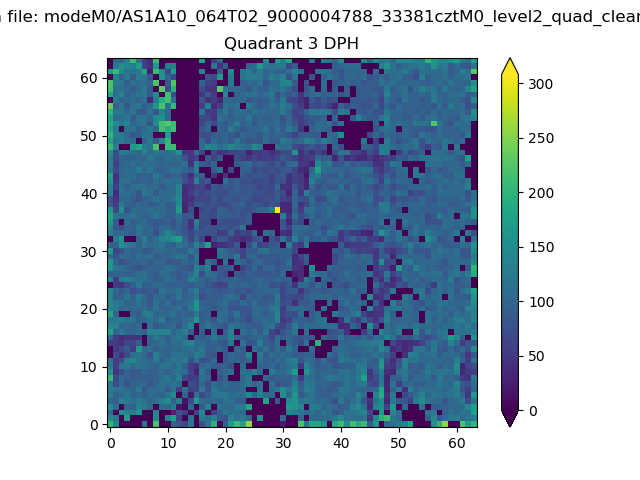 |
 |
Quadrant C |
| Plot type | Count rate plots | Images |
|---|---|---|
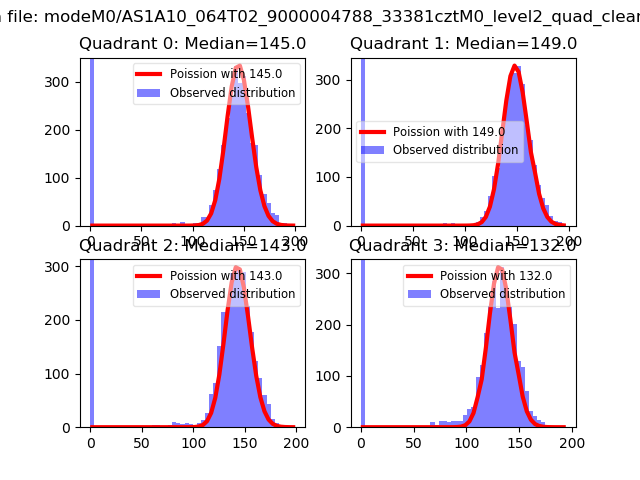
| Comparison with Poisson distribution Blue bars denote a histogram of data divided into 1 sec bins. Red curve is a Poisson curve with rate = median count rate of data. |
 |
 |
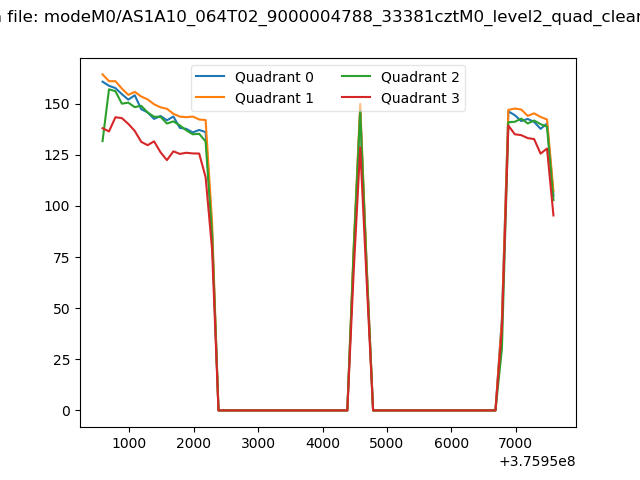
| Quadrant-wise count rates Data is divided into 100 sec bins |
 |
|
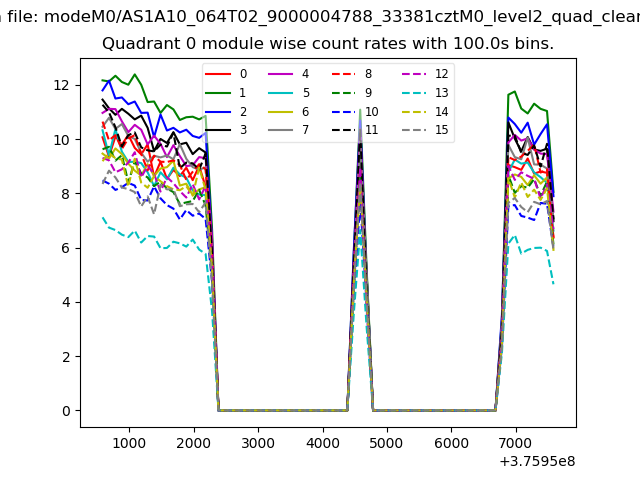
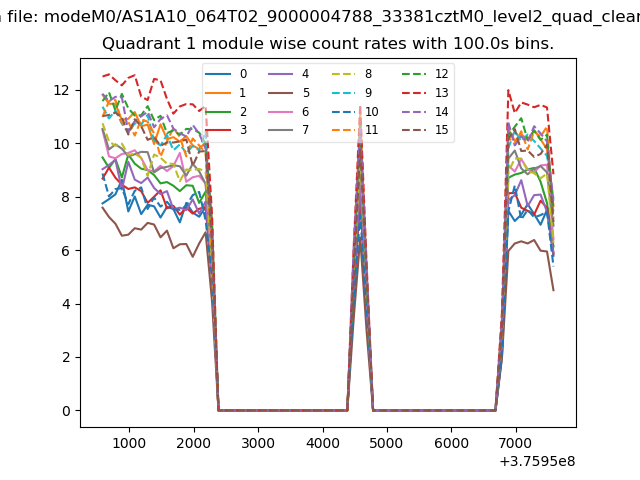
| Module-wise count rates for Quadrant A Data is divided into 100 sec bins |
 |
 |
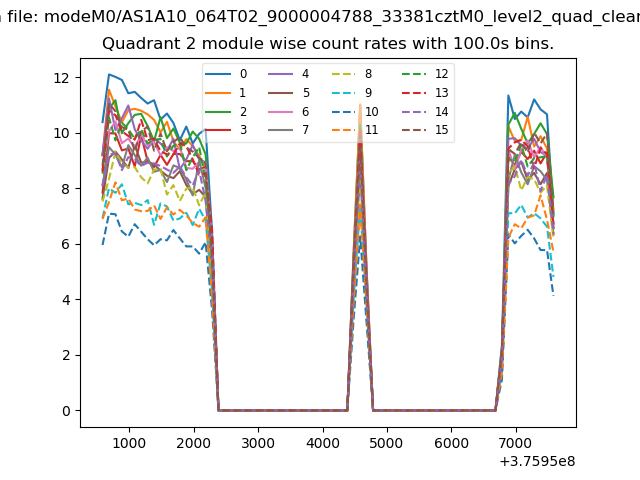
| Module-wise count rates for Quadrant B Data is divided into 100 sec bins |
 |
 |
| Module-wise count rates for Quadrant C Data is divided into 100 sec bins |
 |
 |
| Module-wise count rates for Quadrant D Data is divided into 100 sec bins |
 |
 |
| Parameter | Plot |
|---|---|
| CZT HV Monitor |  |
| D_VDD | 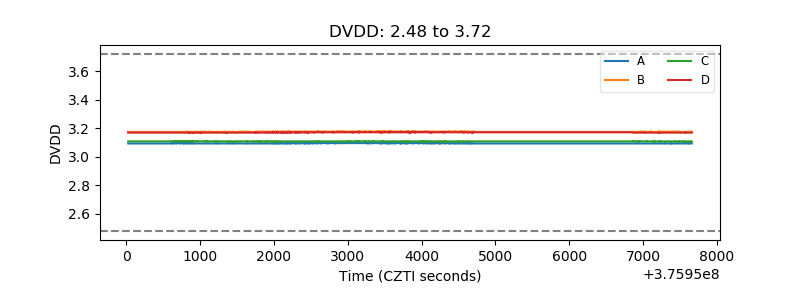 |
| Temperature 1 | 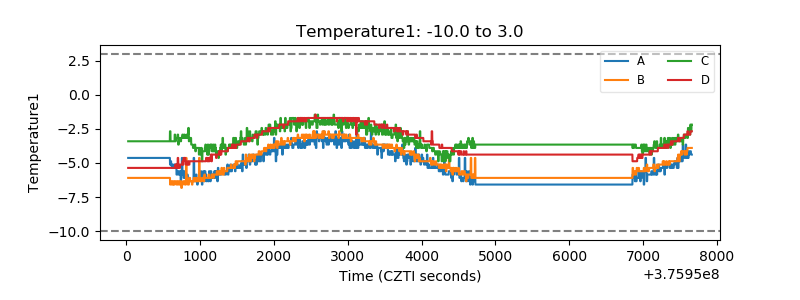 |
| Veto HV Monitor | 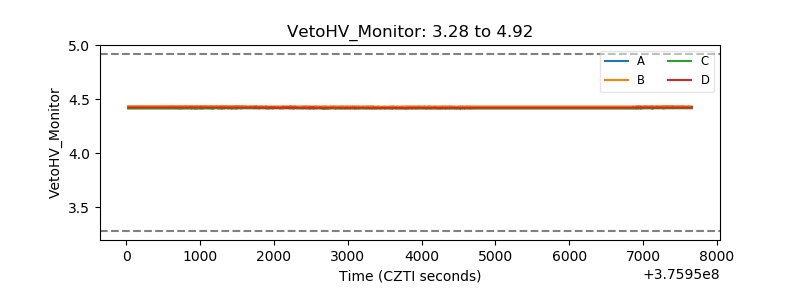 |
| Veto LLD | 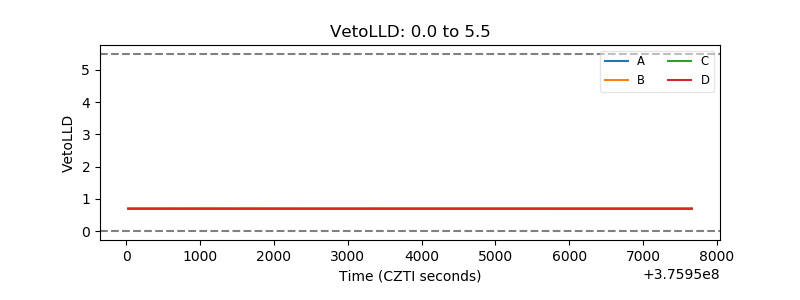 |
| Alpha Counter | 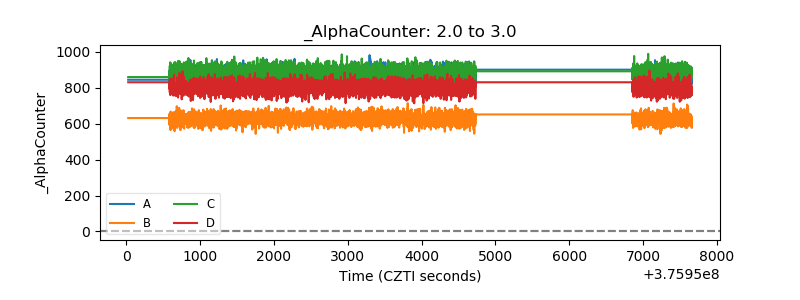 |
| _CPM_Rate | 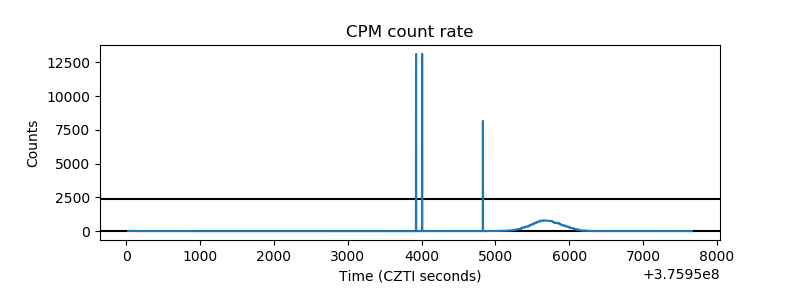 |
| CZT Counter | 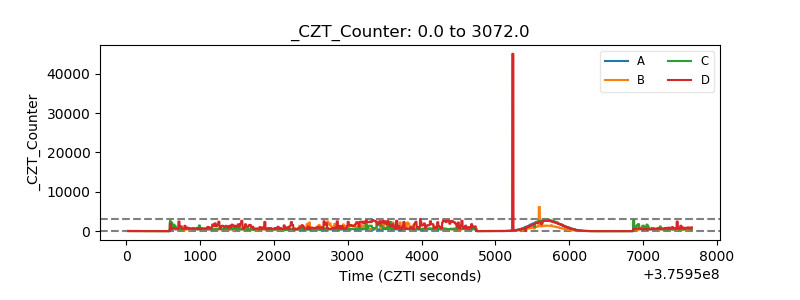 |
| +2.5 Volts monitor | 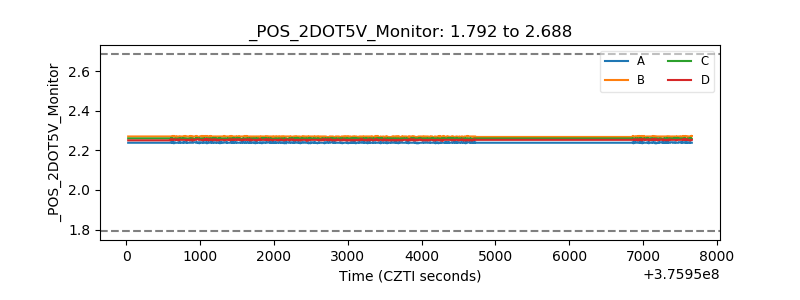 |
| +5 Volts monitor |  |
| _ROLL_ROT |  |
| _Roll_DEC |  |
| _Roll_RA | 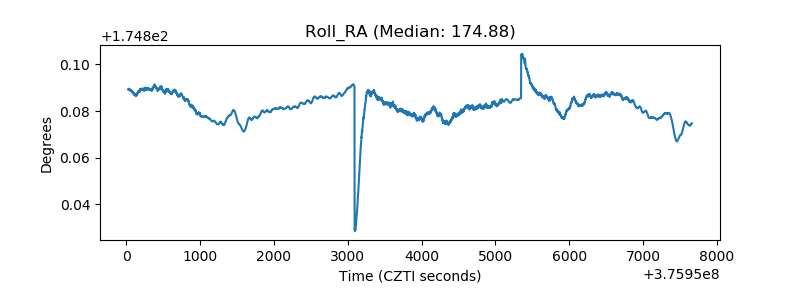 |
| Veto Counter | 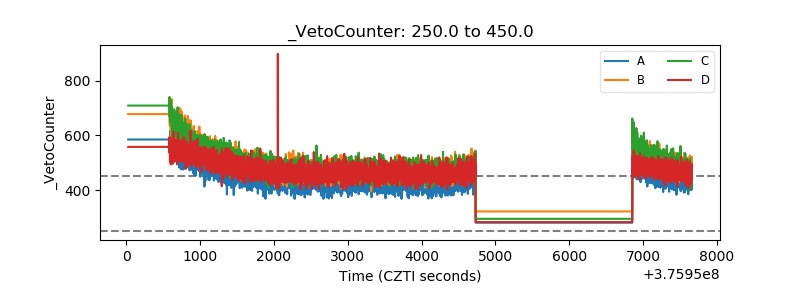 |