| Param | Original file | Final file |
|---|---|---|
| Filename | modeM0/AS1A10_064T02_9000004788_33382cztM0_level2.evt | modeM0/AS1A10_064T02_9000004788_33382cztM0_level2_quad_clean.evt |
| Size (bytes) | 498,502,080 | 61,231,680 |
| Size | 475.4 MB | 58.4 MB |
| Events in quadrant A | 2,379,246 | 387,497 |
| Events in quadrant B | 3,460,724 | 395,637 |
| Events in quadrant C | 3,145,545 | 380,836 |
| Events in quadrant D | 5,772,516 | 338,638 |
| Mode M9 | |||
|---|---|---|---|
| Quadrant | BADHDUFLAG | Total packets | Discarded packets |
| A | 0 | 28 | 0 |
| B | 0 | 28 | 0 |
| C | 0 | 28 | 0 |
| D | 0 | 29 | 0 |
| Mode M0 | |||
|---|---|---|---|
| Quadrant | BADHDUFLAG | Total packets | Discarded packets |
| A | 0 | 10047 | 3 |
| B | 0 | 13306 | 2 |
| C | 0 | 12169 | 2 |
| D | 0 | 20739 | 2 |
| Mode SS | |||
|---|---|---|---|
| Quadrant | BADHDUFLAG | Total packets | Discarded packets |
| A | 0 | 102 | 0 |
| B | 0 | 102 | 0 |
| C | 0 | 102 | 0 |
| D | 0 | 102 | 0 |
| Quadrant | Total seconds | Saturated seconds | Saturation percentage |
|---|---|---|---|
| A | 5006 | 4 | 0.079904% |
| B | 5006 | 312 | 6.232521% |
| C | 5006 | 93 | 1.857771% |
| D | 5006 | 621 | 12.405114% |
Noise dominated data is calculated using 1-second bins in cleaned event files. If a bin has >2000 counts, and if more than 50% of those come from <1% of pixels, then it is considered to be noise-dominated and hence unusable.
| Quadrant | # 1 sec bins | Bins with >0 counts | Bins with >2000 counts | High rate bins dominated by noise | Noise dominated (total time) | Noise dominated (detector-on time) | Marked lightcurve |
|---|---|---|---|---|---|---|---|
| A | 7039 | 5007 | 0 | 0 | 0.00% | 0.00% | 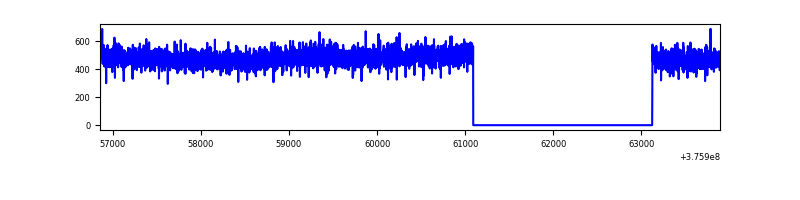 |
| B | 7039 | 5007 | 240 | 240 | 3.41% | 4.79% | 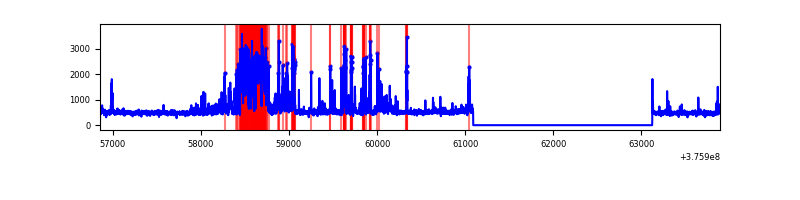 |
| C | 7039 | 5007 | 82 | 82 | 1.16% | 1.64% | 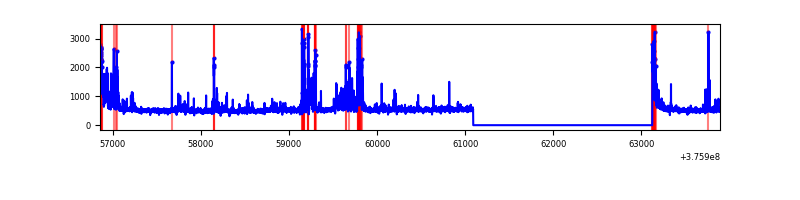 |
| D | 7039 | 5007 | 563 | 563 | 8.00% | 11.24% | 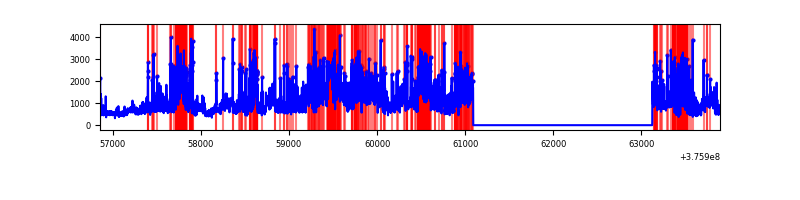 |
Top three noisy pixels from each quadrant. If the there are fewer than three noisy pixels in the level2.evt file, extra rows are filled as -1
| Pixel properties | Quadrant properties | ||||||
|---|---|---|---|---|---|---|---|
| Quadrant | DetID | PixID | Counts | Sigma | Mean | Median | Sigma |
| A | 13 | 254 | 7340 | 54.16 | 615 | 603 | 124.4 |
| A | 3 | 137 | 5609 | 40.24 | 615 | 603 | 124.4 |
| A | 0 | 226 | 5156 | 36.6 | 615 | 603 | 124.4 |
| B | 5 | 172 | 754252 | 6604.74 | 598 | 583 | 114.1 |
| B | 5 | 255 | 143089 | 1248.84 | 598 | 583 | 114.1 |
| B | 0 | 219 | 82385 | 716.87 | 598 | 583 | 114.1 |
| C | 15 | 208 | 272495 | 1993.25 | 592 | 597 | 136.4 |
| C | 15 | 214 | 216610 | 1583.56 | 592 | 597 | 136.4 |
| C | 0 | 10 | 191406 | 1398.8 | 592 | 597 | 136.4 |
| D | 8 | 195 | 1072882 | 7254.26 | 569 | 555 | 147.8 |
| D | 2 | 250 | 861150 | 5821.9 | 569 | 555 | 147.8 |
| D | 1 | 52 | 705729 | 4770.48 | 569 | 555 | 147.8 |
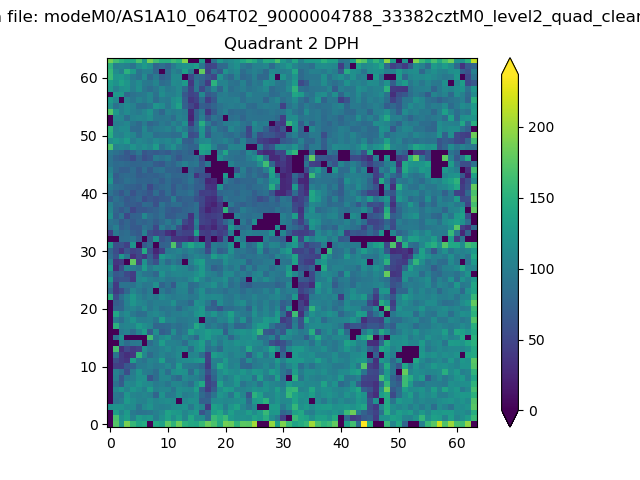
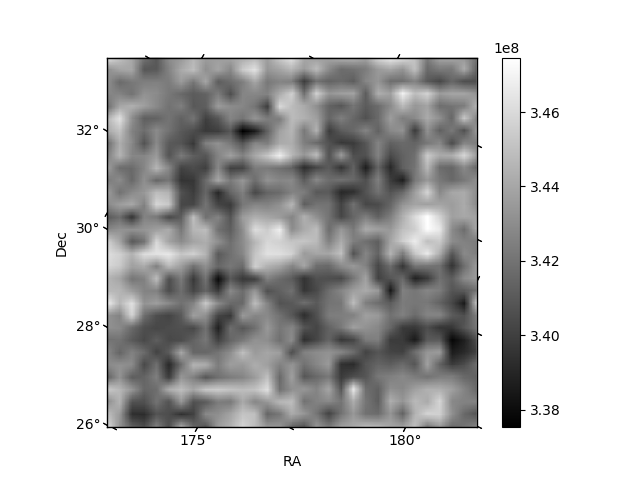
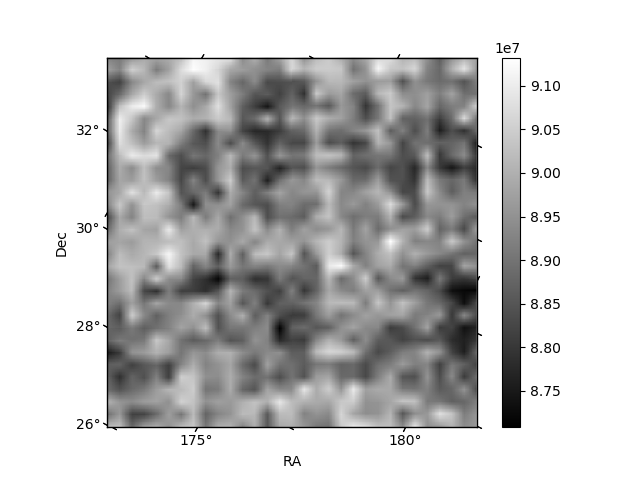
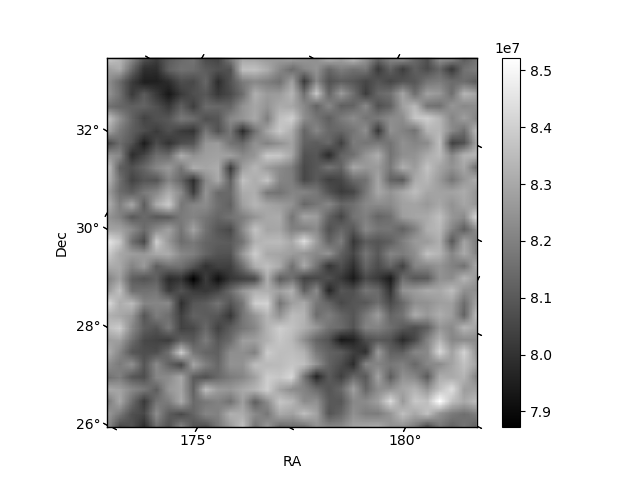
Histogram calculated using DETX and DETY for each event in the final _common_clean file
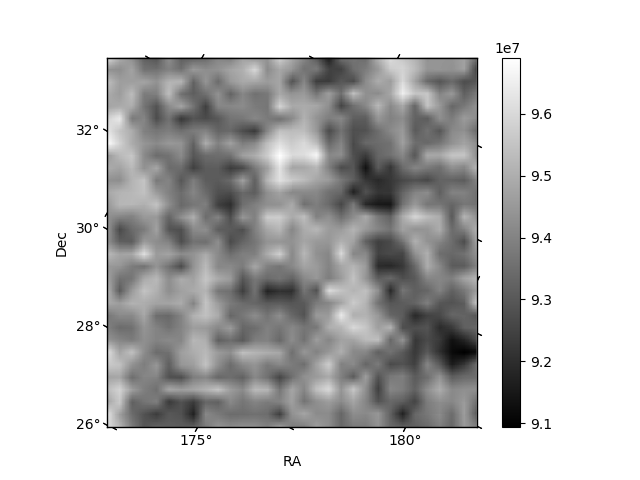
| Quadrant A | 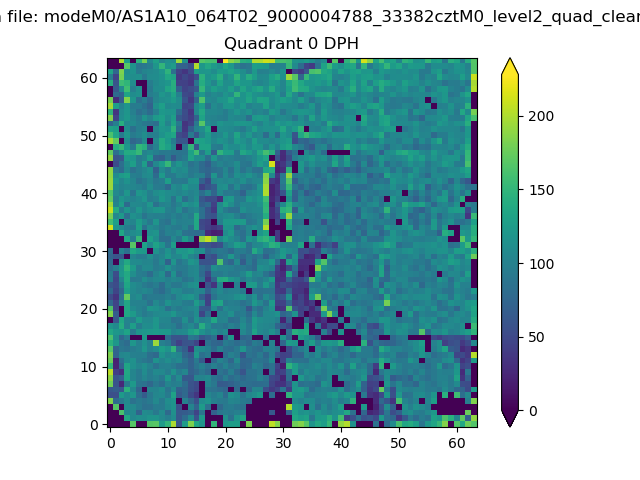 |
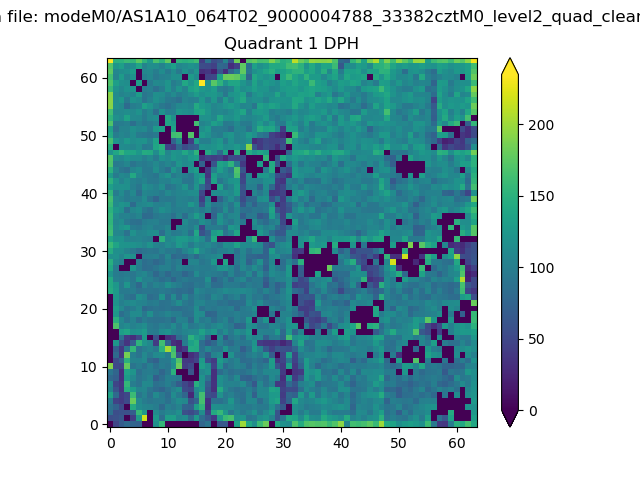 |
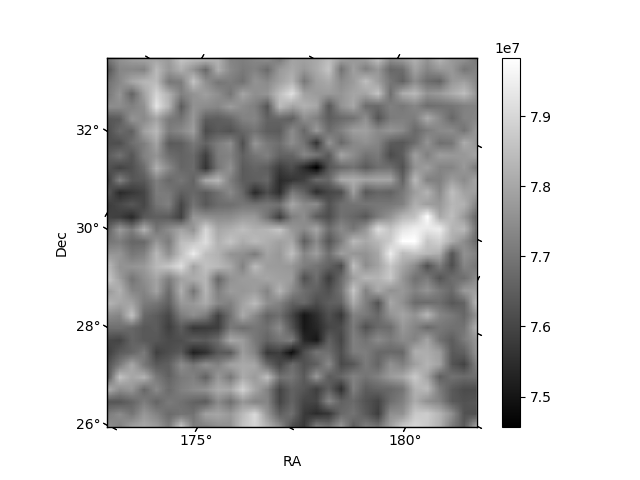
Quadrant B |
|---|---|---|---|
| Quadrant D | 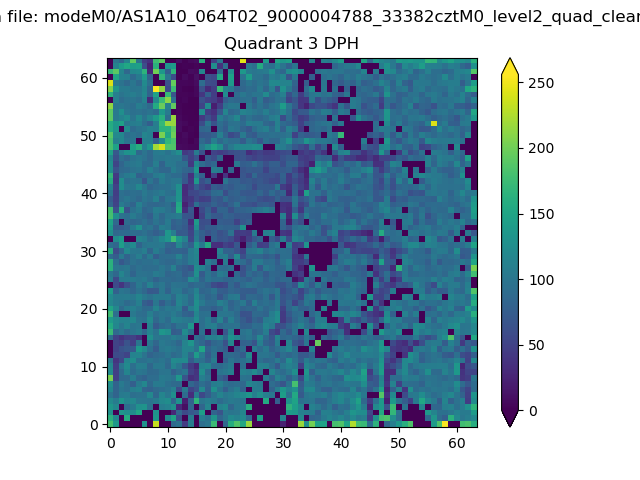 |
 |
Quadrant C |
| Plot type | Count rate plots | Images |
|---|---|---|
| Comparison with Poisson distribution Blue bars denote a histogram of data divided into 1 sec bins. Red curve is a Poisson curve with rate = median count rate of data. |
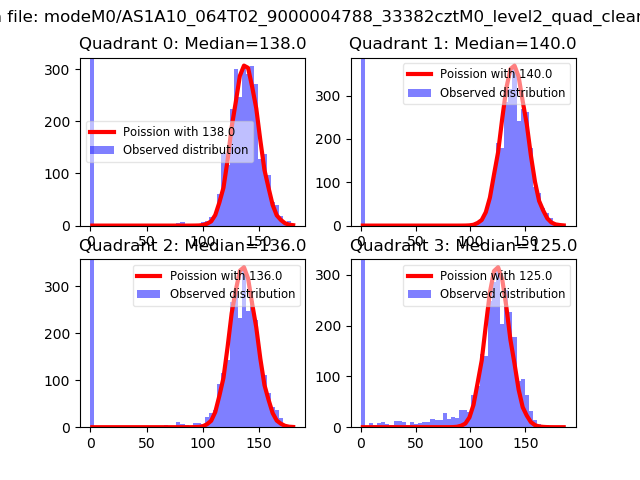 |
 |
| Quadrant-wise count rates Data is divided into 100 sec bins |
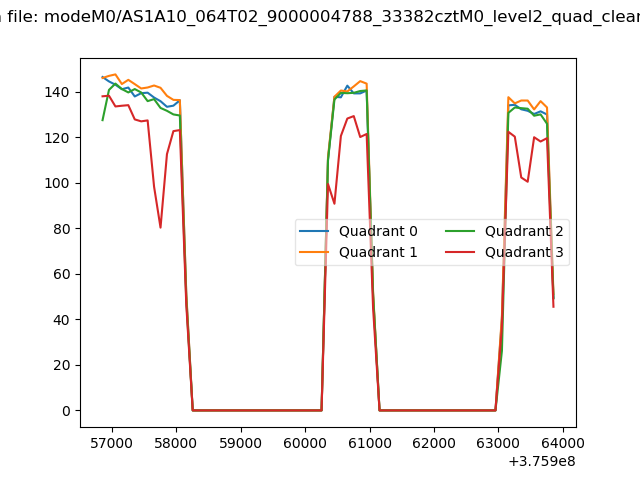 |
|
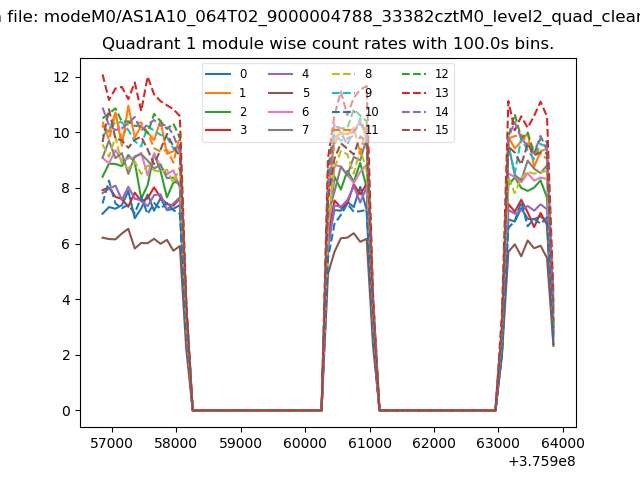
| Module-wise count rates for Quadrant A Data is divided into 100 sec bins |
 |
 |
| Module-wise count rates for Quadrant B Data is divided into 100 sec bins |
 |
 |
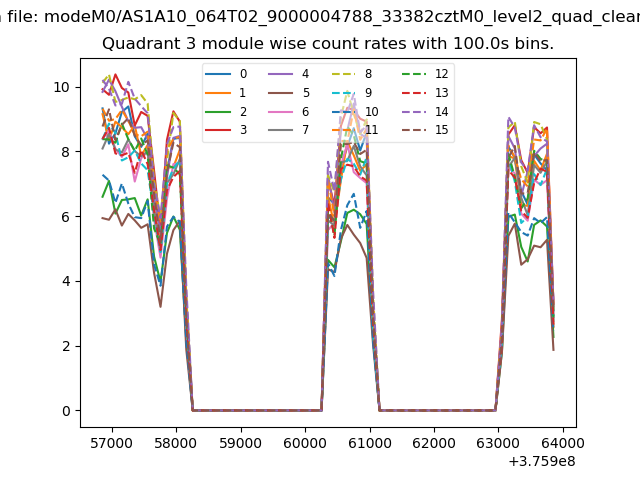
| Module-wise count rates for Quadrant C Data is divided into 100 sec bins |
 |
 |
| Module-wise count rates for Quadrant D Data is divided into 100 sec bins |
 |
 |
| Parameter | Plot |
|---|---|
| CZT HV Monitor |  |
| D_VDD | 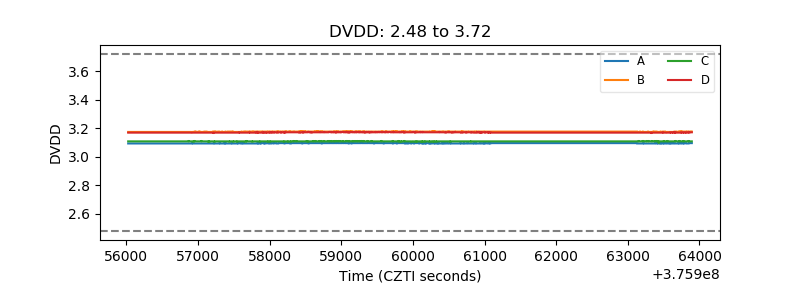 |
| Temperature 1 | 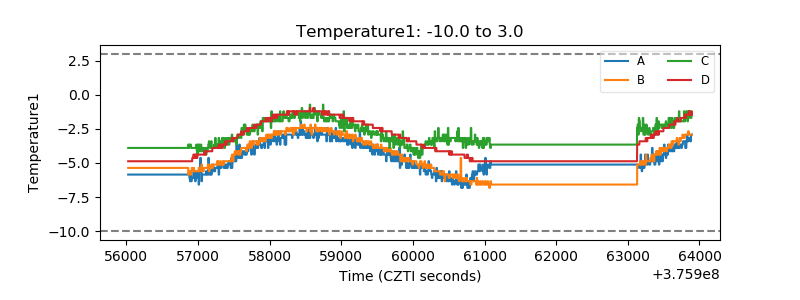 |
| Veto HV Monitor | 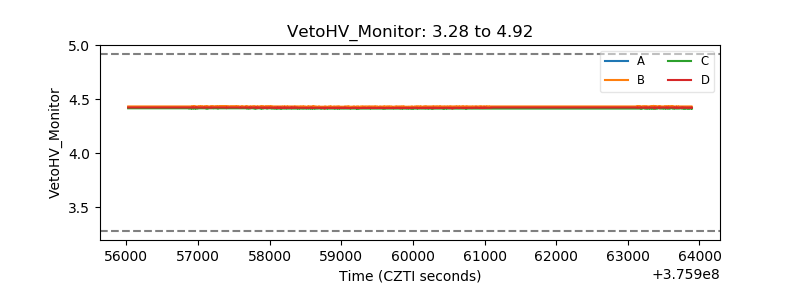 |
| Veto LLD |  |
| Alpha Counter | 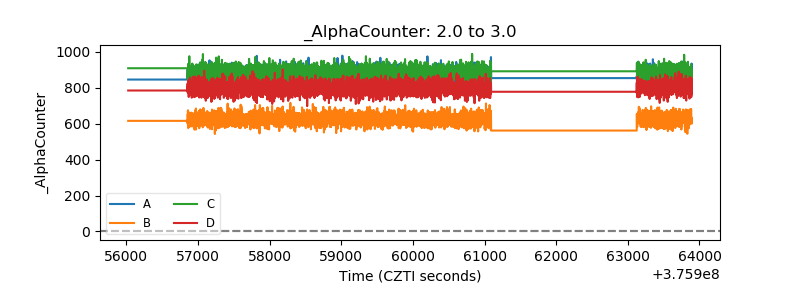 |
| _CPM_Rate | 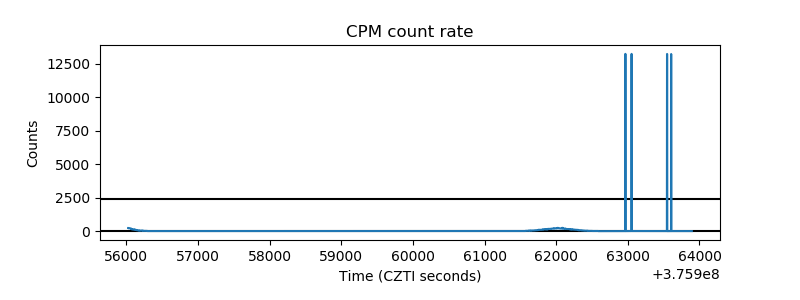 |
| CZT Counter | 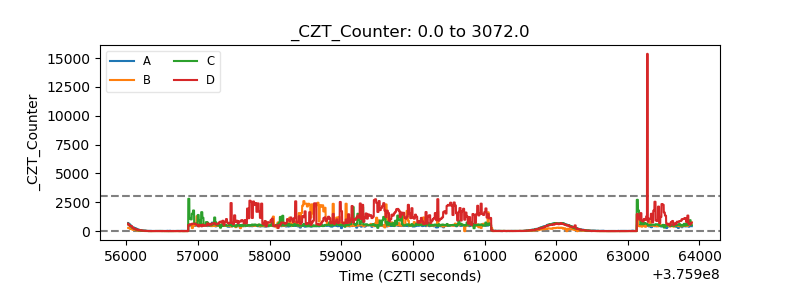 |
| +2.5 Volts monitor |  |
| +5 Volts monitor |  |
| _ROLL_ROT | 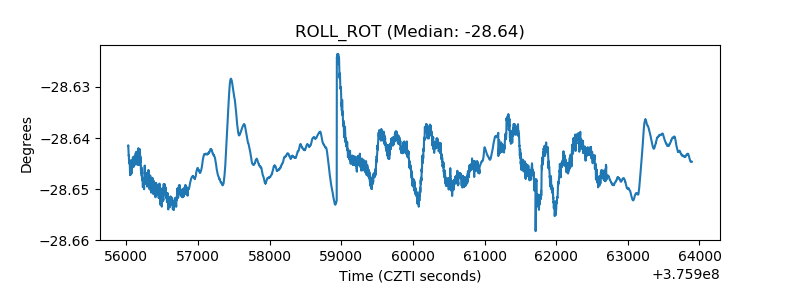 |
| _Roll_DEC | 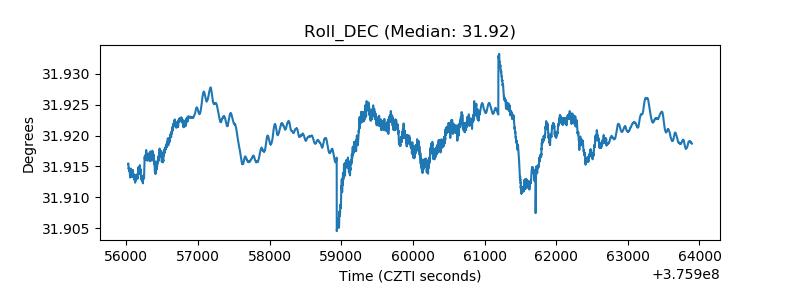 |
| _Roll_RA | 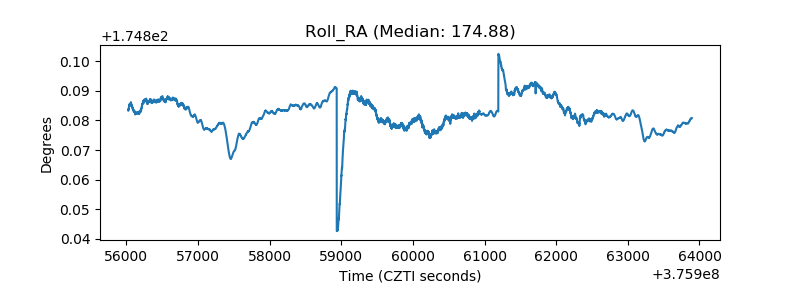 |
| Veto Counter | 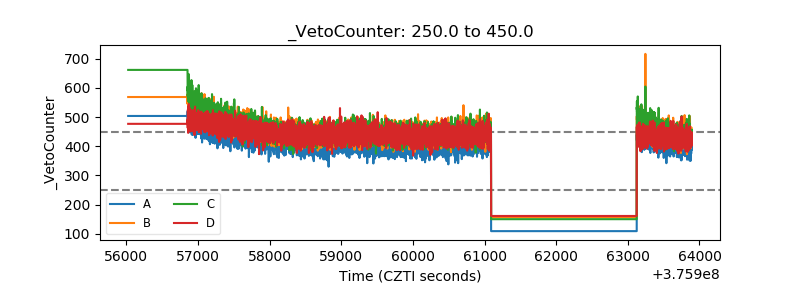 |