| Param | Original file | Final file |
|---|---|---|
| Filename | modeM0/AS1A10_064T02_9000004788_33384cztM0_level2.evt | modeM0/AS1A10_064T02_9000004788_33384cztM0_level2_quad_clean.evt |
| Size (bytes) | 559,494,720 | 58,521,600 |
| Size | 533.6 MB | 55.8 MB |
| Events in quadrant A | 2,641,582 | 352,041 |
| Events in quadrant B | 4,688,525 | 353,339 |
| Events in quadrant C | 3,126,900 | 347,603 |
| Events in quadrant D | 6,099,874 | 318,758 |
| Mode M9 | |||
|---|---|---|---|
| Quadrant | BADHDUFLAG | Total packets | Discarded packets |
| A | 0 | 14 | 0 |
| B | 0 | 14 | 0 |
| C | 0 | 14 | 0 |
| D | 0 | 15 | 0 |
| Mode M0 | |||
|---|---|---|---|
| Quadrant | BADHDUFLAG | Total packets | Discarded packets |
| A | 0 | 11496 | 3 |
| B | 0 | 17569 | 2 |
| C | 0 | 12477 | 2 |
| D | 0 | 22219 | 2 |
| Mode SS | |||
|---|---|---|---|
| Quadrant | BADHDUFLAG | Total packets | Discarded packets |
| A | 0 | 118 | 0 |
| B | 0 | 118 | 0 |
| C | 0 | 118 | 0 |
| D | 0 | 118 | 0 |
| Quadrant | Total seconds | Saturated seconds | Saturation percentage |
|---|---|---|---|
| A | 5714 | 7 | 0.122506% |
| B | 5714 | 738 | 12.915646% |
| C | 5714 | 43 | 0.752538% |
| D | 5714 | 527 | 9.222961% |
Noise dominated data is calculated using 1-second bins in cleaned event files. If a bin has >2000 counts, and if more than 50% of those come from <1% of pixels, then it is considered to be noise-dominated and hence unusable.
| Quadrant | # 1 sec bins | Bins with >0 counts | Bins with >2000 counts | High rate bins dominated by noise | Noise dominated (total time) | Noise dominated (detector-on time) | Marked lightcurve |
|---|---|---|---|---|---|---|---|
| A | 7146 | 5715 | 0 | 0 | 0.00% | 0.00% | 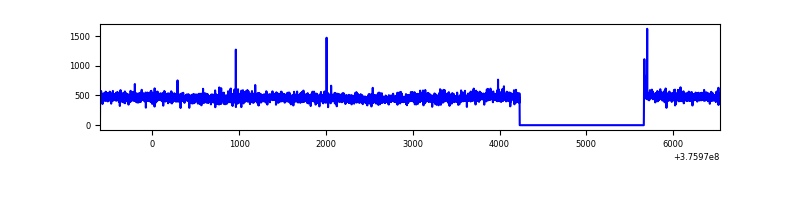 |
| B | 7146 | 5715 | 455 | 455 | 6.37% | 7.96% | 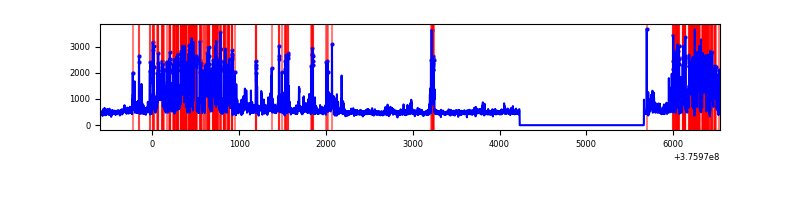 |
| C | 7146 | 5715 | 34 | 34 | 0.48% | 0.59% | 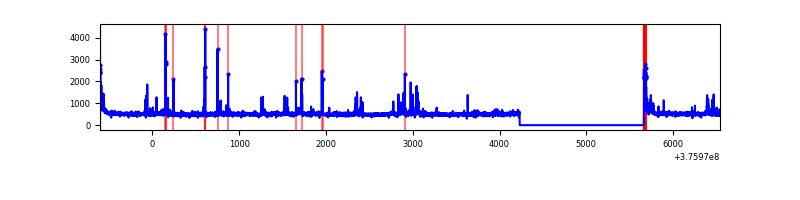 |
| D | 7146 | 5715 | 477 | 477 | 6.68% | 8.35% | 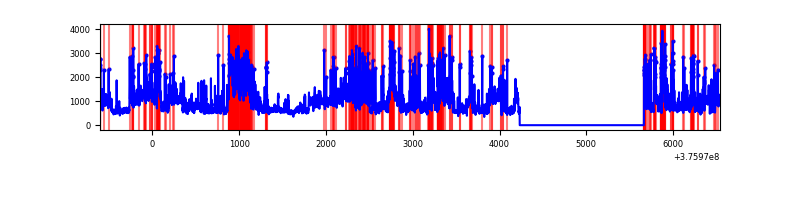 |
Top three noisy pixels from each quadrant. If the there are fewer than three noisy pixels in the level2.evt file, extra rows are filled as -1
| Pixel properties | Quadrant properties | ||||||
|---|---|---|---|---|---|---|---|
| Quadrant | DetID | PixID | Counts | Sigma | Mean | Median | Sigma |
| A | 13 | 254 | 9588 | 64.91 | 679 | 665 | 137.5 |
| A | 15 | 169 | 9586 | 64.89 | 679 | 665 | 137.5 |
| A | 3 | 137 | 6615 | 43.28 | 679 | 665 | 137.5 |
| B | 5 | 172 | 1269903 | 10303.35 | 641 | 625 | 123.2 |
| B | 0 | 219 | 565259 | 4583.41 | 641 | 625 | 123.2 |
| B | 5 | 255 | 94752 | 764.07 | 641 | 625 | 123.2 |
| C | 15 | 214 | 242835 | 1599.45 | 653 | 658 | 151.4 |
| C | 0 | 10 | 108574 | 712.73 | 653 | 658 | 151.4 |
| C | 14 | 254 | 92384 | 605.8 | 653 | 658 | 151.4 |
| D | 8 | 195 | 1587676 | 9909.31 | 640 | 621 | 160.2 |
| D | 2 | 250 | 517739 | 3228.8 | 640 | 621 | 160.2 |
| D | 12 | 218 | 456636 | 2847.28 | 640 | 621 | 160.2 |
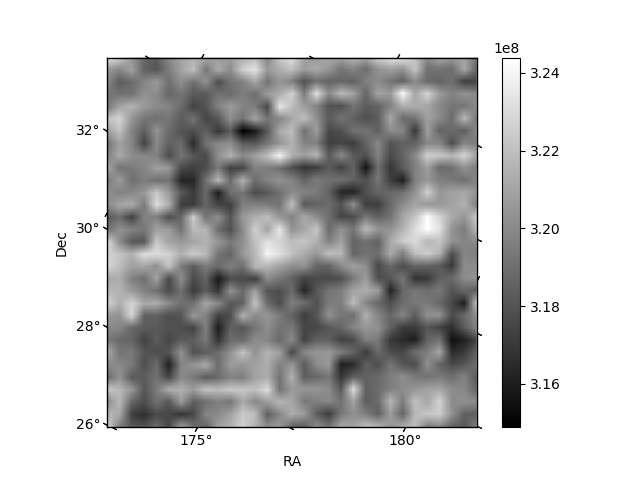
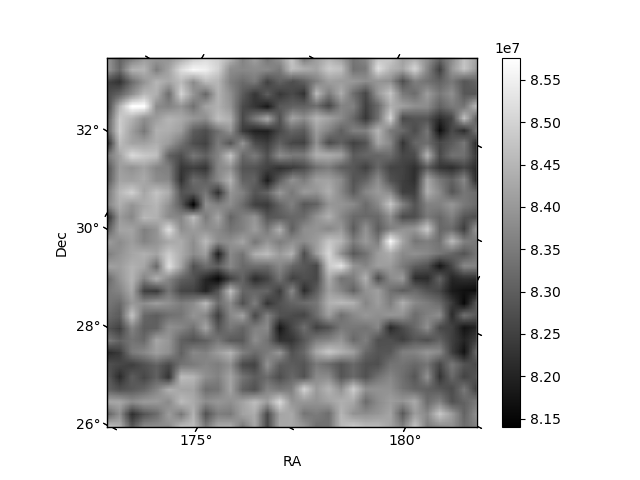
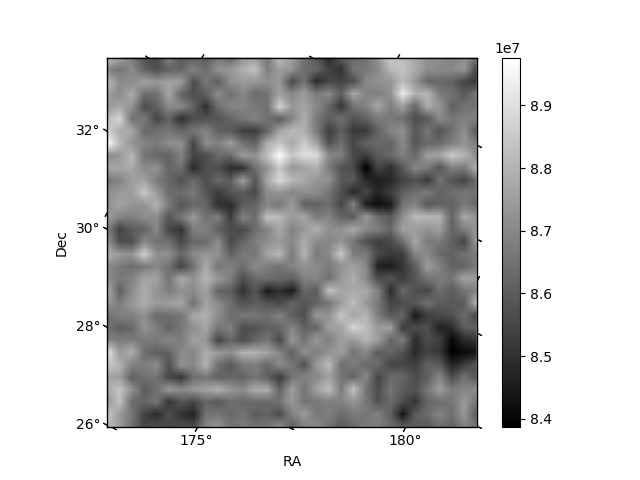
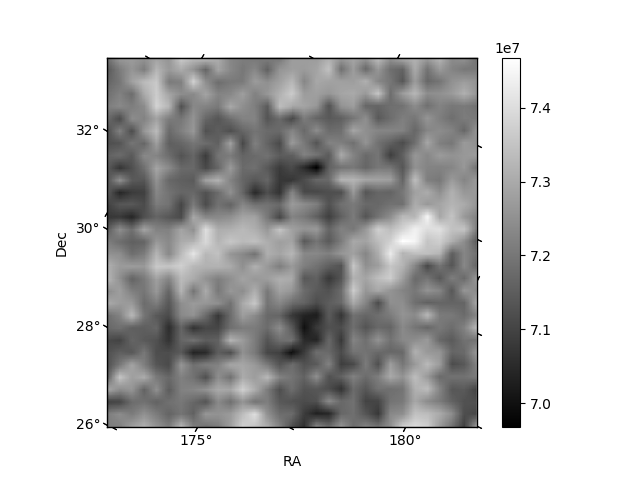
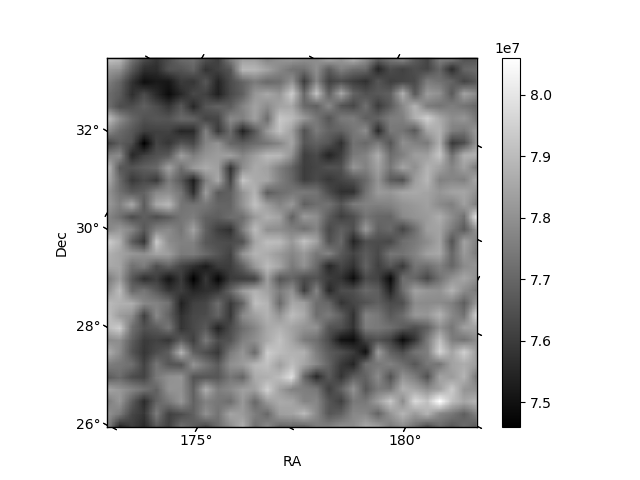
Histogram calculated using DETX and DETY for each event in the final _common_clean file
| Quadrant A | 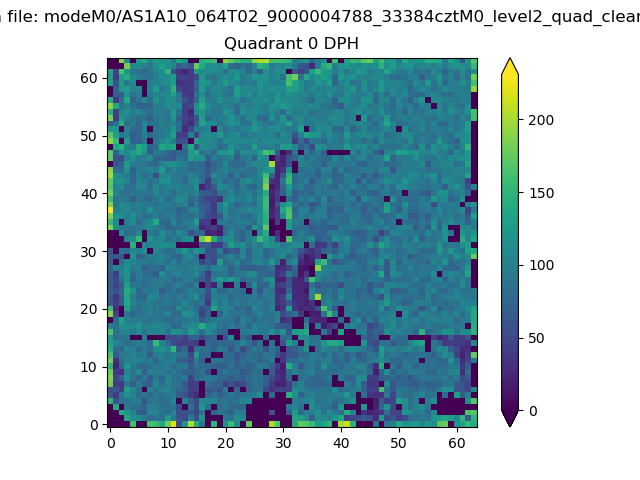 |
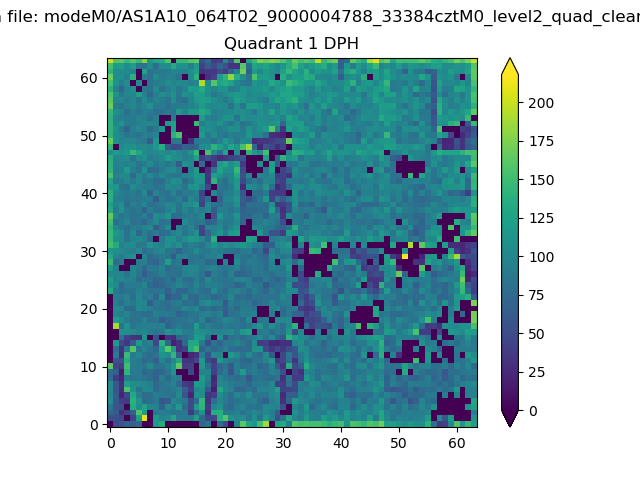 |
Quadrant B |
|---|---|---|---|
| Quadrant D | 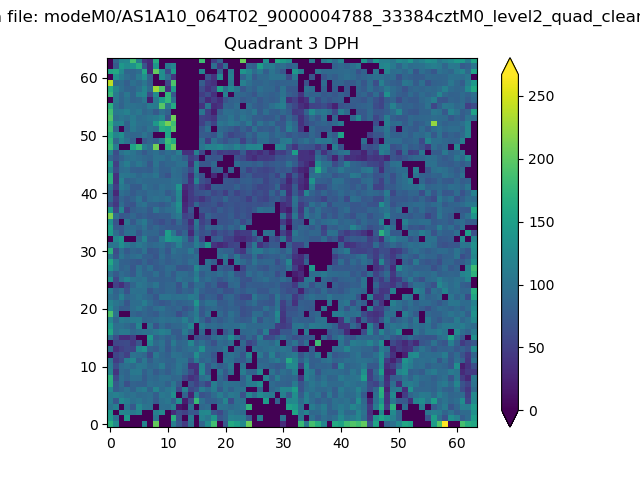 |
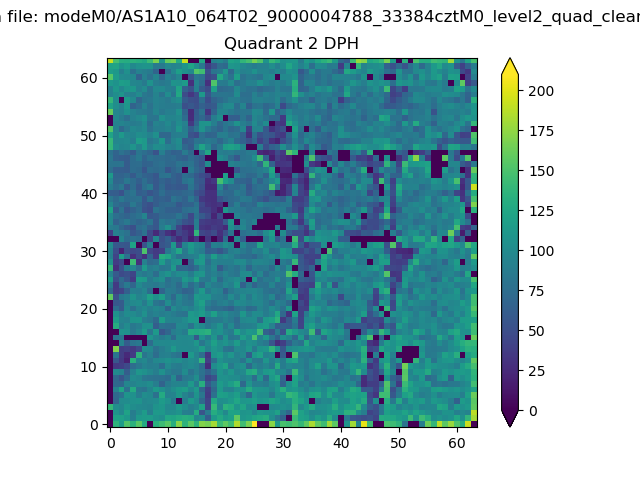 |
Quadrant C |
| Plot type | Count rate plots | Images |
|---|---|---|
| Comparison with Poisson distribution Blue bars denote a histogram of data divided into 1 sec bins. Red curve is a Poisson curve with rate = median count rate of data. |
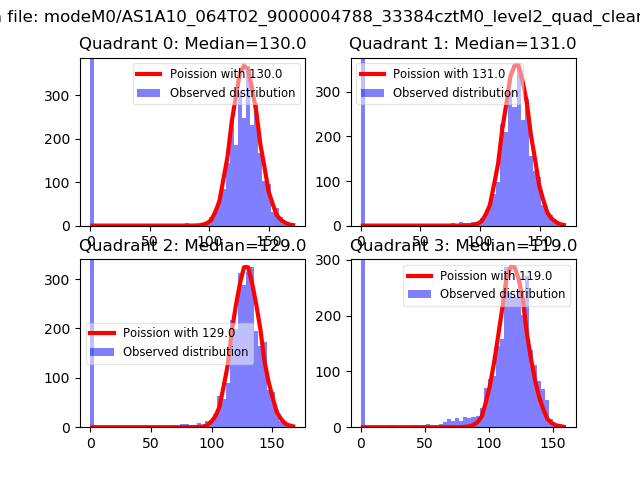 |
 |
| Quadrant-wise count rates Data is divided into 100 sec bins |
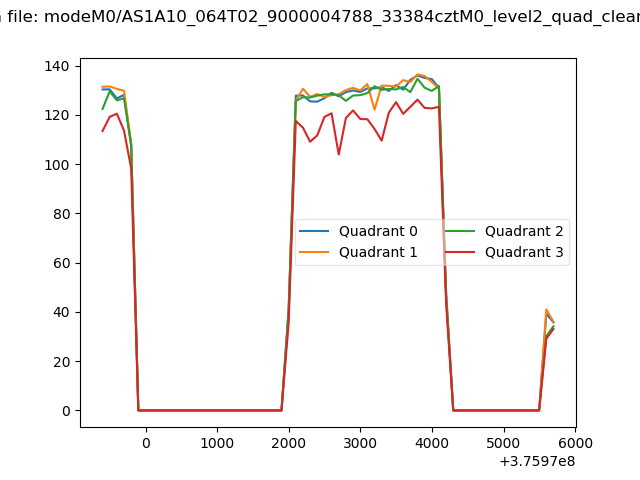 |
|
| Module-wise count rates for Quadrant A Data is divided into 100 sec bins |
 |
 |
| Module-wise count rates for Quadrant B Data is divided into 100 sec bins |
 |
 |
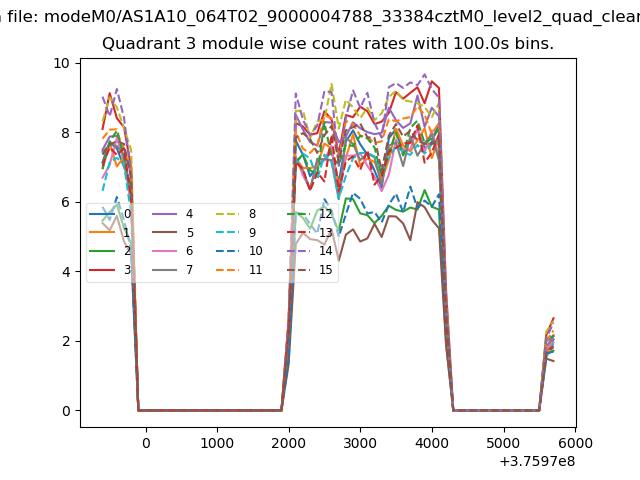
| Module-wise count rates for Quadrant C Data is divided into 100 sec bins |
 |
 |
| Module-wise count rates for Quadrant D Data is divided into 100 sec bins |
 |
 |
| Parameter | Plot |
|---|---|
| CZT HV Monitor |  |
| D_VDD | 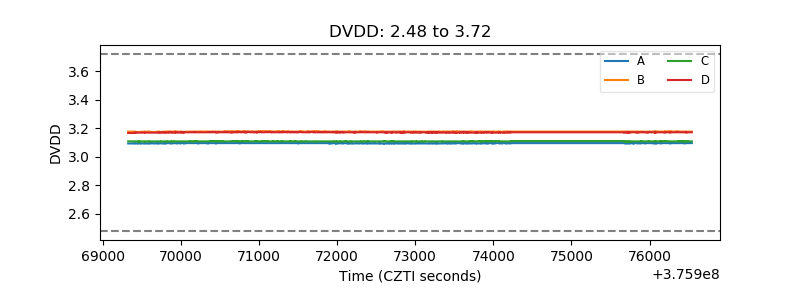 |
| Temperature 1 | 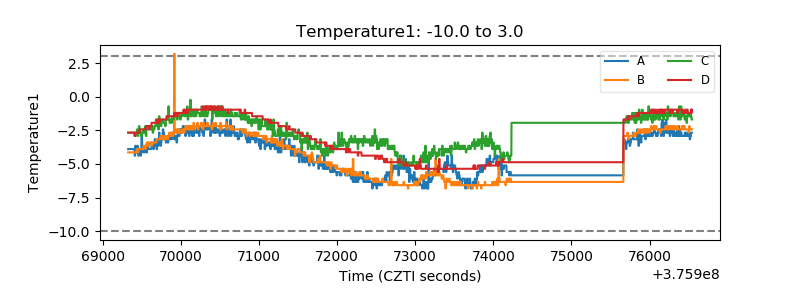 |
| Veto HV Monitor | 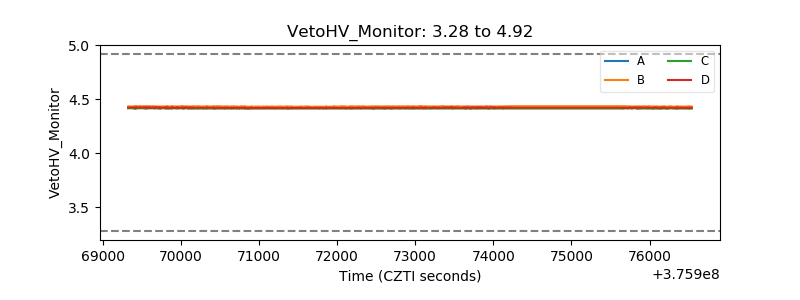 |
| Veto LLD | 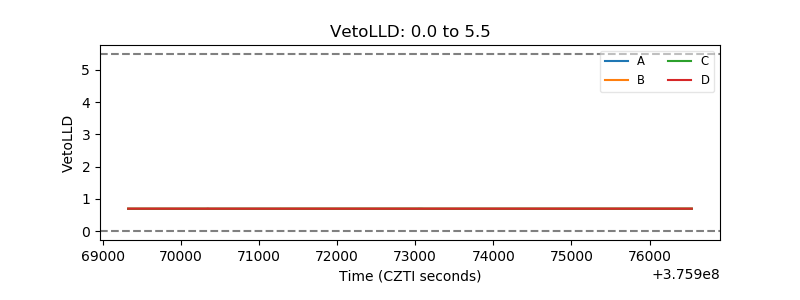 |
| Alpha Counter | 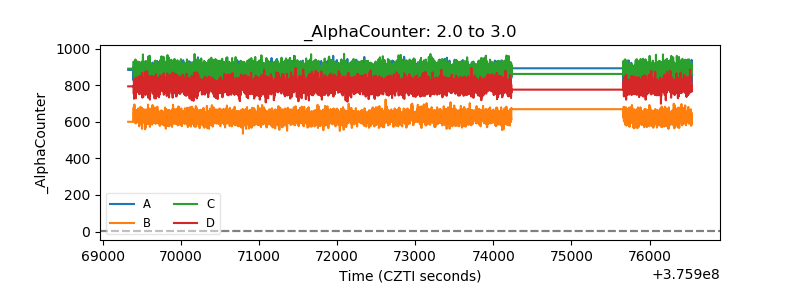 |
| _CPM_Rate | 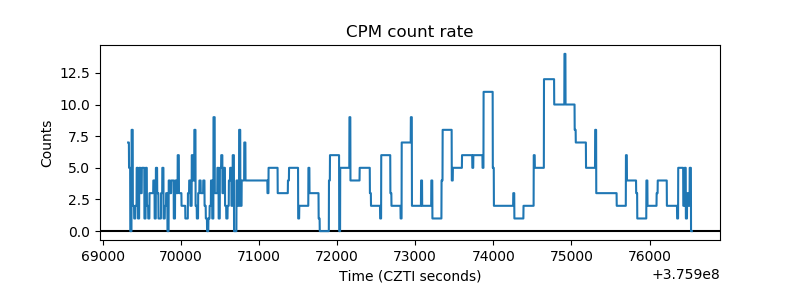 |
| CZT Counter | 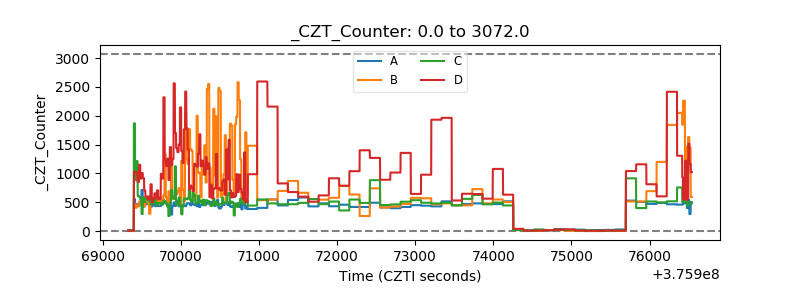 |
| +2.5 Volts monitor |  |
| +5 Volts monitor |  |
| _ROLL_ROT |  |
| _Roll_DEC | 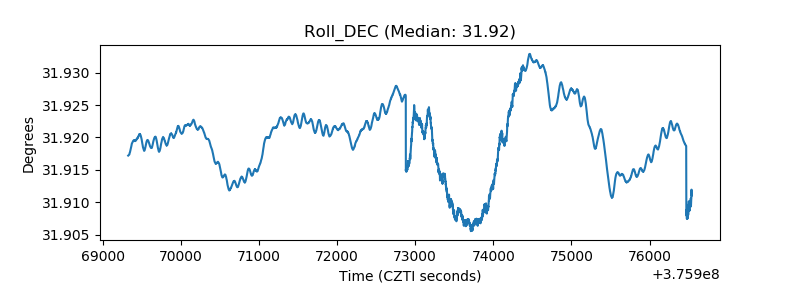 |
| _Roll_RA | 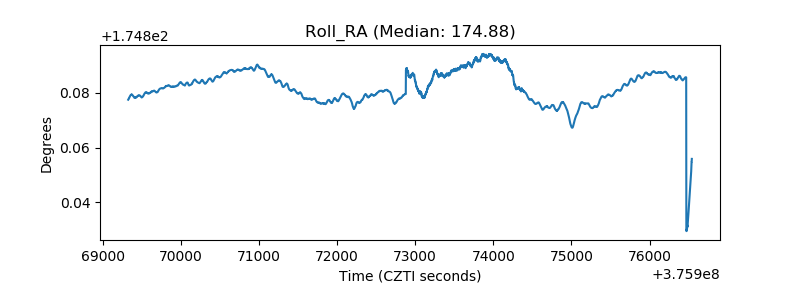 |
| Veto Counter | 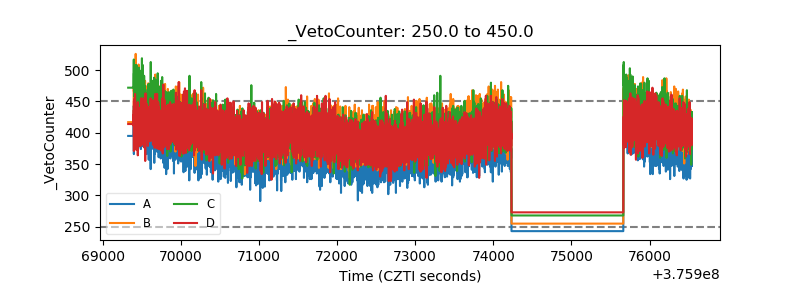 |