| Param | Original file | Final file |
|---|---|---|
| Filename | modeM0/AS1A10_064T02_9000004788_33388cztM0_level2.evt | modeM0/AS1A10_064T02_9000004788_33388cztM0_level2_quad_clean.evt |
| Size (bytes) | 1,084,371,840 | 150,022,080 |
| Size | 1.0 GB | 143.1 MB |
| Events in quadrant A | 5,504,262 | 959,485 |
| Events in quadrant B | 7,711,882 | 958,887 |
| Events in quadrant C | 6,190,916 | 949,567 |
| Events in quadrant D | 12,639,875 | 861,216 |
| Mode M9 | |||
|---|---|---|---|
| Quadrant | BADHDUFLAG | Total packets | Discarded packets |
| A | 0 | 32 | 0 |
| B | 0 | 32 | 0 |
| C | 0 | 32 | 0 |
| D | 0 | 33 | 0 |
| Mode M0 | |||
|---|---|---|---|
| Quadrant | BADHDUFLAG | Total packets | Discarded packets |
| A | 0 | 24624 | 634 |
| B | 0 | 31422 | 805 |
| C | 0 | 26075 | 678 |
| D | 0 | 47633 | 1819 |
| Mode SS | |||
|---|---|---|---|
| Quadrant | BADHDUFLAG | Total packets | Discarded packets |
| A | 0 | 246 | 6 |
| B | 0 | 245 | 5 |
| C | 0 | 243 | 8 |
| D | 0 | 246 | 6 |
| Quadrant | Total seconds | Saturated seconds | Saturation percentage |
|---|---|---|---|
| A | 11813 | 8 | 0.067722% |
| B | 11788 | 726 | 6.158806% |
| C | 11798 | 74 | 0.627225% |
| D | 11682 | 871 | 7.455915% |
Noise dominated data is calculated using 1-second bins in cleaned event files. If a bin has >2000 counts, and if more than 50% of those come from <1% of pixels, then it is considered to be noise-dominated and hence unusable.
| Quadrant | # 1 sec bins | Bins with >0 counts | Bins with >2000 counts | High rate bins dominated by noise | Noise dominated (total time) | Noise dominated (detector-on time) | Marked lightcurve |
|---|---|---|---|---|---|---|---|
| A | 14725 | 11944 | 0 | 0 | 0.00% | 0.00% | 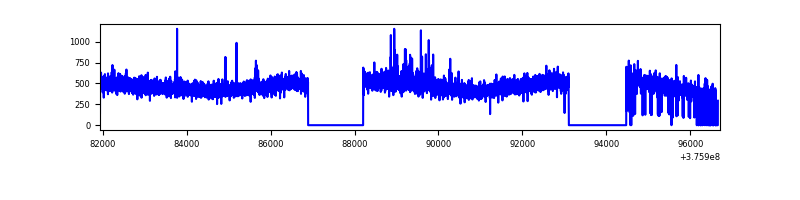 |
| B | 14774 | 11948 | 513 | 513 | 3.47% | 4.29% | 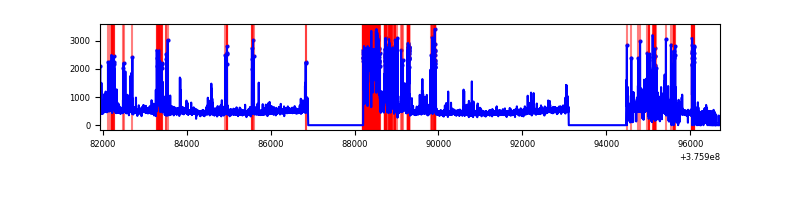 |
| C | 14742 | 11928 | 60 | 60 | 0.41% | 0.50% | 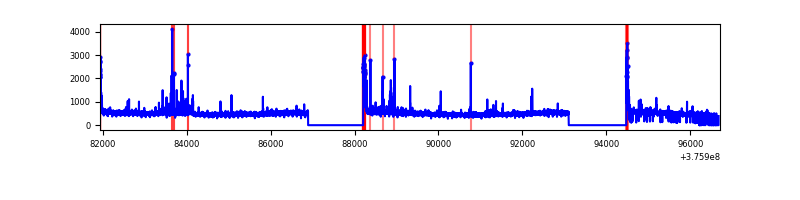 |
| D | 14701 | 11833 | 712 | 712 | 4.84% | 6.02% | 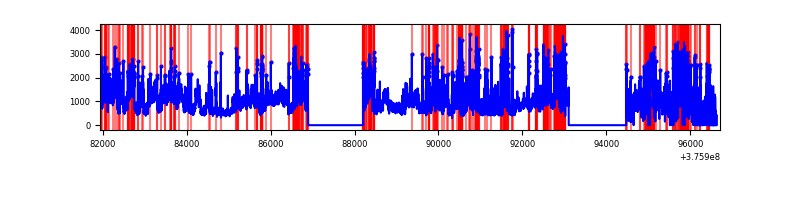 |
Top three noisy pixels from each quadrant. If the there are fewer than three noisy pixels in the level2.evt file, extra rows are filled as -1
| Pixel properties | Quadrant properties | ||||||
|---|---|---|---|---|---|---|---|
| Quadrant | DetID | PixID | Counts | Sigma | Mean | Median | Sigma |
| A | 12 | 16 | 70747 | 249.34 | 1383 | 1352 | 278.3 |
| A | 15 | 169 | 64544 | 227.05 | 1383 | 1352 | 278.3 |
| A | 12 | 194 | 20499 | 68.8 | 1383 | 1352 | 278.3 |
| B | 5 | 172 | 1054927 | 4122.16 | 1338 | 1304 | 255.6 |
| B | 0 | 219 | 494827 | 1930.84 | 1338 | 1304 | 255.6 |
| B | 5 | 255 | 260257 | 1013.12 | 1338 | 1304 | 255.6 |
| C | 15 | 214 | 499154 | 1618.67 | 1337 | 1348 | 307.5 |
| C | 0 | 10 | 220235 | 711.73 | 1337 | 1348 | 307.5 |
| C | 1 | 23 | 128955 | 414.93 | 1337 | 1348 | 307.5 |
| D | 8 | 195 | 4332665 | 13362.96 | 1299 | 1259 | 324.1 |
| D | 1 | 52 | 923553 | 2845.4 | 1299 | 1259 | 324.1 |
| D | 2 | 250 | 505180 | 1554.66 | 1299 | 1259 | 324.1 |
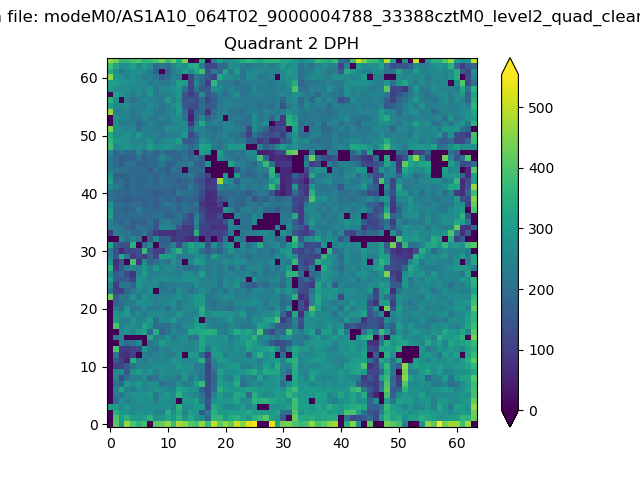
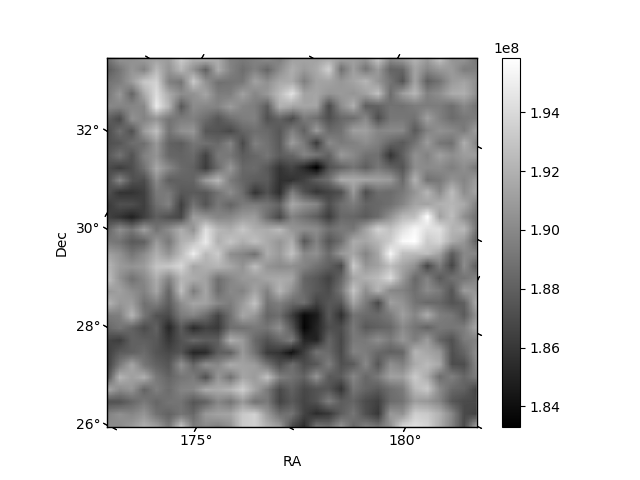
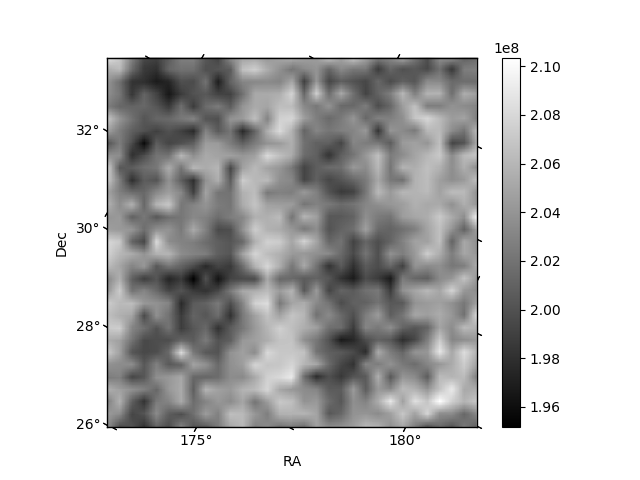
Histogram calculated using DETX and DETY for each event in the final _common_clean file
| Quadrant A | 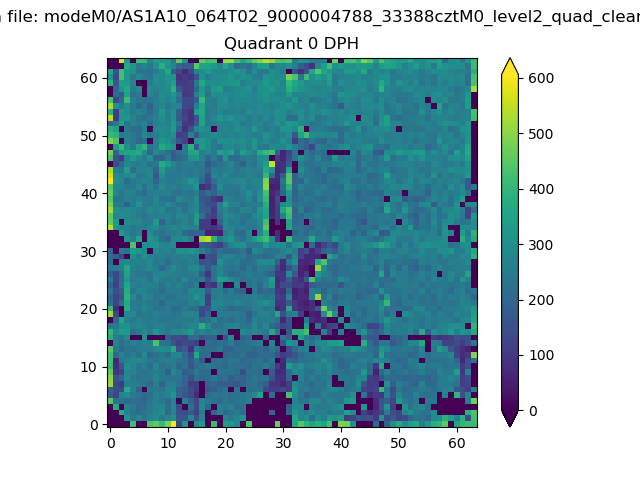 |
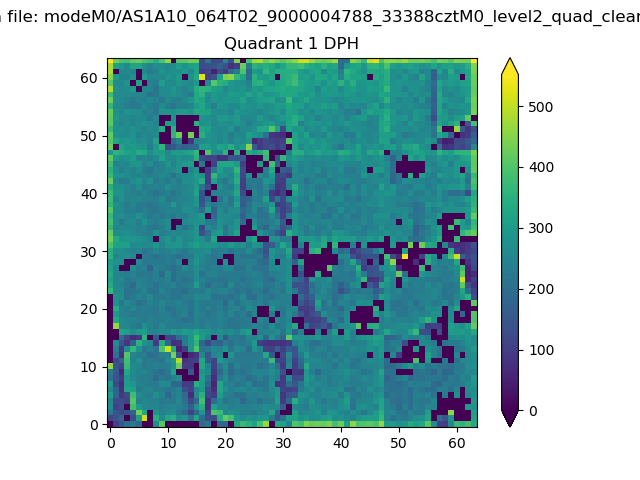 |
Quadrant B |
|---|---|---|---|
| Quadrant D | 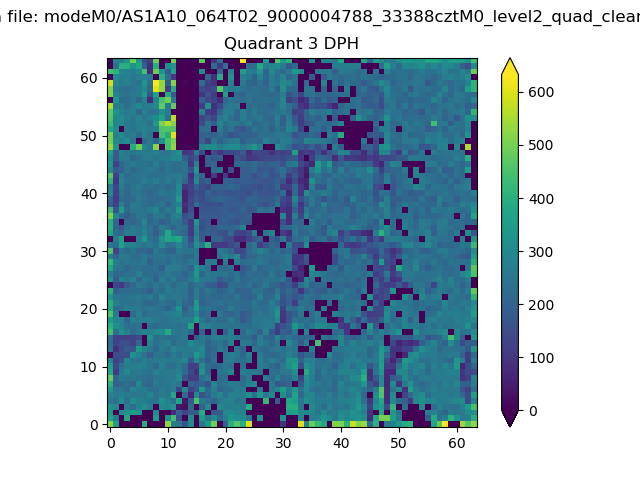 |
 |
Quadrant C |
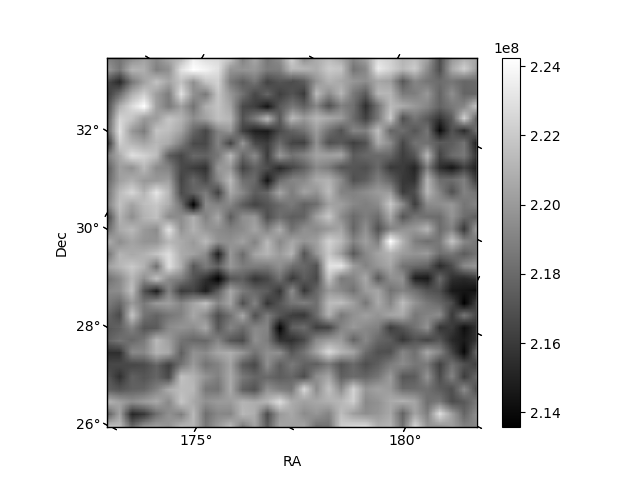
| Plot type | Count rate plots | Images |
|---|---|---|
| Comparison with Poisson distribution Blue bars denote a histogram of data divided into 1 sec bins. Red curve is a Poisson curve with rate = median count rate of data. |
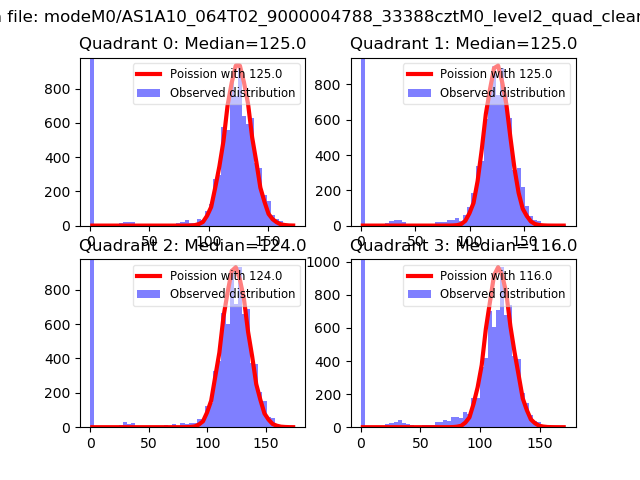 |
 |
| Quadrant-wise count rates Data is divided into 100 sec bins |
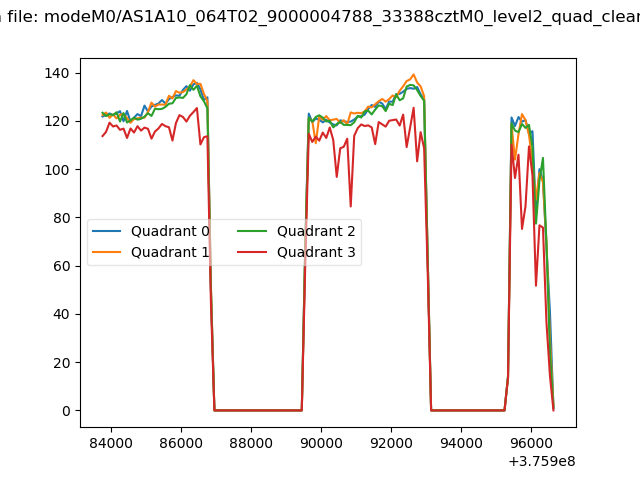 |
|
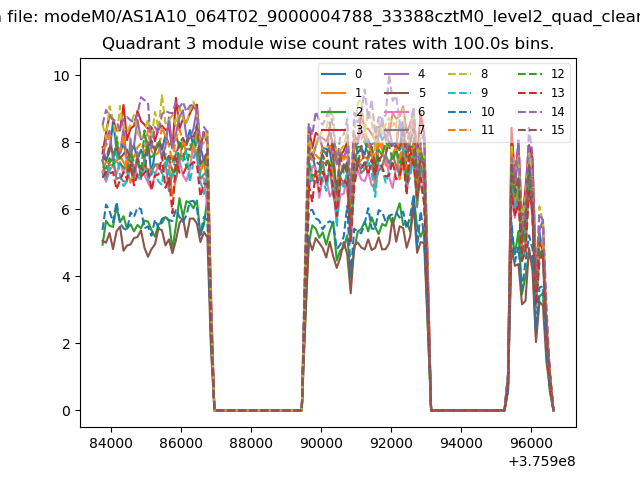
| Module-wise count rates for Quadrant A Data is divided into 100 sec bins |
 |
 |
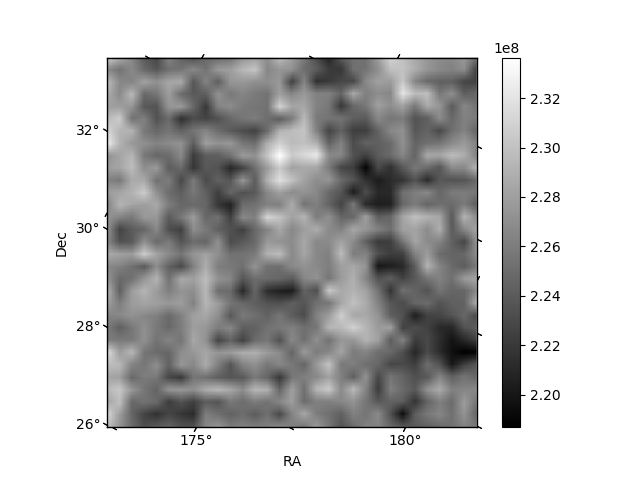
| Module-wise count rates for Quadrant B Data is divided into 100 sec bins |
 |
 |
| Module-wise count rates for Quadrant C Data is divided into 100 sec bins |
 |
 |
| Module-wise count rates for Quadrant D Data is divided into 100 sec bins |
 |
 |
| Parameter | Plot |
|---|---|
| CZT HV Monitor |  |
| D_VDD | 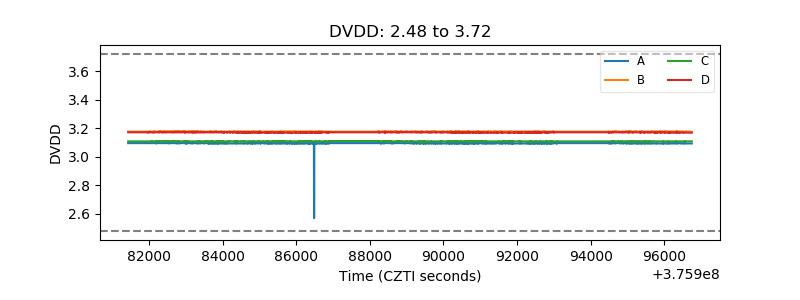 |
| Temperature 1 | 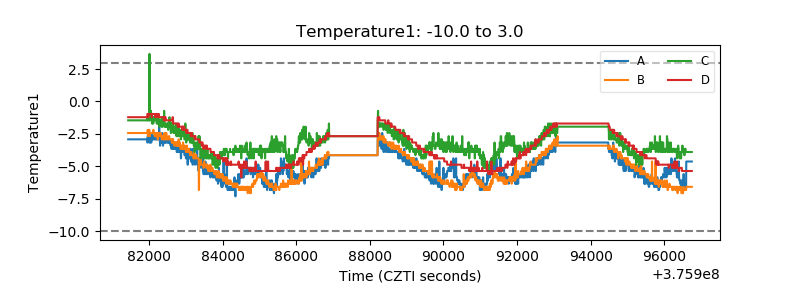 |
| Veto HV Monitor | 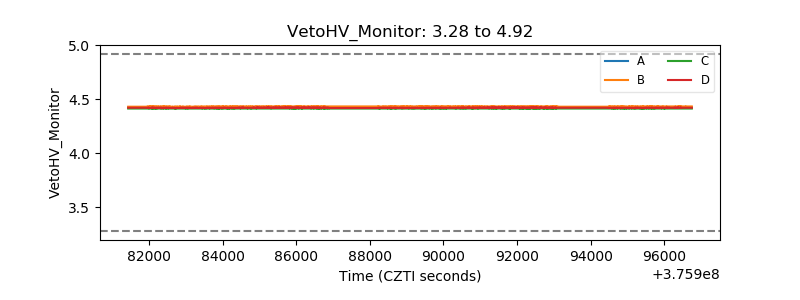 |
| Veto LLD | 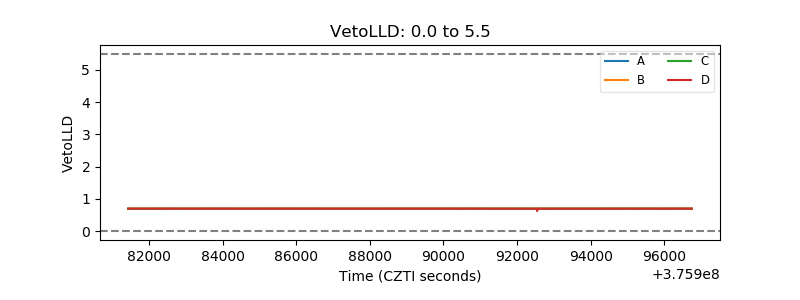 |
| Alpha Counter | 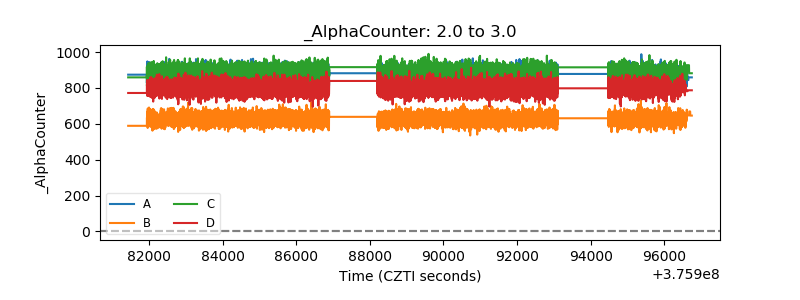 |
| _CPM_Rate | 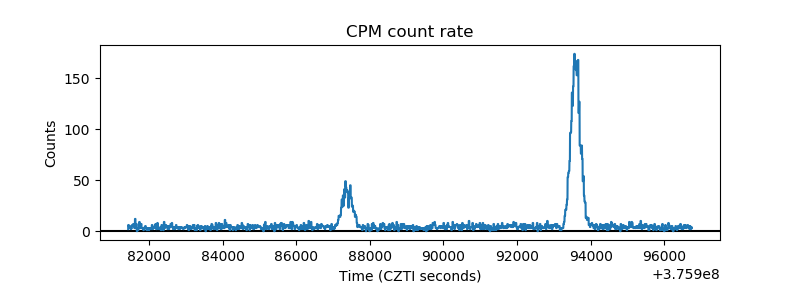 |
| CZT Counter | 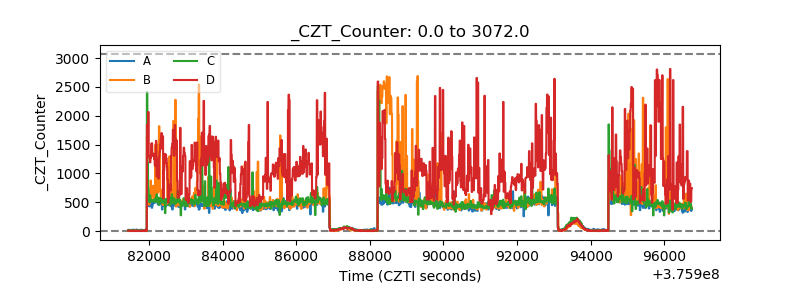 |
| +2.5 Volts monitor |  |
| +5 Volts monitor |  |
| _ROLL_ROT | 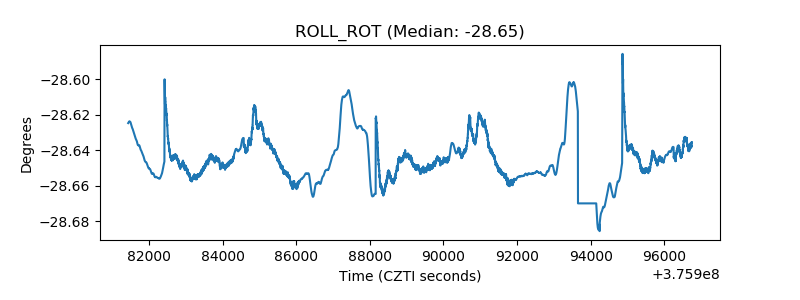 |
| _Roll_DEC | 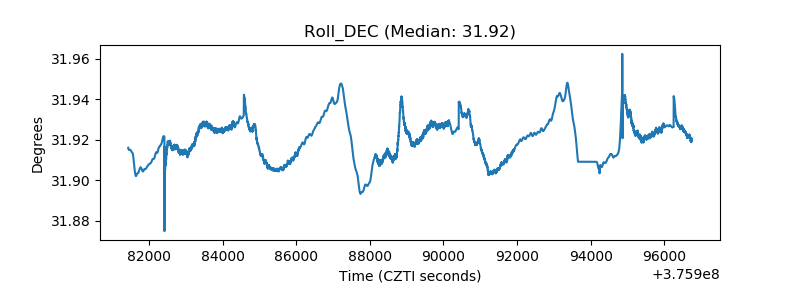 |
| _Roll_RA | 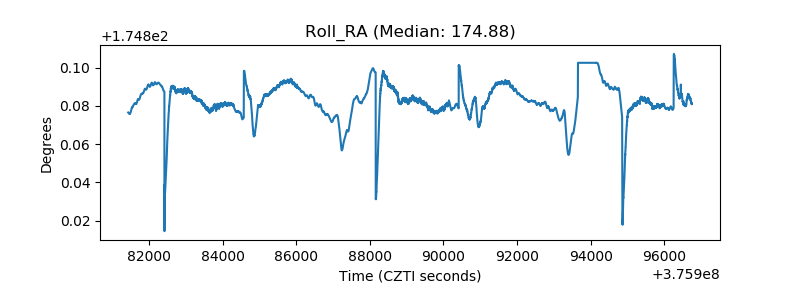 |
| Veto Counter |  |