| Param | Original file | Final file |
|---|---|---|
| Filename | modeM0/AS1A10_064T02_9000004788_33391cztM0_level2.evt | modeM0/AS1A10_064T02_9000004788_33391cztM0_level2_quad_clean.evt |
| Size (bytes) | 501,923,520 | 88,093,440 |
| Size | 478.7 MB | 84.0 MB |
| Events in quadrant A | 2,492,024 | 594,553 |
| Events in quadrant B | 3,334,216 | 601,193 |
| Events in quadrant C | 3,114,508 | 588,462 |
| Events in quadrant D | 5,890,461 | 502,009 |
| Mode M9 | |||
|---|---|---|---|
| Quadrant | BADHDUFLAG | Total packets | Discarded packets |
| A | 0 | 21 | 0 |
| B | 0 | 21 | 0 |
| C | 0 | 21 | 0 |
| D | 0 | 22 | 0 |
| Mode M0 | |||
|---|---|---|---|
| Quadrant | BADHDUFLAG | Total packets | Discarded packets |
| A | 0 | 10997 | 3 |
| B | 0 | 13575 | 2 |
| C | 0 | 12571 | 2 |
| D | 0 | 21284 | 2 |
| Mode SS | |||
|---|---|---|---|
| Quadrant | BADHDUFLAG | Total packets | Discarded packets |
| A | 0 | 112 | 0 |
| B | 0 | 112 | 0 |
| C | 0 | 112 | 0 |
| D | 0 | 112 | 0 |
| Quadrant | Total seconds | Saturated seconds | Saturation percentage |
|---|---|---|---|
| A | 5444 | 6 | 0.110213% |
| B | 5444 | 221 | 4.059515% |
| C | 5444 | 119 | 2.185893% |
| D | 5444 | 926 | 17.009552% |
Noise dominated data is calculated using 1-second bins in cleaned event files. If a bin has >2000 counts, and if more than 50% of those come from <1% of pixels, then it is considered to be noise-dominated and hence unusable.
| Quadrant | # 1 sec bins | Bins with >0 counts | Bins with >2000 counts | High rate bins dominated by noise | Noise dominated (total time) | Noise dominated (detector-on time) | Marked lightcurve |
|---|---|---|---|---|---|---|---|
| A | 7177 | 5445 | 0 | 0 | 0.00% | 0.00% | 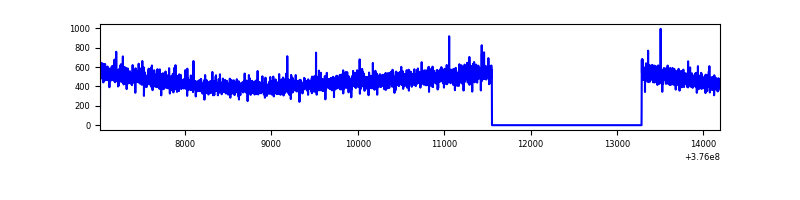 |
| B | 7177 | 5445 | 126 | 126 | 1.76% | 2.31% | 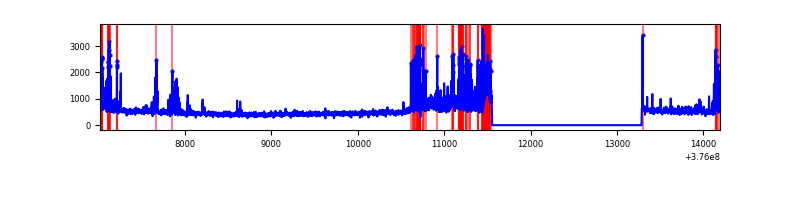 |
| C | 7177 | 5445 | 89 | 89 | 1.24% | 1.63% | 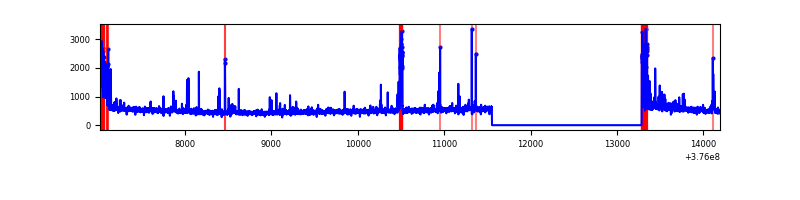 |
| D | 7177 | 5445 | 868 | 868 | 12.09% | 15.94% | 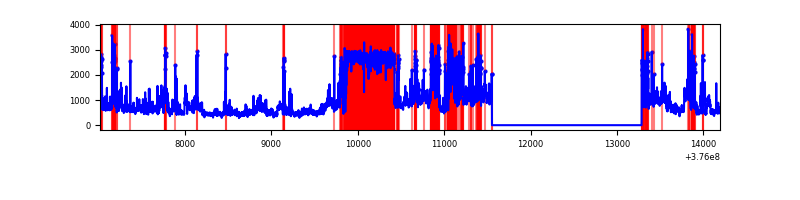 |
Top three noisy pixels from each quadrant. If the there are fewer than three noisy pixels in the level2.evt file, extra rows are filled as -1
| Pixel properties | Quadrant properties | ||||||
|---|---|---|---|---|---|---|---|
| Quadrant | DetID | PixID | Counts | Sigma | Mean | Median | Sigma |
| A | 13 | 254 | 8077 | 57.67 | 644 | 631 | 129.1 |
| A | 3 | 137 | 6293 | 43.85 | 644 | 631 | 129.1 |
| A | 0 | 226 | 5544 | 38.05 | 644 | 631 | 129.1 |
| B | 5 | 172 | 467746 | 3839.09 | 637 | 621 | 121.7 |
| B | 0 | 219 | 128028 | 1047.1 | 637 | 621 | 121.7 |
| B | 5 | 255 | 67951 | 553.36 | 637 | 621 | 121.7 |
| C | 0 | 10 | 232955 | 1611.19 | 622 | 629 | 144.2 |
| C | 15 | 214 | 231948 | 1604.2 | 622 | 629 | 144.2 |
| C | 1 | 23 | 135043 | 932.17 | 622 | 629 | 144.2 |
| D | 1 | 52 | 1447888 | 10359.36 | 567 | 551 | 139.7 |
| D | 8 | 195 | 1084792 | 7760.49 | 567 | 551 | 139.7 |
| D | 13 | 249 | 276625 | 1976.01 | 567 | 551 | 139.7 |
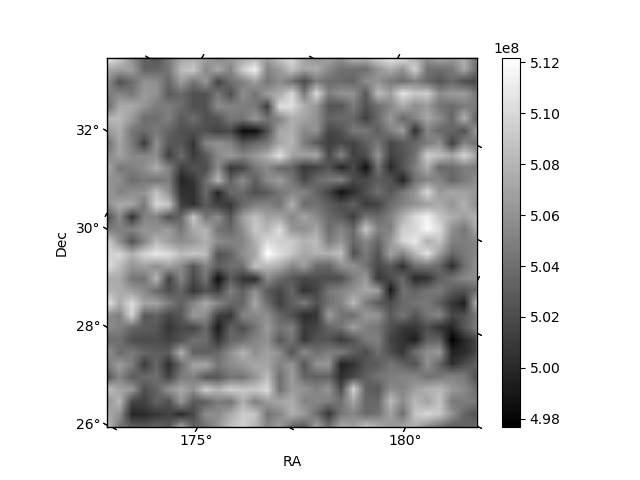
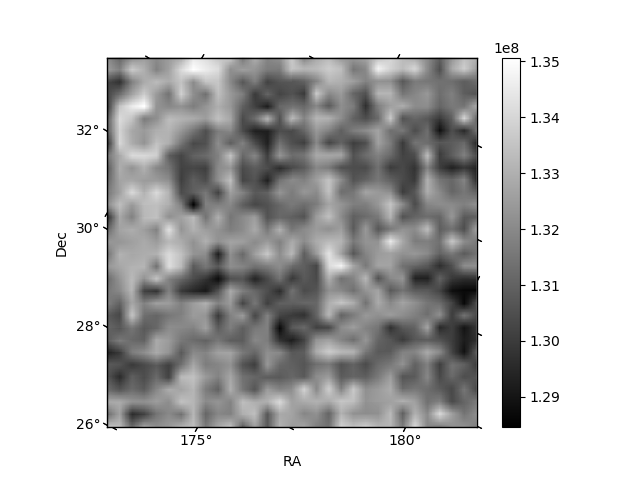
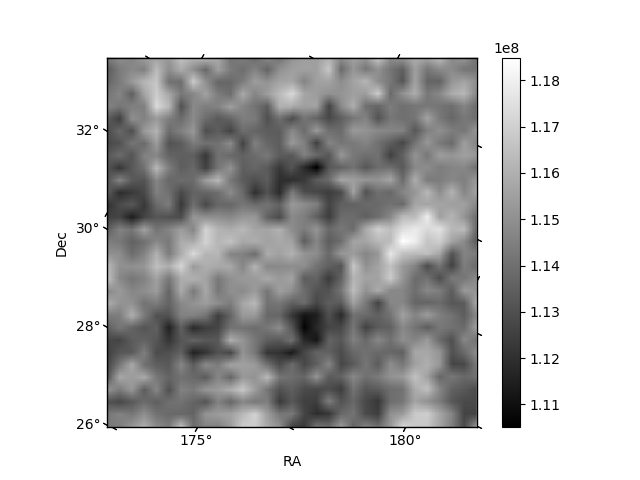
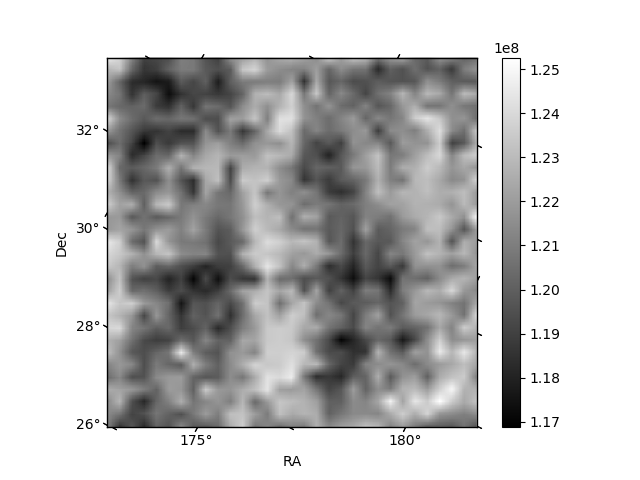
Histogram calculated using DETX and DETY for each event in the final _common_clean file
| Quadrant A | 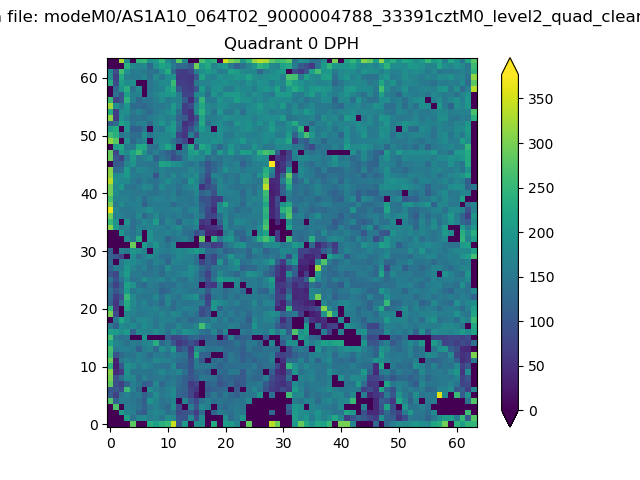 |
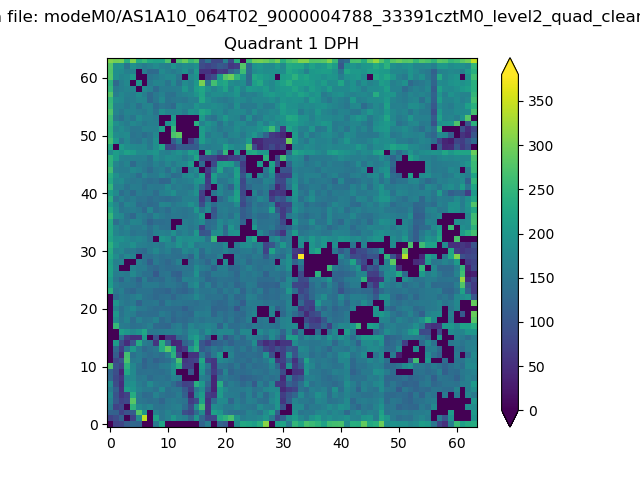 |
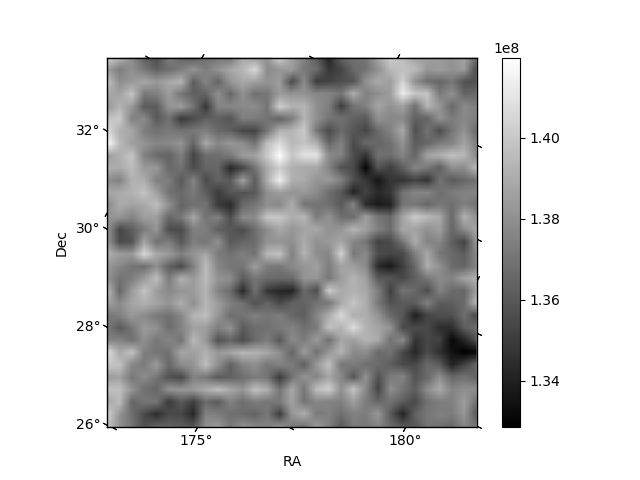
Quadrant B |
|---|---|---|---|
| Quadrant D | 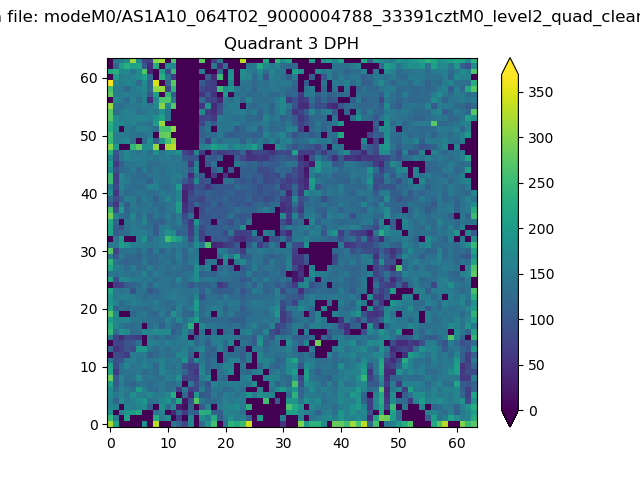 |
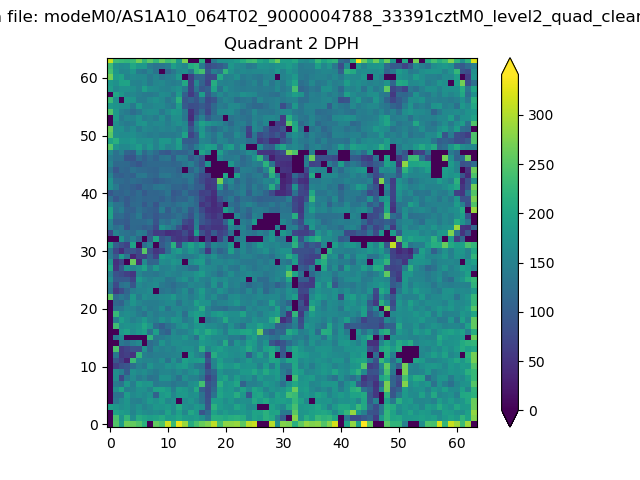 |
Quadrant C |
| Plot type | Count rate plots | Images |
|---|---|---|
| Comparison with Poisson distribution Blue bars denote a histogram of data divided into 1 sec bins. Red curve is a Poisson curve with rate = median count rate of data. |
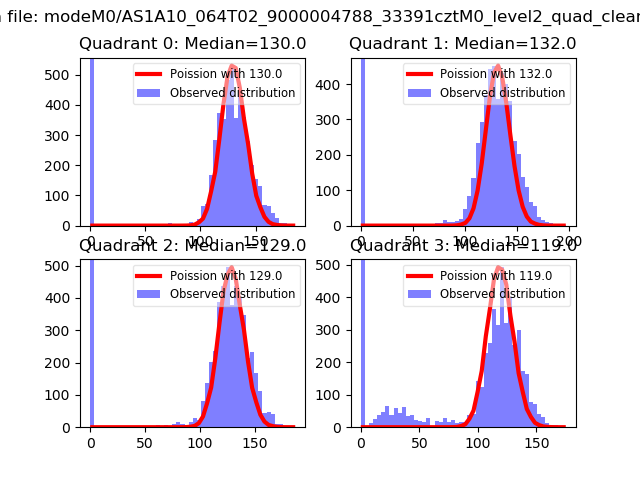 |
 |
| Quadrant-wise count rates Data is divided into 100 sec bins |
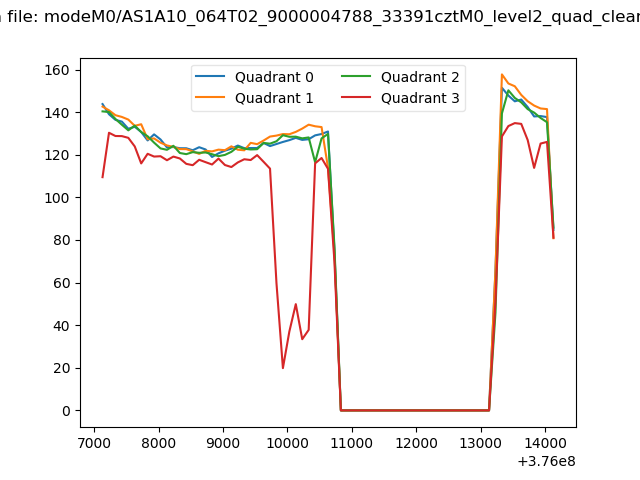 |
|
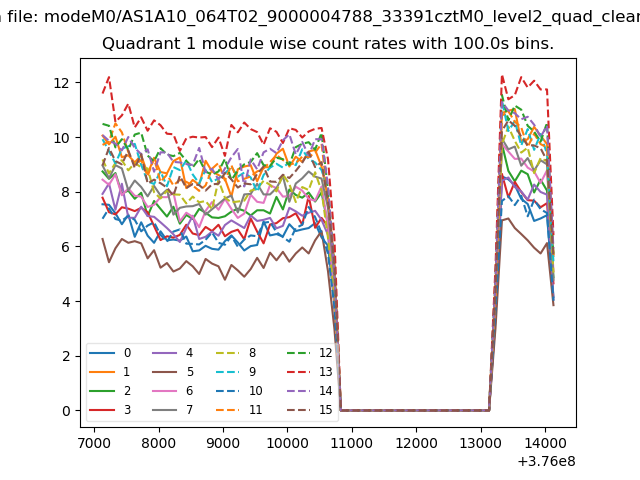
| Module-wise count rates for Quadrant A Data is divided into 100 sec bins |
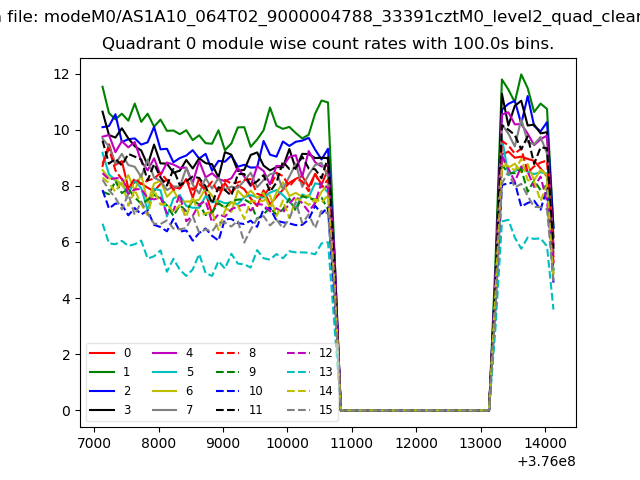 |
 |
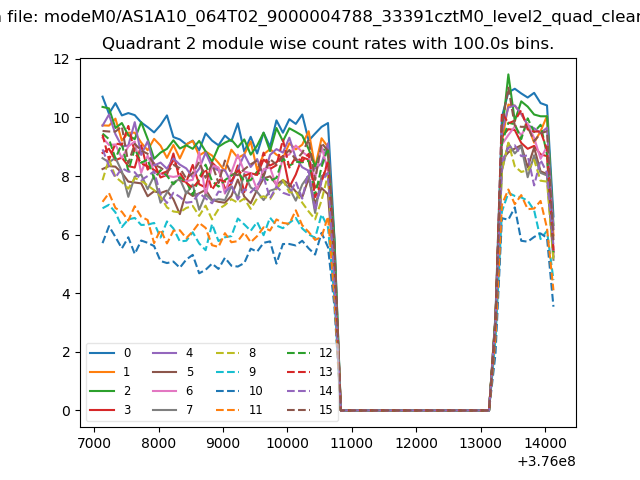
| Module-wise count rates for Quadrant B Data is divided into 100 sec bins |
 |
 |
| Module-wise count rates for Quadrant C Data is divided into 100 sec bins |
 |
 |
| Module-wise count rates for Quadrant D Data is divided into 100 sec bins |
 |
 |
| Parameter | Plot |
|---|---|
| CZT HV Monitor |  |
| D_VDD | 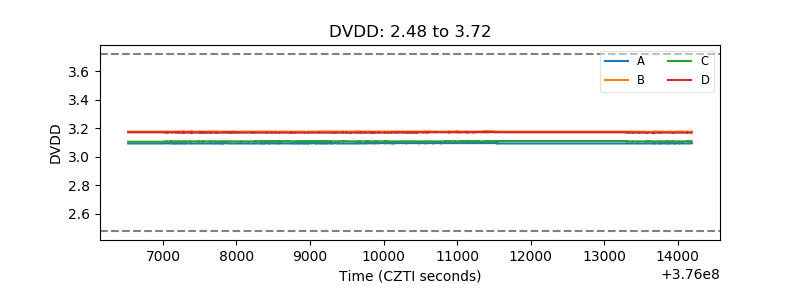 |
| Temperature 1 | 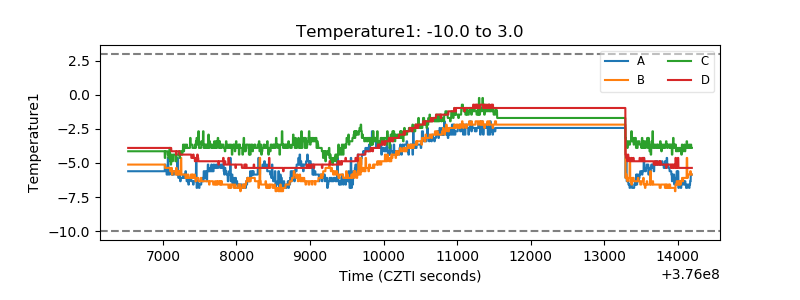 |
| Veto HV Monitor | 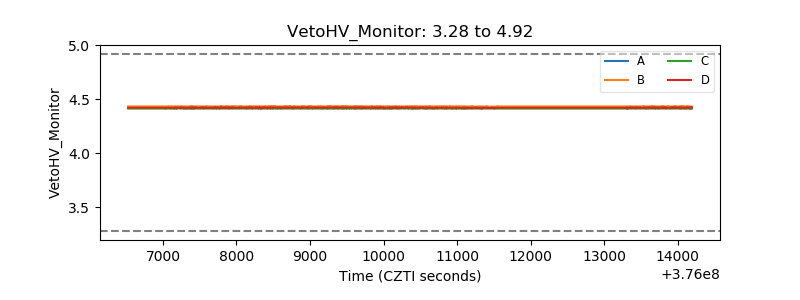 |
| Veto LLD | 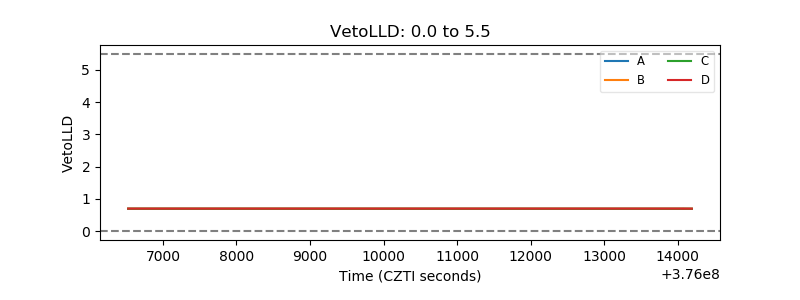 |
| Alpha Counter | 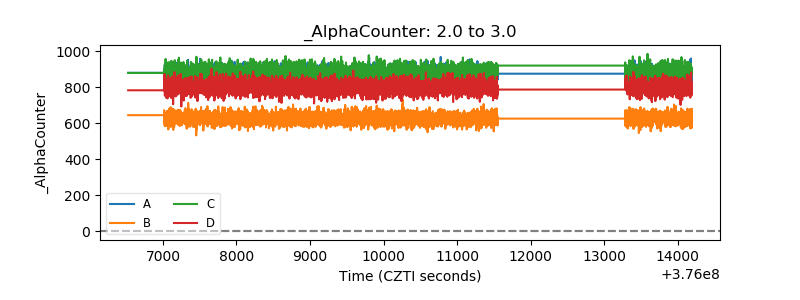 |
| _CPM_Rate | 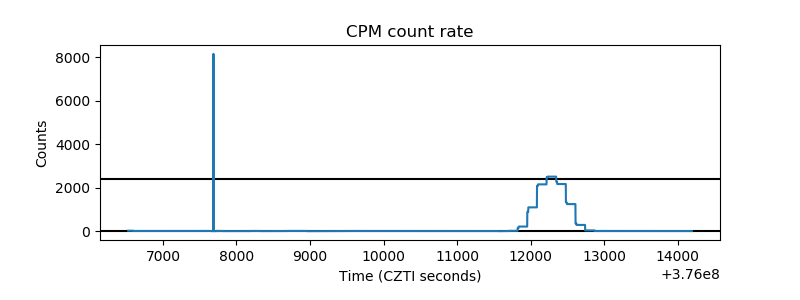 |
| CZT Counter | 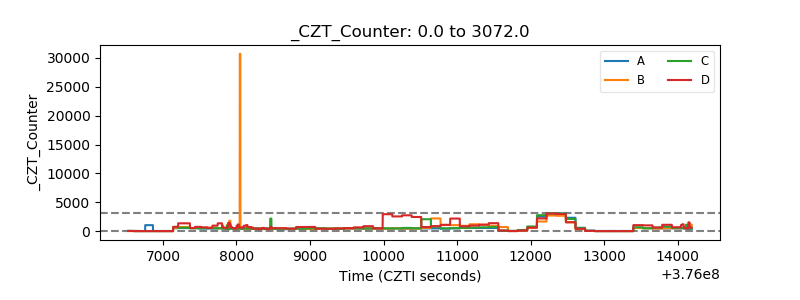 |
| +2.5 Volts monitor | 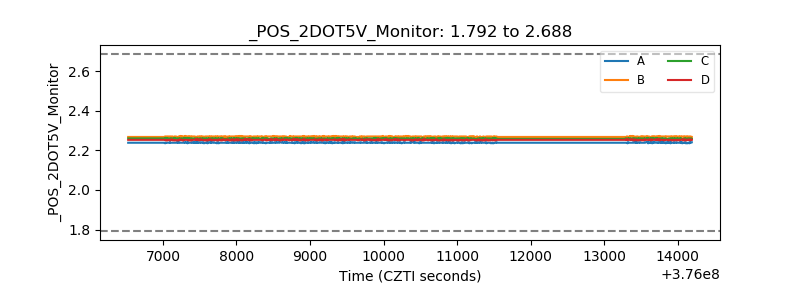 |
| +5 Volts monitor | 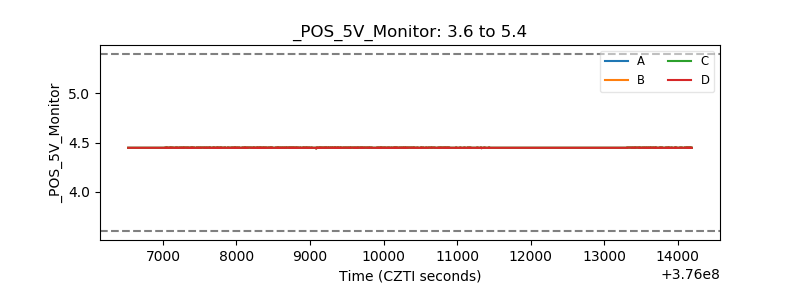 |
| _ROLL_ROT | 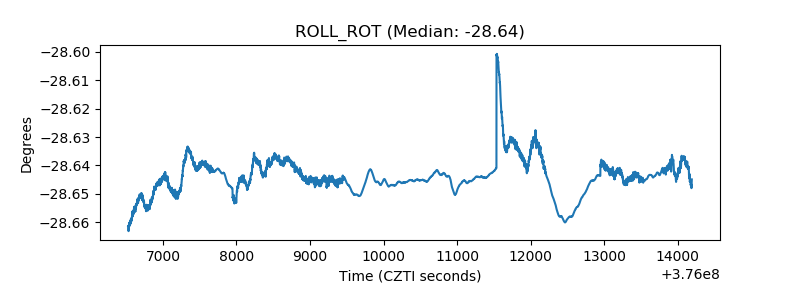 |
| _Roll_DEC | 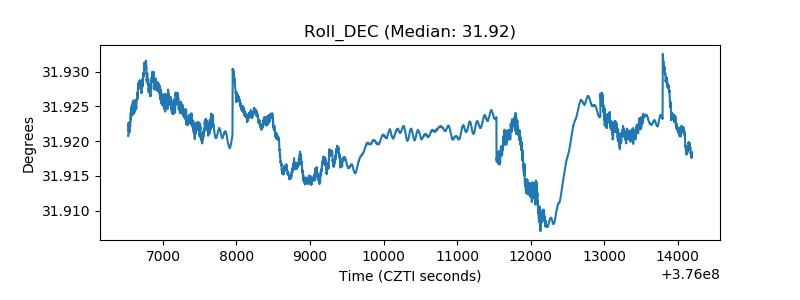 |
| _Roll_RA | 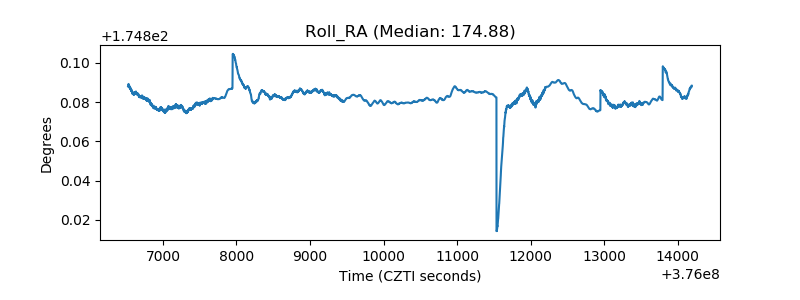 |
| Veto Counter | 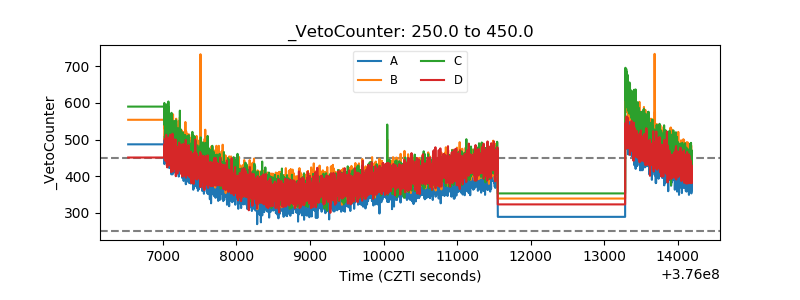 |