| Param | Original file | Final file |
|---|---|---|
| Filename | modeM0/AS1A10_064T02_9000004788_33392cztM0_level2.evt | modeM0/AS1A10_064T02_9000004788_33392cztM0_level2_quad_clean.evt |
| Size (bytes) | 510,963,840 | 89,997,120 |
| Size | 487.3 MB | 85.8 MB |
| Events in quadrant A | 2,546,190 | 605,471 |
| Events in quadrant B | 3,469,678 | 620,132 |
| Events in quadrant C | 4,152,045 | 567,251 |
| Events in quadrant D | 4,935,562 | 549,247 |
| Mode M9 | |||
|---|---|---|---|
| Quadrant | BADHDUFLAG | Total packets | Discarded packets |
| A | 0 | 26 | 0 |
| B | 0 | 26 | 0 |
| C | 0 | 26 | 0 |
| D | 0 | 27 | 0 |
| Mode M0 | |||
|---|---|---|---|
| Quadrant | BADHDUFLAG | Total packets | Discarded packets |
| A | 0 | 11043 | 3 |
| B | 0 | 13869 | 2 |
| C | 0 | 15764 | 2 |
| D | 0 | 18480 | 2 |
| Mode SS | |||
|---|---|---|---|
| Quadrant | BADHDUFLAG | Total packets | Discarded packets |
| A | 0 | 112 | 0 |
| B | 0 | 112 | 0 |
| C | 0 | 112 | 0 |
| D | 0 | 112 | 0 |
| Quadrant | Total seconds | Saturated seconds | Saturation percentage |
|---|---|---|---|
| A | 5473 | 6 | 0.109629% |
| B | 5473 | 227 | 4.147634% |
| C | 5473 | 470 | 8.587612% |
| D | 5473 | 259 | 4.732322% |
Noise dominated data is calculated using 1-second bins in cleaned event files. If a bin has >2000 counts, and if more than 50% of those come from <1% of pixels, then it is considered to be noise-dominated and hence unusable.
| Quadrant | # 1 sec bins | Bins with >0 counts | Bins with >2000 counts | High rate bins dominated by noise | Noise dominated (total time) | Noise dominated (detector-on time) | Marked lightcurve |
|---|---|---|---|---|---|---|---|
| A | 7357 | 5474 | 0 | 0 | 0.00% | 0.00% | 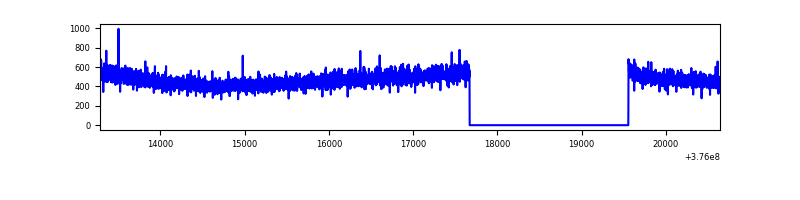 |
| B | 7357 | 5474 | 145 | 145 | 1.97% | 2.65% | 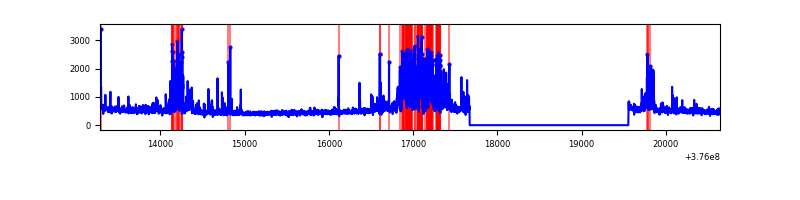 |
| C | 7357 | 5474 | 405 | 405 | 5.50% | 7.40% | 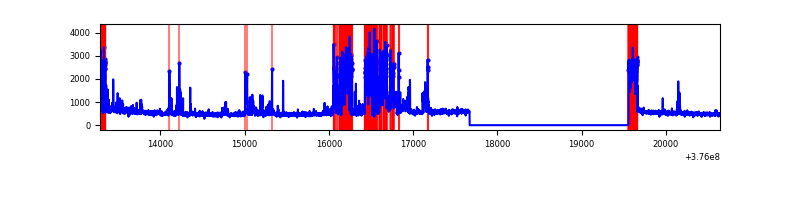 |
| D | 7357 | 5474 | 223 | 223 | 3.03% | 4.07% | 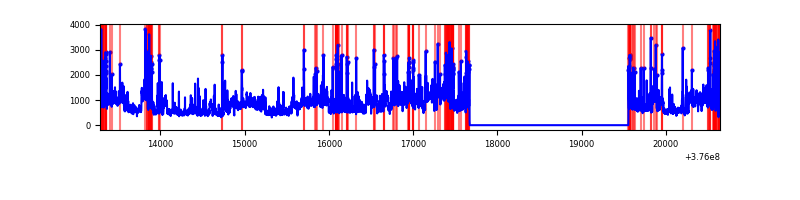 |
Top three noisy pixels from each quadrant. If the there are fewer than three noisy pixels in the level2.evt file, extra rows are filled as -1
| Pixel properties | Quadrant properties | ||||||
|---|---|---|---|---|---|---|---|
| Quadrant | DetID | PixID | Counts | Sigma | Mean | Median | Sigma |
| A | 13 | 254 | 9283 | 65.7 | 657 | 645 | 131.5 |
| A | 3 | 137 | 6061 | 41.19 | 657 | 645 | 131.5 |
| A | 0 | 226 | 5606 | 37.73 | 657 | 645 | 131.5 |
| B | 5 | 172 | 563388 | 4578.86 | 652 | 634 | 122.9 |
| B | 5 | 255 | 91210 | 736.97 | 652 | 634 | 122.9 |
| B | 15 | 85 | 76716 | 619.04 | 652 | 634 | 122.9 |
| C | 1 | 23 | 1072165 | 7647.15 | 609 | 615 | 140.1 |
| C | 0 | 10 | 347008 | 2472.04 | 609 | 615 | 140.1 |
| C | 15 | 214 | 226468 | 1611.81 | 609 | 615 | 140.1 |
| D | 8 | 195 | 1412129 | 9320.76 | 619 | 601 | 151.4 |
| D | 12 | 6 | 350451 | 2310.17 | 619 | 601 | 151.4 |
| D | 12 | 218 | 186392 | 1226.83 | 619 | 601 | 151.4 |
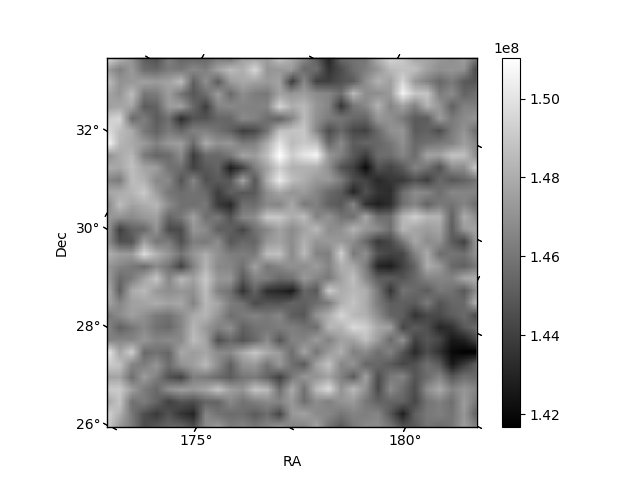
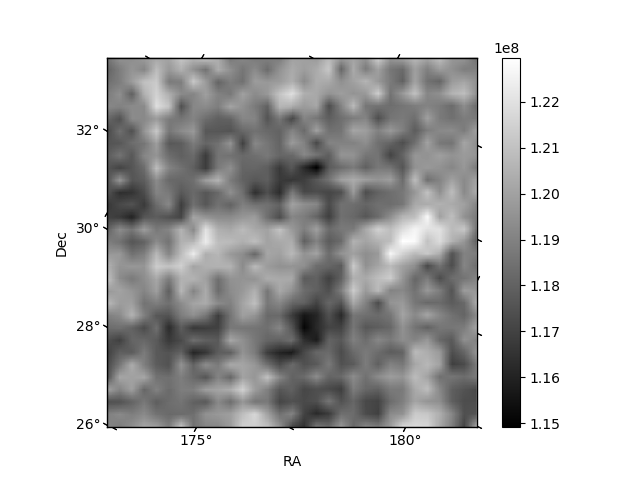
Histogram calculated using DETX and DETY for each event in the final _common_clean file
| Quadrant A | 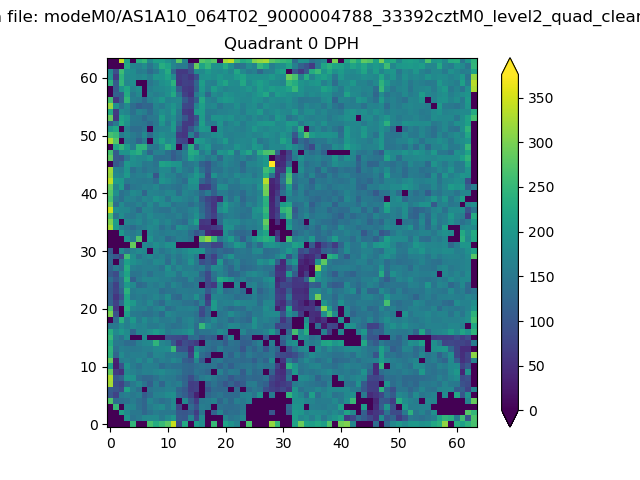 |
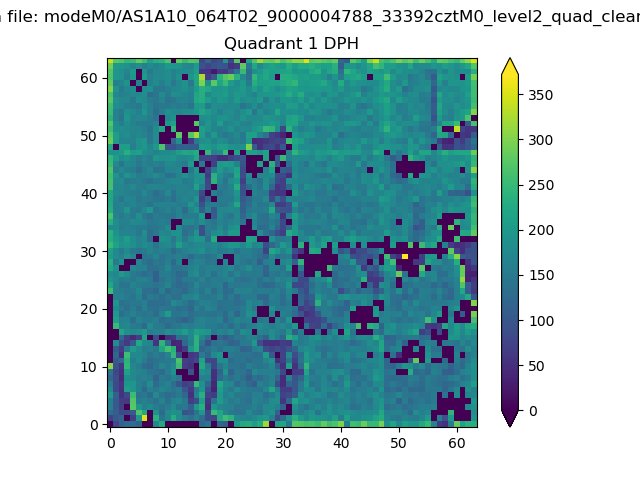 |
Quadrant B |
|---|---|---|---|
| Quadrant D | 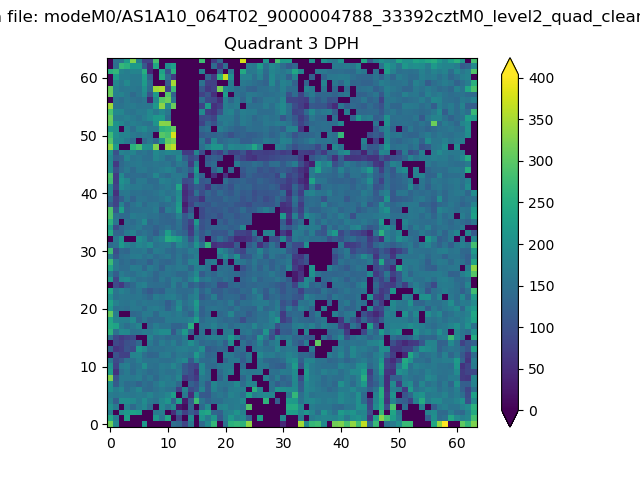 |
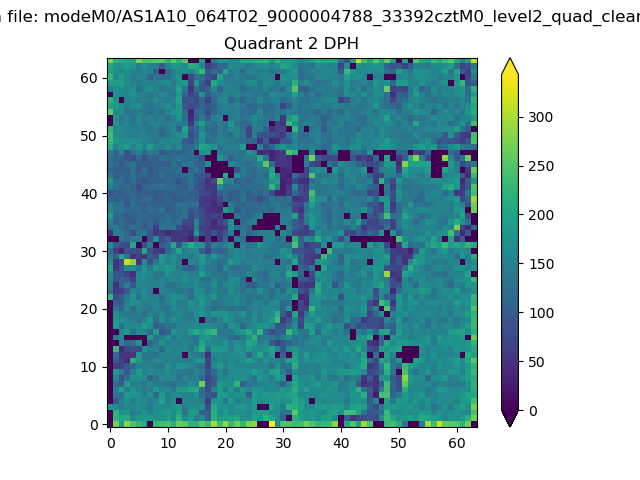 |
Quadrant C |
| Plot type | Count rate plots | Images |
|---|---|---|
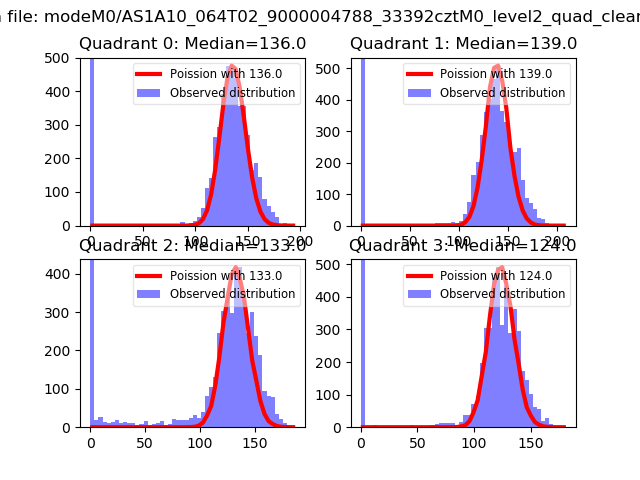
| Comparison with Poisson distribution Blue bars denote a histogram of data divided into 1 sec bins. Red curve is a Poisson curve with rate = median count rate of data. |
 |
 |
| Quadrant-wise count rates Data is divided into 100 sec bins |
 |
|
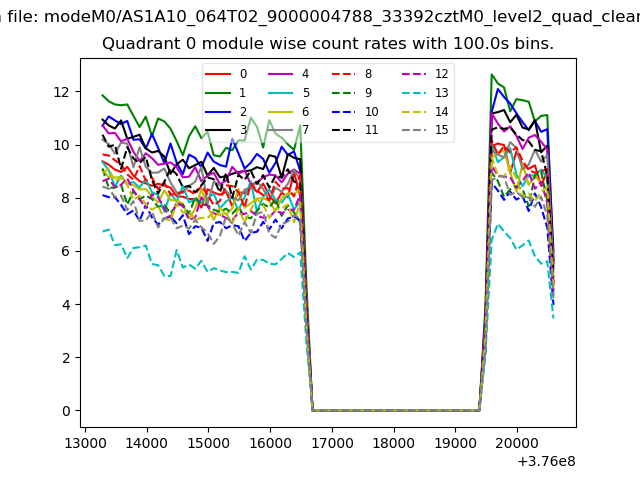
| Module-wise count rates for Quadrant A Data is divided into 100 sec bins |
 |
 |
| Module-wise count rates for Quadrant B Data is divided into 100 sec bins |
 |
 |
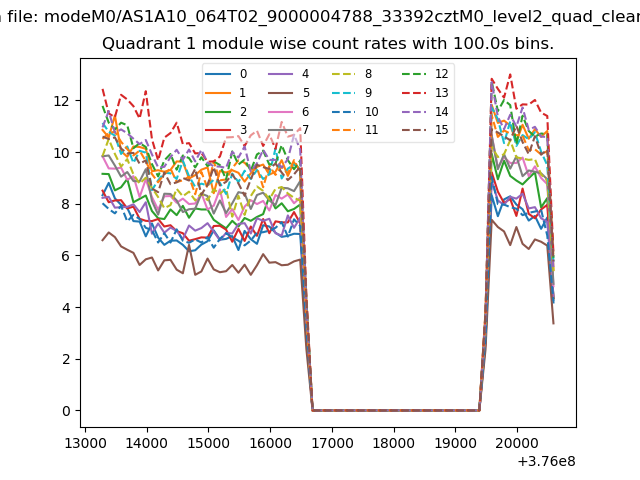
| Module-wise count rates for Quadrant C Data is divided into 100 sec bins |
 |
 |
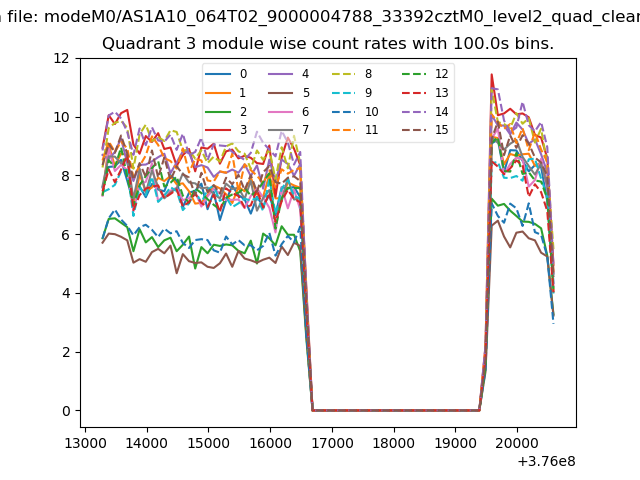
| Module-wise count rates for Quadrant D Data is divided into 100 sec bins |
 |
 |
| Parameter | Plot |
|---|---|
| CZT HV Monitor |  |
| D_VDD | 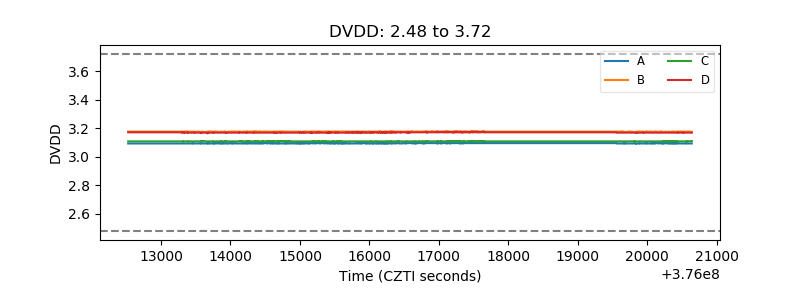 |
| Temperature 1 | 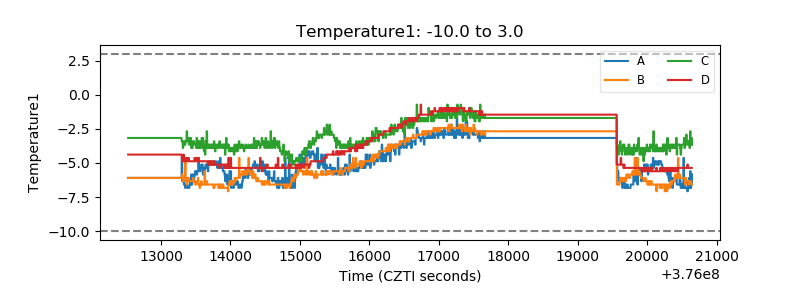 |
| Veto HV Monitor |  |
| Veto LLD | 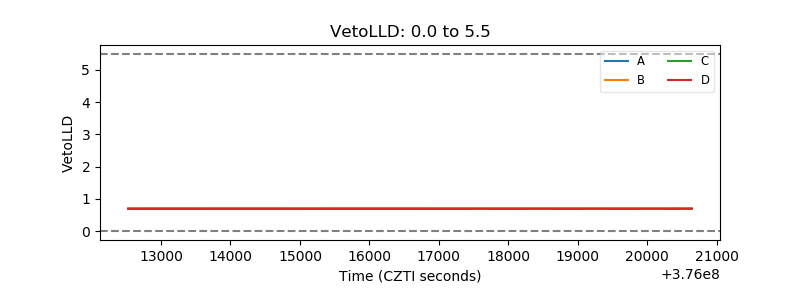 |
| Alpha Counter | 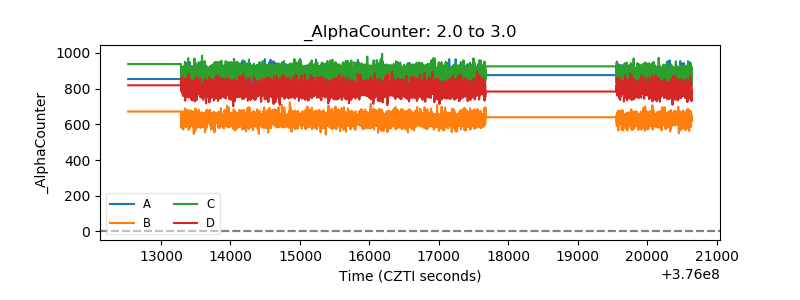 |
| _CPM_Rate | 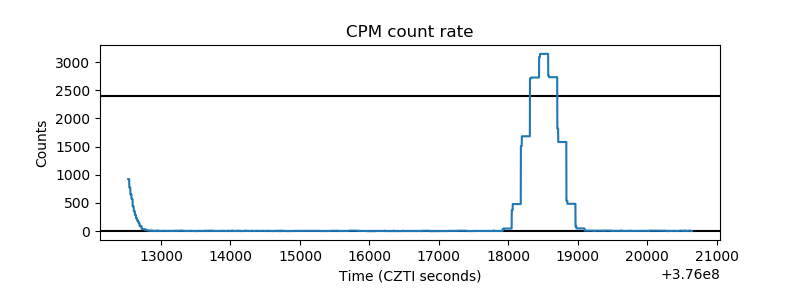 |
| CZT Counter | 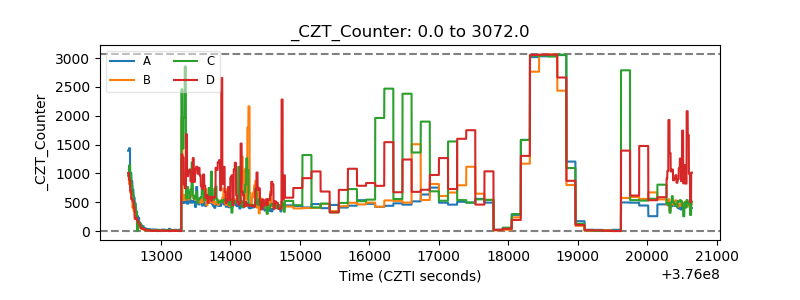 |
| +2.5 Volts monitor |  |
| +5 Volts monitor |  |
| _ROLL_ROT | 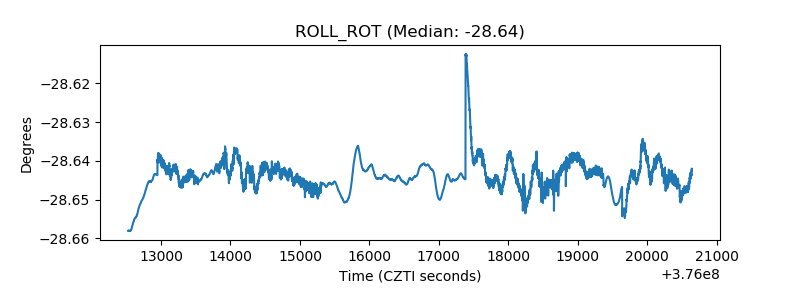 |
| _Roll_DEC | 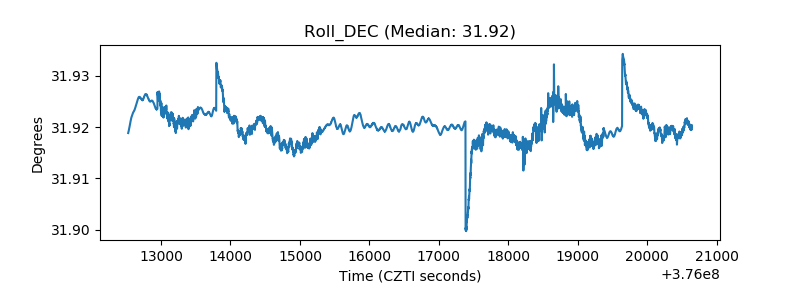 |
| _Roll_RA | 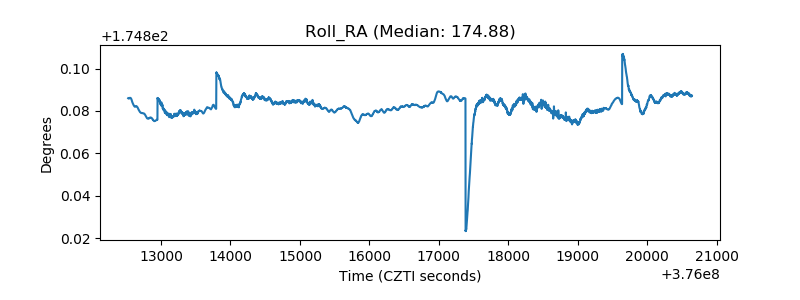 |
| Veto Counter | 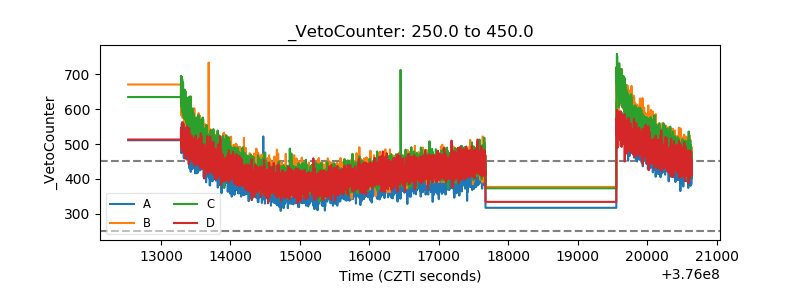 |