| Param | Original file | Final file |
|---|---|---|
| Filename | modeM0/AS1A10_064T02_9000004788_33393cztM0_level2.evt | modeM0/AS1A10_064T02_9000004788_33393cztM0_level2_quad_clean.evt |
| Size (bytes) | 451,693,440 | 85,432,320 |
| Size | 430.8 MB | 81.5 MB |
| Events in quadrant A | 2,548,698 | 566,730 |
| Events in quadrant B | 3,371,779 | 586,150 |
| Events in quadrant C | 3,107,317 | 547,609 |
| Events in quadrant D | 4,290,951 | 514,500 |
| Mode M9 | |||
|---|---|---|---|
| Quadrant | BADHDUFLAG | Total packets | Discarded packets |
| A | 0 | 30 | 0 |
| B | 0 | 30 | 0 |
| C | 0 | 30 | 0 |
| D | 0 | 31 | 0 |
| Mode M0 | |||
|---|---|---|---|
| Quadrant | BADHDUFLAG | Total packets | Discarded packets |
| A | 0 | 10780 | 2 |
| B | 0 | 13400 | 1 |
| C | 0 | 12224 | 1 |
| D | 0 | 16420 | 1 |
| Mode SS | |||
|---|---|---|---|
| Quadrant | BADHDUFLAG | Total packets | Discarded packets |
| A | 0 | 106 | 0 |
| B | 0 | 106 | 0 |
| C | 0 | 106 | 0 |
| D | 0 | 106 | 0 |
| Quadrant | Total seconds | Saturated seconds | Saturation percentage |
|---|---|---|---|
| A | 5322 | 5 | 0.093950% |
| B | 5322 | 240 | 4.509583% |
| C | 5322 | 163 | 3.062758% |
| D | 5322 | 316 | 5.937617% |
Noise dominated data is calculated using 1-second bins in cleaned event files. If a bin has >2000 counts, and if more than 50% of those come from <1% of pixels, then it is considered to be noise-dominated and hence unusable.
| Quadrant | # 1 sec bins | Bins with >0 counts | Bins with >2000 counts | High rate bins dominated by noise | Noise dominated (total time) | Noise dominated (detector-on time) | Marked lightcurve |
|---|---|---|---|---|---|---|---|
| A | 7325 | 5323 | 0 | 0 | 0.00% | 0.00% | 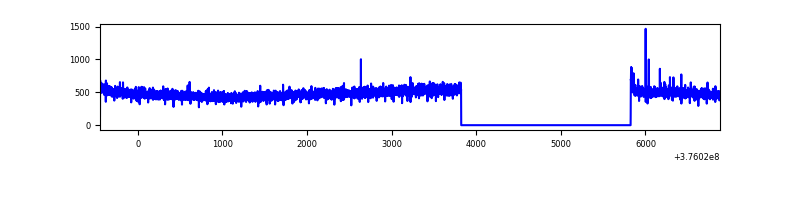 |
| B | 7325 | 5323 | 155 | 155 | 2.12% | 2.91% | 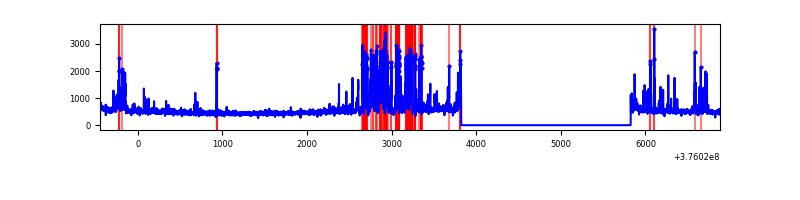 |
| C | 7325 | 5323 | 146 | 146 | 1.99% | 2.74% | 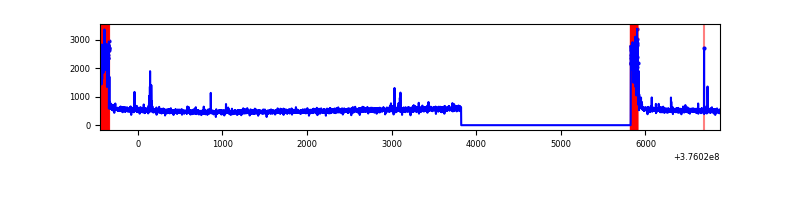 |
| D | 7325 | 5323 | 297 | 297 | 4.05% | 5.58% | 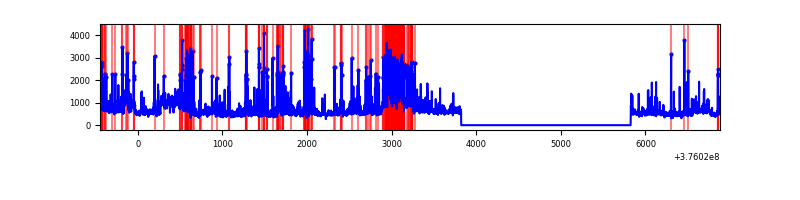 |
Top three noisy pixels from each quadrant. If the there are fewer than three noisy pixels in the level2.evt file, extra rows are filled as -1
| Pixel properties | Quadrant properties | ||||||
|---|---|---|---|---|---|---|---|
| Quadrant | DetID | PixID | Counts | Sigma | Mean | Median | Sigma |
| A | 15 | 169 | 9953 | 71.01 | 655 | 645 | 131.1 |
| A | 13 | 254 | 8404 | 59.19 | 655 | 645 | 131.1 |
| A | 13 | 6 | 6352 | 43.54 | 655 | 645 | 131.1 |
| B | 5 | 172 | 634864 | 5257.02 | 645 | 630 | 120.6 |
| B | 5 | 255 | 72148 | 592.8 | 645 | 630 | 120.6 |
| B | 0 | 219 | 56889 | 466.32 | 645 | 630 | 120.6 |
| C | 0 | 10 | 404934 | 2815.49 | 623 | 629 | 143.6 |
| C | 15 | 214 | 225865 | 1568.49 | 623 | 629 | 143.6 |
| C | 15 | 159 | 25482 | 173.07 | 623 | 629 | 143.6 |
| D | 8 | 195 | 530404 | 3525.84 | 612 | 594 | 150.3 |
| D | 12 | 233 | 369113 | 2452.46 | 612 | 594 | 150.3 |
| D | 12 | 6 | 355622 | 2362.68 | 612 | 594 | 150.3 |
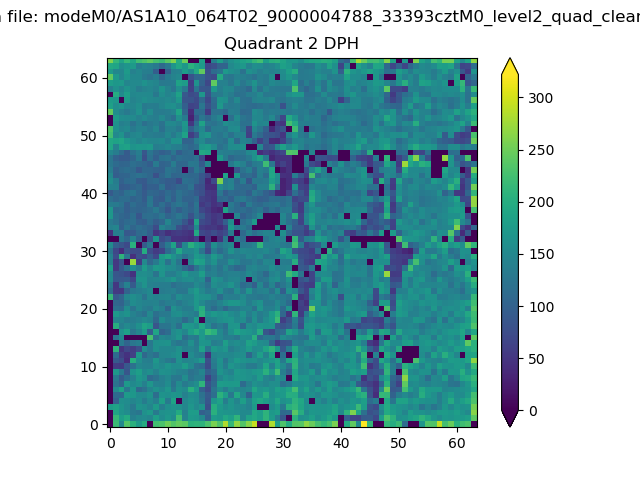
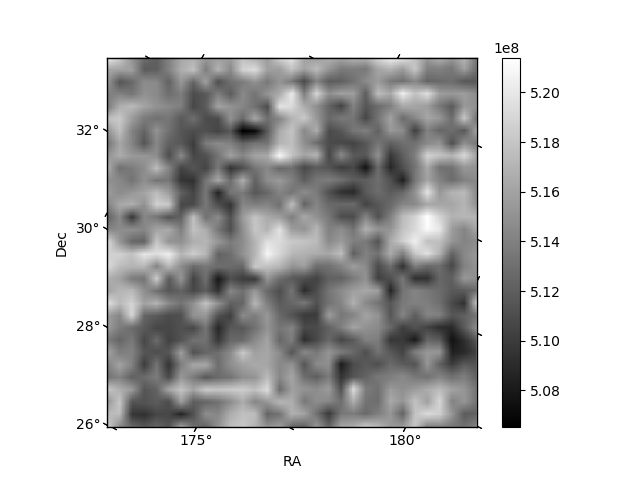
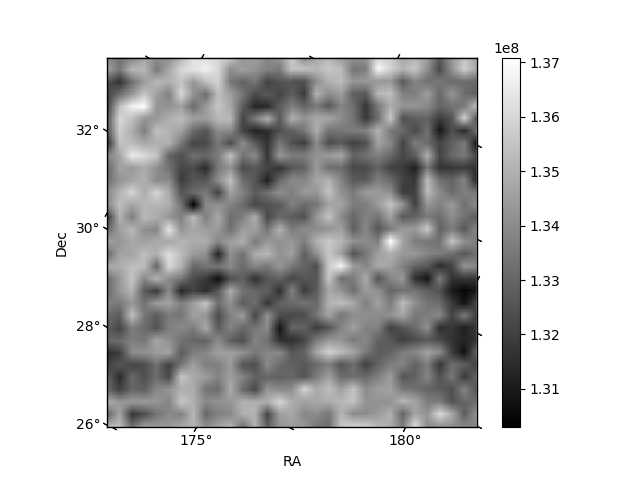
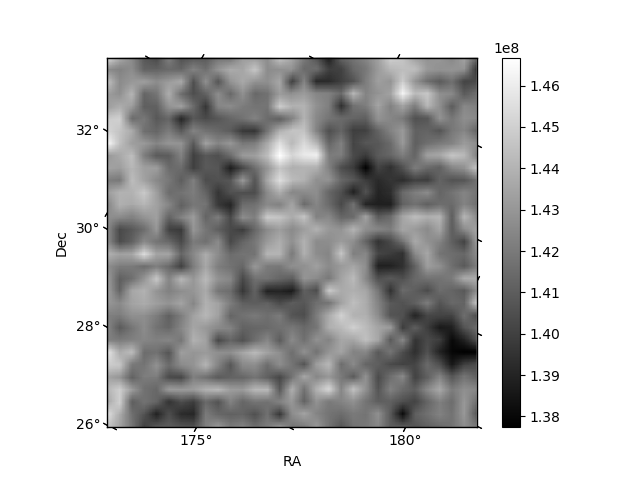
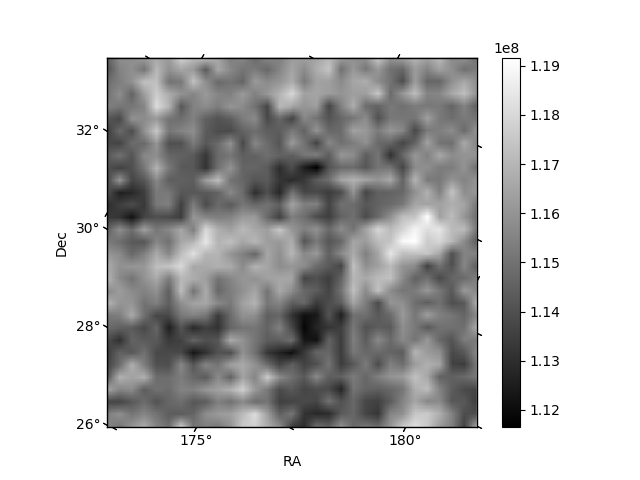
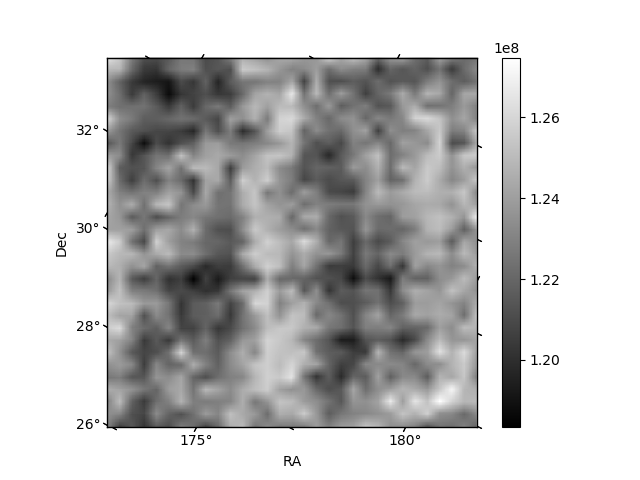
Histogram calculated using DETX and DETY for each event in the final _common_clean file
| Quadrant A | 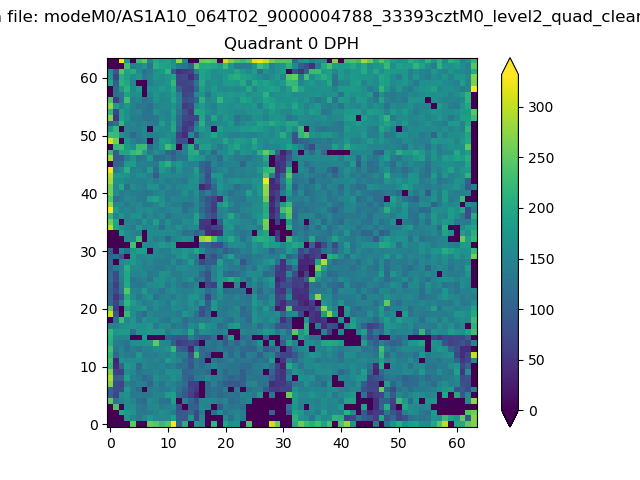 |
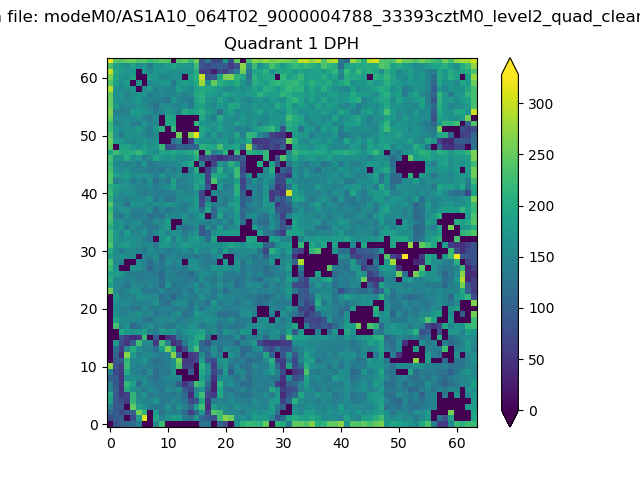 |
Quadrant B |
|---|---|---|---|
| Quadrant D | 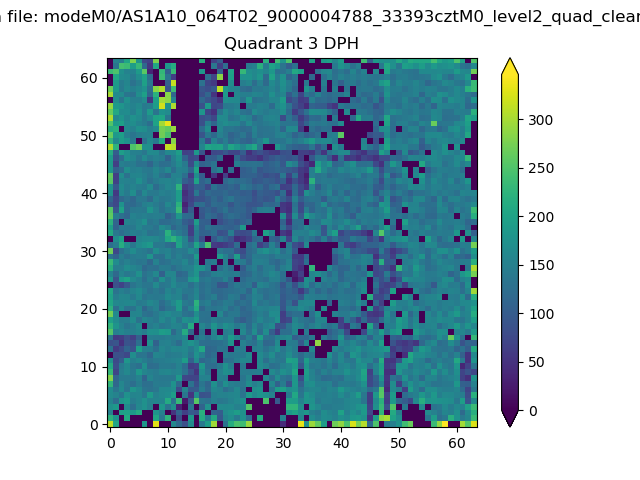 |
 |
Quadrant C |
| Plot type | Count rate plots | Images |
|---|---|---|
| Comparison with Poisson distribution Blue bars denote a histogram of data divided into 1 sec bins. Red curve is a Poisson curve with rate = median count rate of data. |
 |
 |
| Quadrant-wise count rates Data is divided into 100 sec bins |
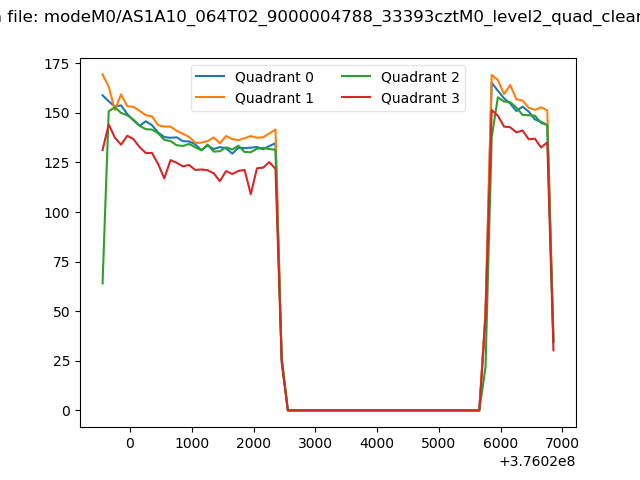 |
|
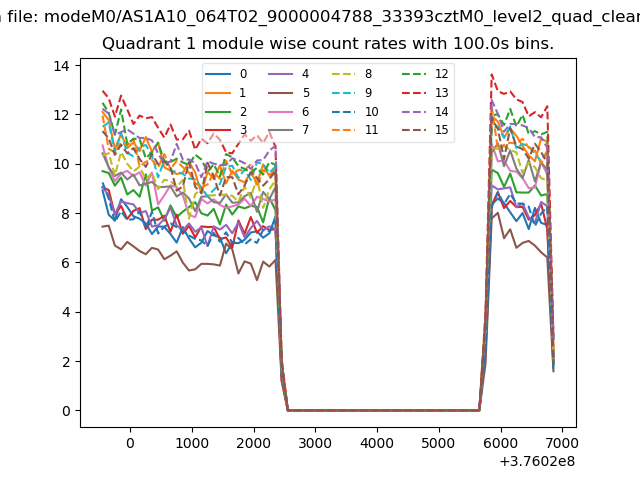
| Module-wise count rates for Quadrant A Data is divided into 100 sec bins |
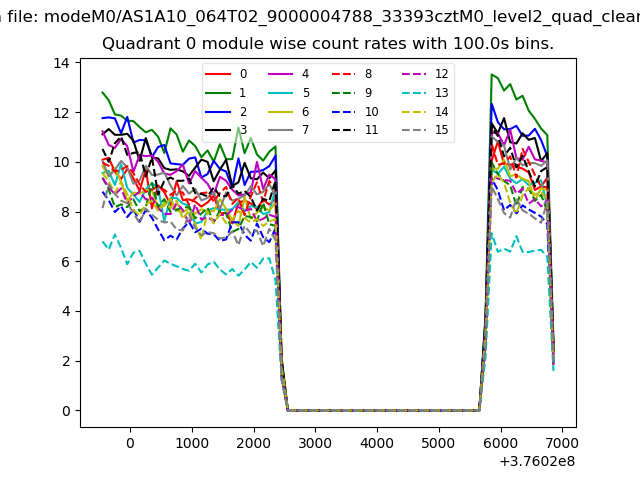 |
 |
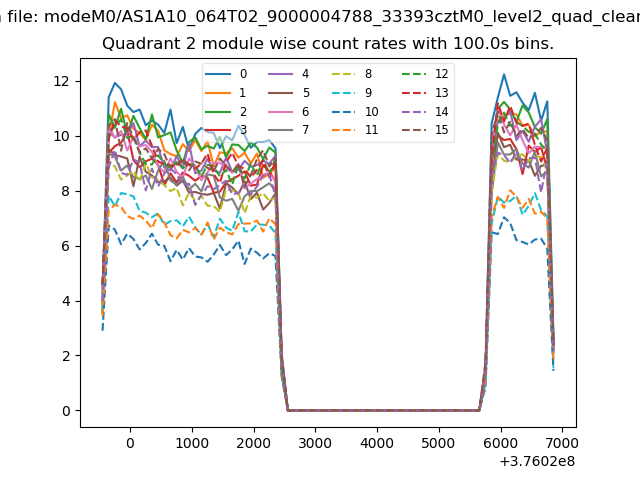
| Module-wise count rates for Quadrant B Data is divided into 100 sec bins |
 |
 |
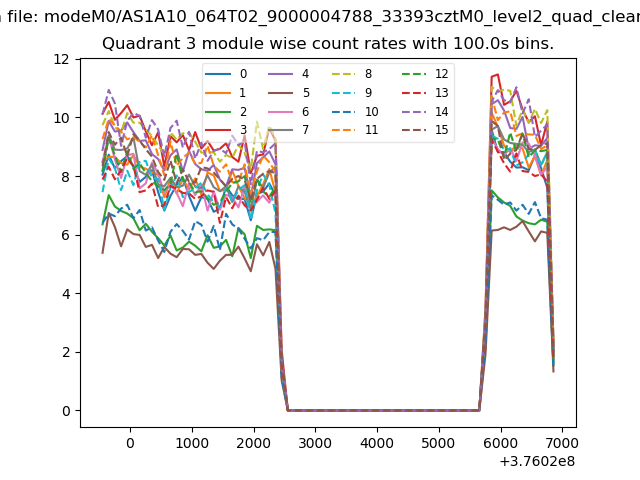
| Module-wise count rates for Quadrant C Data is divided into 100 sec bins |
 |
 |
| Module-wise count rates for Quadrant D Data is divided into 100 sec bins |
 |
 |
| Parameter | Plot |
|---|---|
| CZT HV Monitor |  |
| D_VDD | 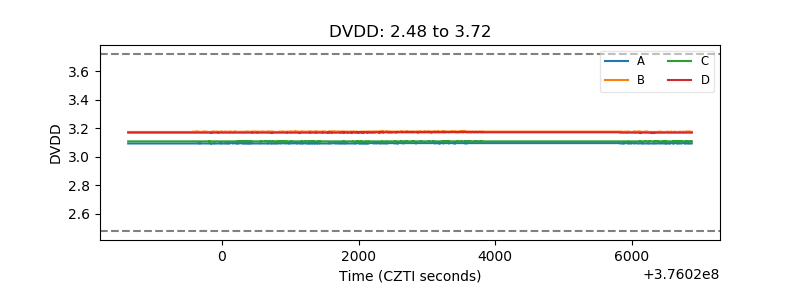 |
| Temperature 1 | 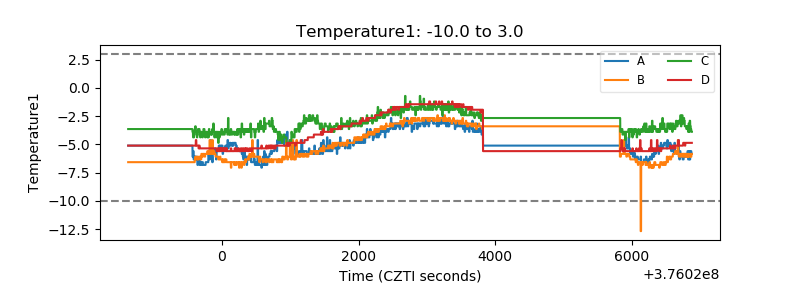 |
| Veto HV Monitor | 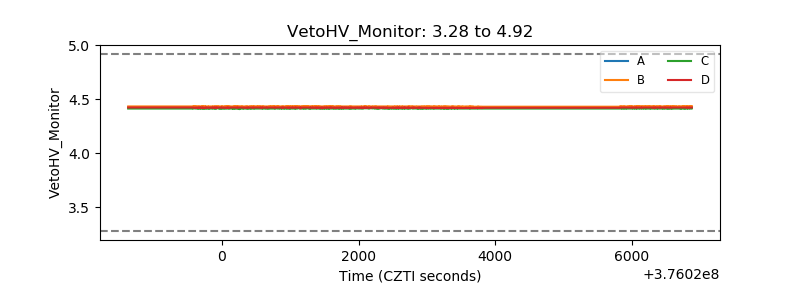 |
| Veto LLD | 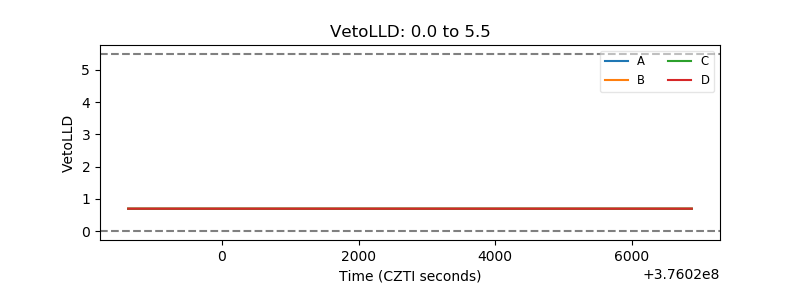 |
| Alpha Counter | 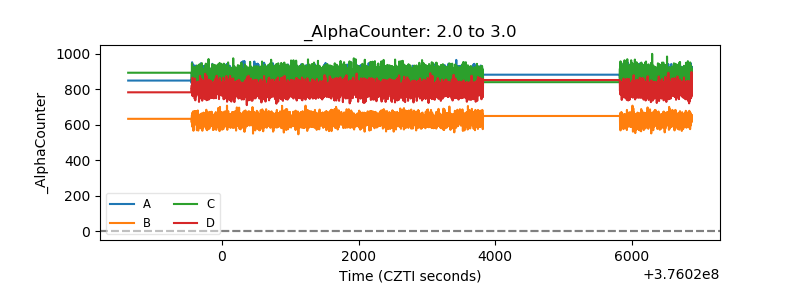 |
| _CPM_Rate | 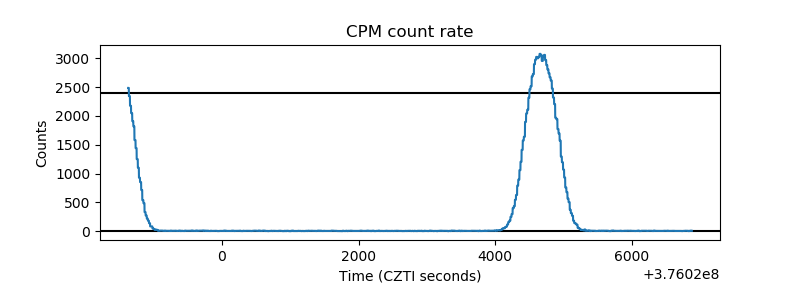 |
| CZT Counter | 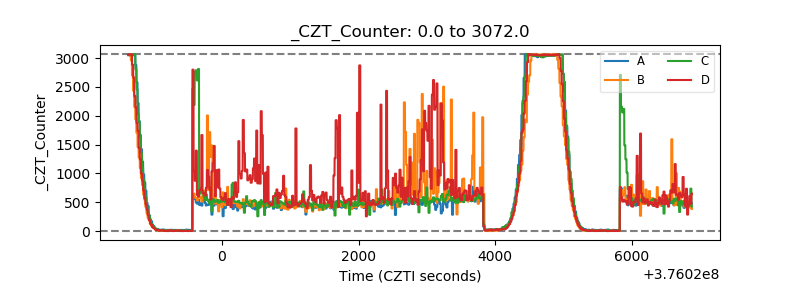 |
| +2.5 Volts monitor |  |
| +5 Volts monitor |  |
| _ROLL_ROT |  |
| _Roll_DEC |  |
| _Roll_RA | 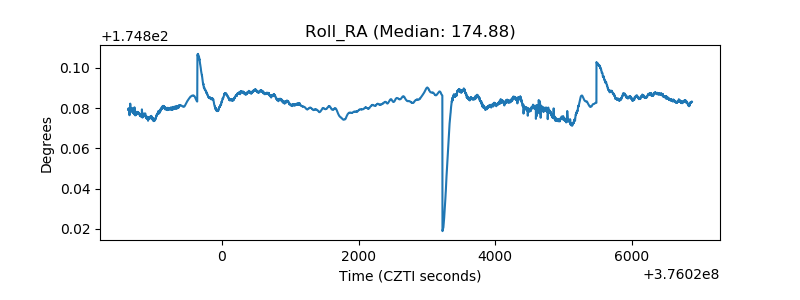 |
| Veto Counter | 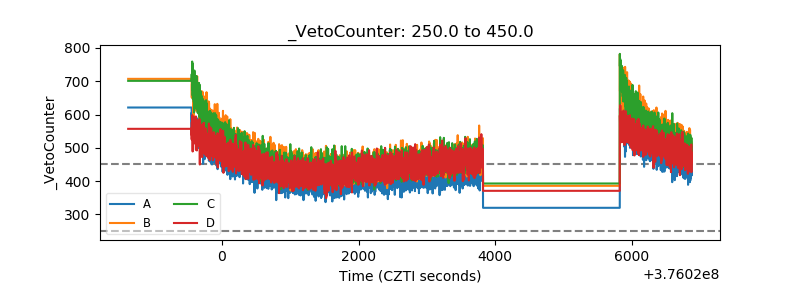 |