| Param | Original file | Final file |
|---|---|---|
| Filename | modeM0/AS1A10_064T02_9000004788_33395cztM0_level2.evt | modeM0/AS1A10_064T02_9000004788_33395cztM0_level2_quad_clean.evt |
| Size (bytes) | 567,023,040 | 58,512,960 |
| Size | 540.8 MB | 55.8 MB |
| Events in quadrant A | 2,487,052 | 438,618 |
| Events in quadrant B | 6,196,805 | 155,630 |
| Events in quadrant C | 3,047,539 | 425,917 |
| Events in quadrant D | 5,091,310 | 390,843 |
| Mode M9 | |||
|---|---|---|---|
| Quadrant | BADHDUFLAG | Total packets | Discarded packets |
| A | 0 | 21 | 0 |
| B | 0 | 21 | 0 |
| C | 0 | 21 | 0 |
| D | 0 | 21 | 0 |
| Mode M0 | |||
|---|---|---|---|
| Quadrant | BADHDUFLAG | Total packets | Discarded packets |
| A | 0 | 10358 | 3 |
| B | 0 | 21981 | 2 |
| C | 0 | 12006 | 2 |
| D | 0 | 18794 | 2 |
| Mode SS | |||
|---|---|---|---|
| Quadrant | BADHDUFLAG | Total packets | Discarded packets |
| A | 0 | 106 | 0 |
| B | 0 | 106 | 0 |
| C | 0 | 106 | 0 |
| D | 0 | 106 | 0 |
| Quadrant | Total seconds | Saturated seconds | Saturation percentage |
|---|---|---|---|
| A | 5124 | 5 | 0.097580% |
| B | 5124 | 4105 | 80.113193% |
| C | 5124 | 101 | 1.971116% |
| D | 5125 | 335 | 6.536585% |
Noise dominated data is calculated using 1-second bins in cleaned event files. If a bin has >2000 counts, and if more than 50% of those come from <1% of pixels, then it is considered to be noise-dominated and hence unusable.
| Quadrant | # 1 sec bins | Bins with >0 counts | Bins with >2000 counts | High rate bins dominated by noise | Noise dominated (total time) | Noise dominated (detector-on time) | Marked lightcurve |
|---|---|---|---|---|---|---|---|
| A | 7247 | 5125 | 0 | 0 | 0.00% | 0.00% | 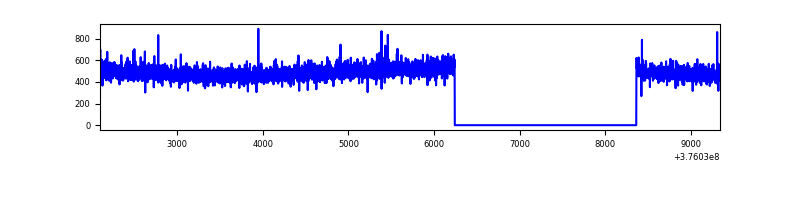 |
| B | 7247 | 5124 | 1057 | 1057 | 14.59% | 20.63% | 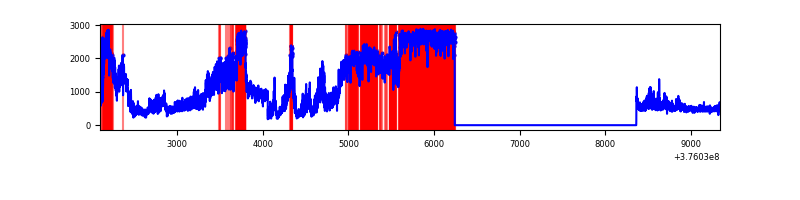 |
| C | 7247 | 5125 | 98 | 98 | 1.35% | 1.91% | 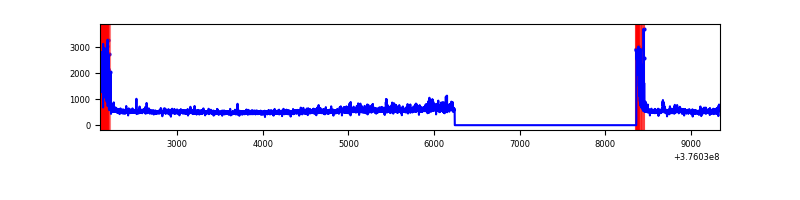 |
| D | 7248 | 5126 | 315 | 315 | 4.35% | 6.15% | 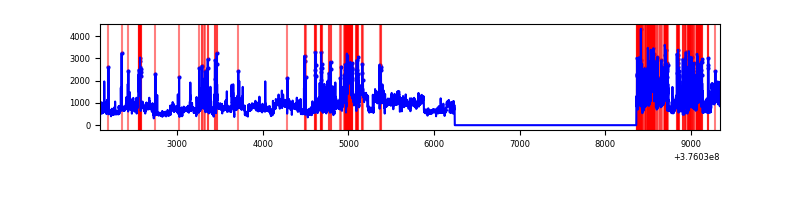 |
Top three noisy pixels from each quadrant. If the there are fewer than three noisy pixels in the level2.evt file, extra rows are filled as -1
| Pixel properties | Quadrant properties | ||||||
|---|---|---|---|---|---|---|---|
| Quadrant | DetID | PixID | Counts | Sigma | Mean | Median | Sigma |
| A | 13 | 6 | 7776 | 56.31 | 641 | 631 | 126.9 |
| A | 13 | 254 | 7693 | 55.65 | 641 | 631 | 126.9 |
| A | 3 | 137 | 5694 | 39.9 | 641 | 631 | 126.9 |
| B | 12 | 1 | 5282575 | 175159.47 | 152 | 149 | 30.2 |
| B | 12 | 2 | 175287 | 5807.38 | 152 | 149 | 30.2 |
| B | 0 | 219 | 52199 | 1725.92 | 152 | 149 | 30.2 |
| C | 0 | 10 | 389003 | 2757.43 | 612 | 619 | 140.8 |
| C | 15 | 214 | 219882 | 1556.71 | 612 | 619 | 140.8 |
| C | 10 | 49 | 16548 | 113.09 | 612 | 619 | 140.8 |
| D | 8 | 195 | 1366278 | 9160.47 | 605 | 589 | 149.1 |
| D | 2 | 250 | 315996 | 2115.62 | 605 | 589 | 149.1 |
| D | 13 | 249 | 278800 | 1866.12 | 605 | 589 | 149.1 |
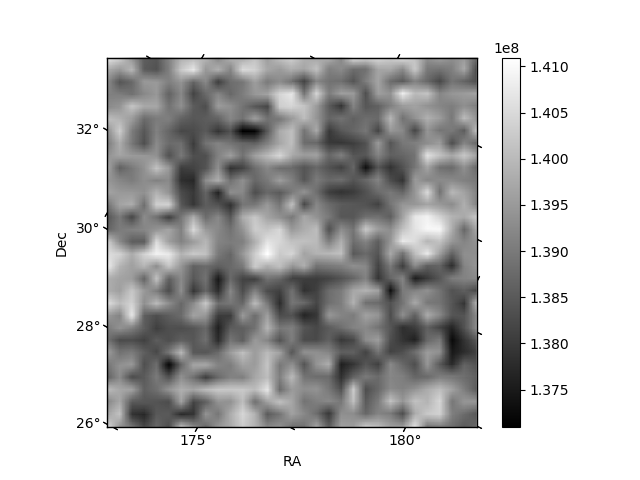
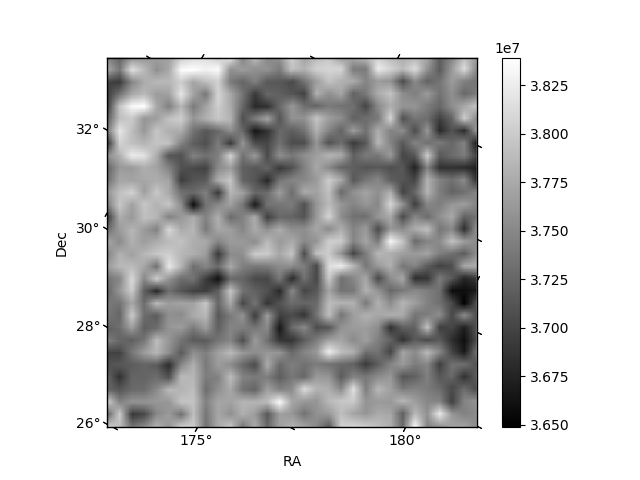
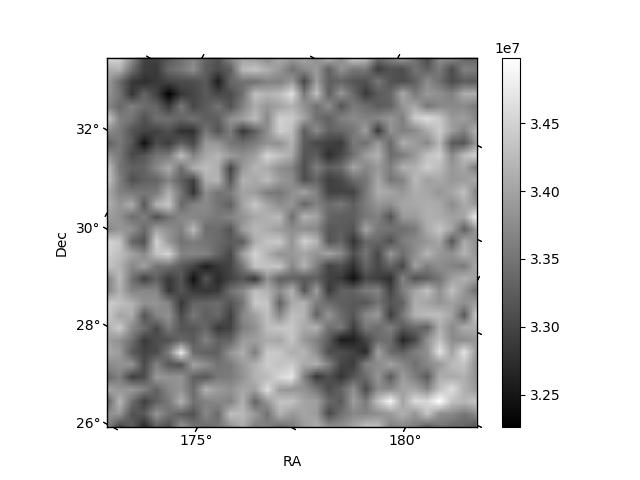
Histogram calculated using DETX and DETY for each event in the final _common_clean file
| Quadrant A | 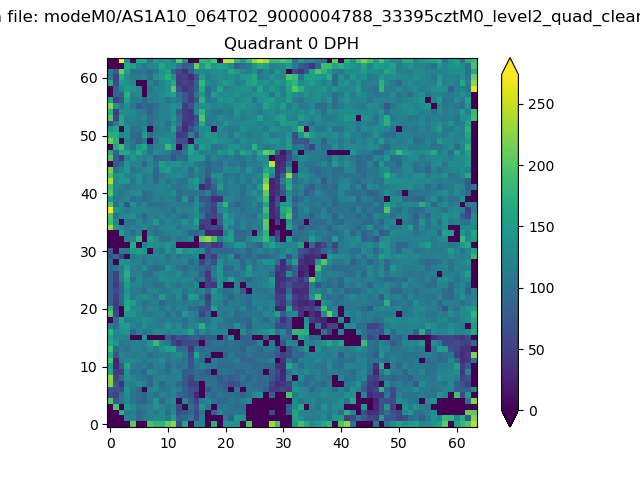 |
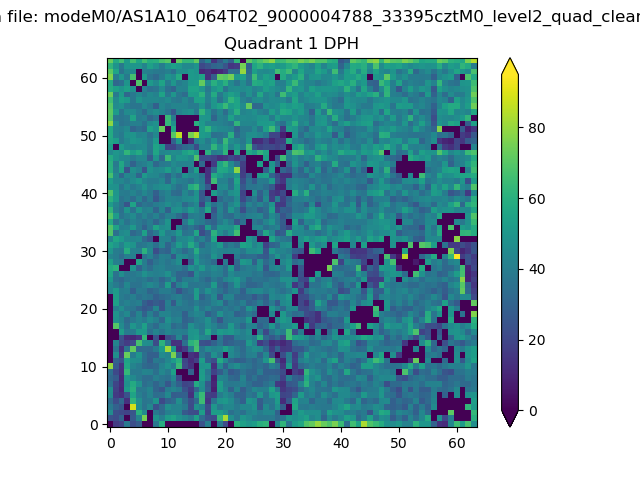 |
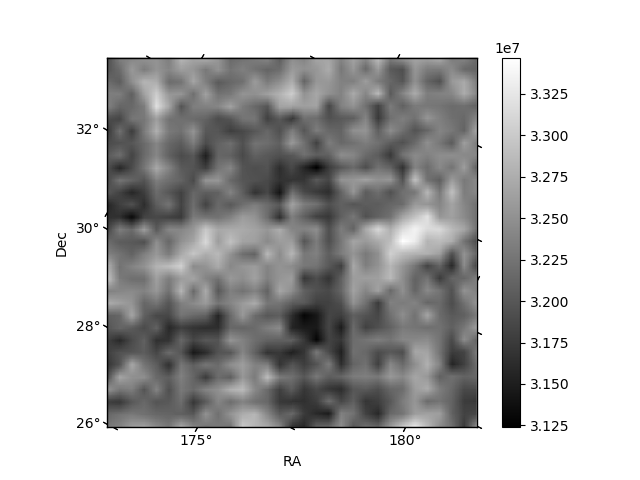
Quadrant B |
|---|---|---|---|
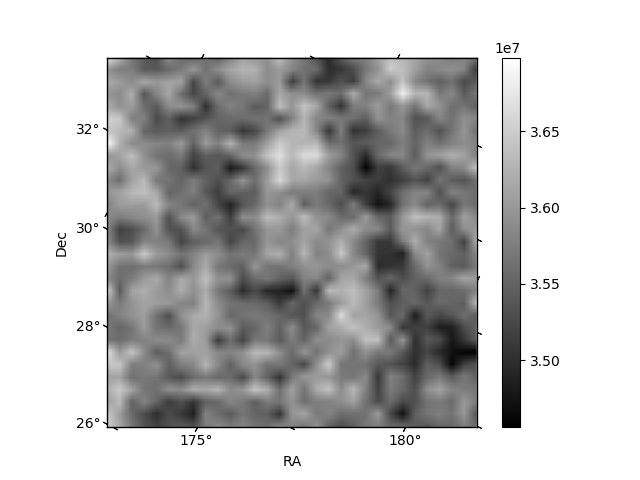
| Quadrant D | 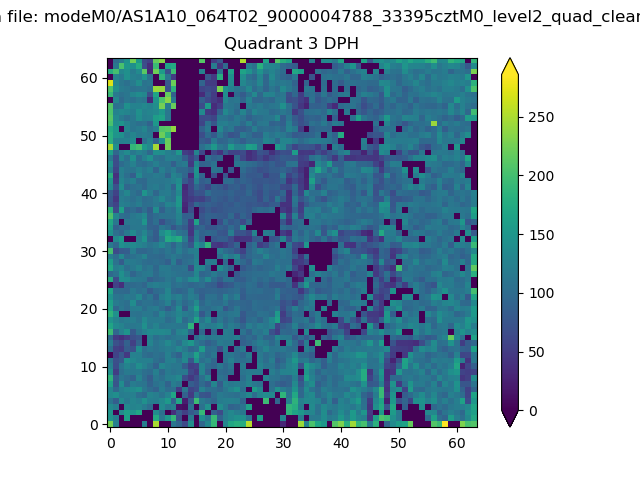 |
 |
Quadrant C |
| Plot type | Count rate plots | Images |
|---|---|---|
| Comparison with Poisson distribution Blue bars denote a histogram of data divided into 1 sec bins. Red curve is a Poisson curve with rate = median count rate of data. |
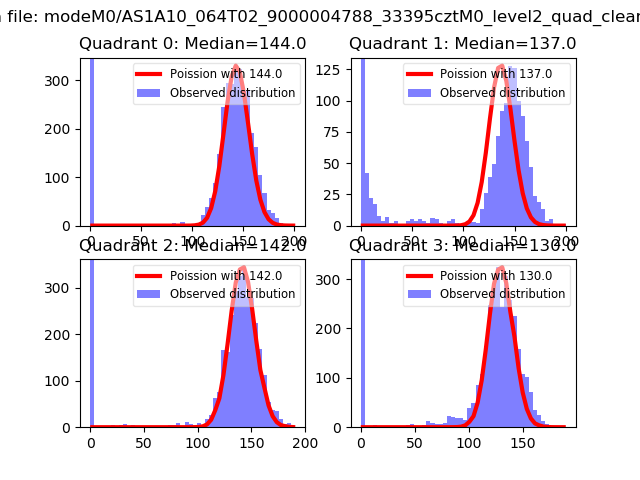 |
 |
| Quadrant-wise count rates Data is divided into 100 sec bins |
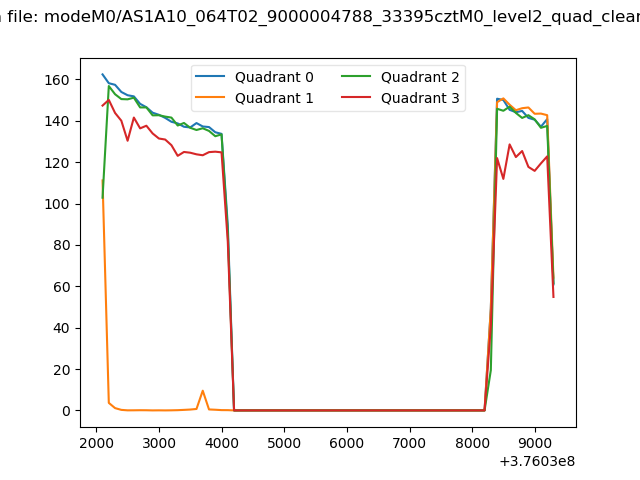 |
|
| Module-wise count rates for Quadrant A Data is divided into 100 sec bins |
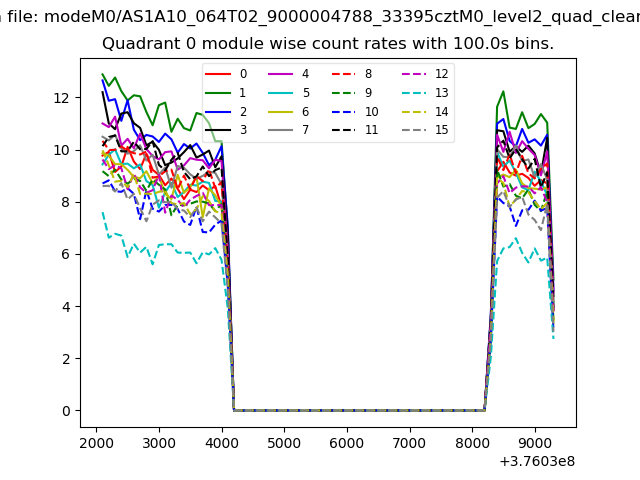 |
 |
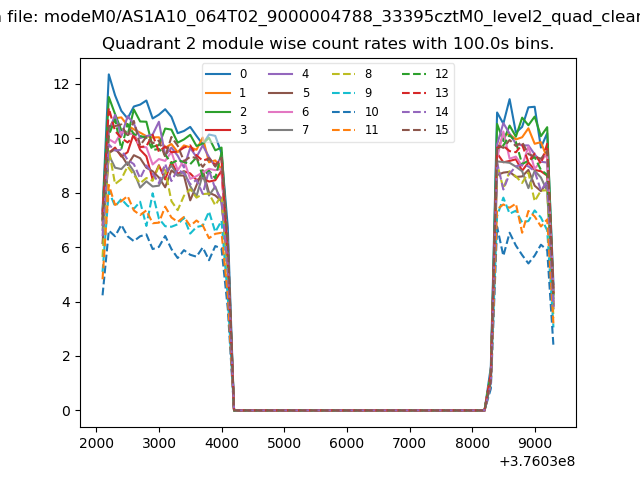
| Module-wise count rates for Quadrant B Data is divided into 100 sec bins |
 |
 |
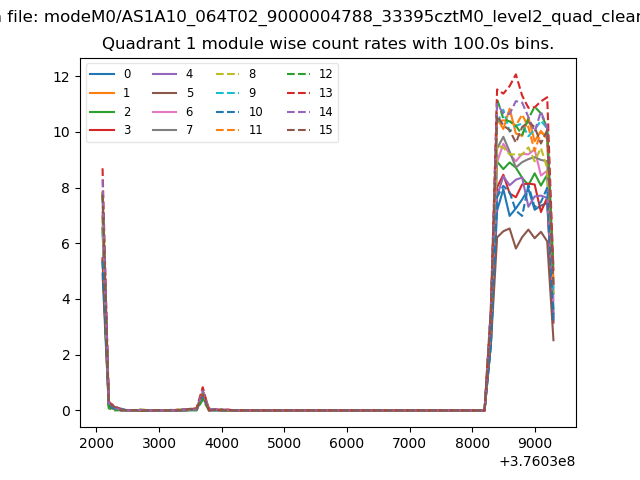
| Module-wise count rates for Quadrant C Data is divided into 100 sec bins |
 |
 |
| Module-wise count rates for Quadrant D Data is divided into 100 sec bins |
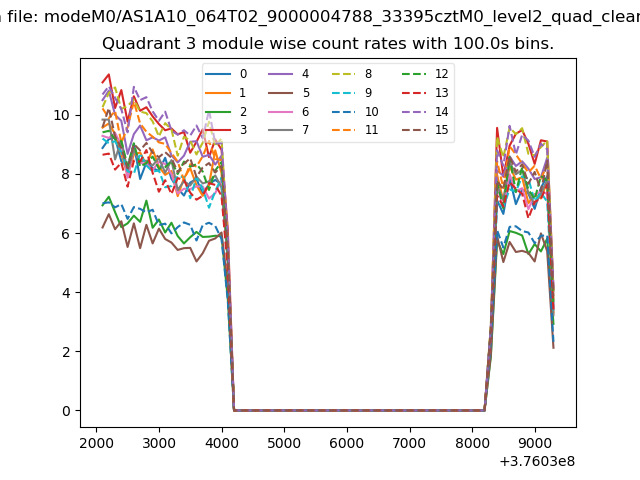 |
 |
| Parameter | Plot |
|---|---|
| CZT HV Monitor | 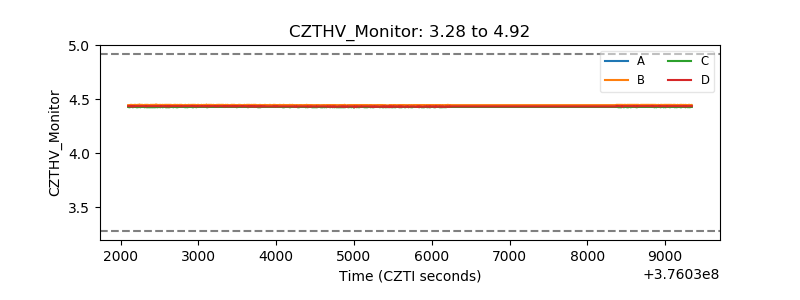 |
| D_VDD | 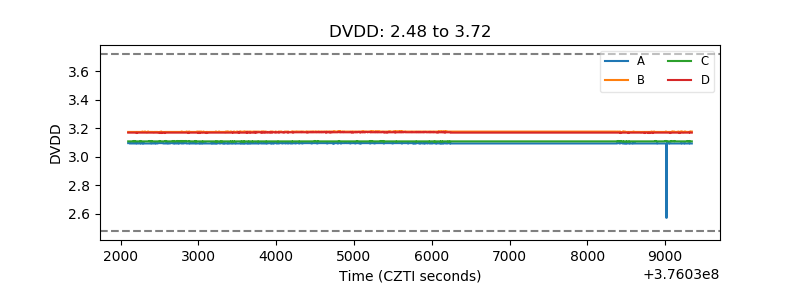 |
| Temperature 1 | 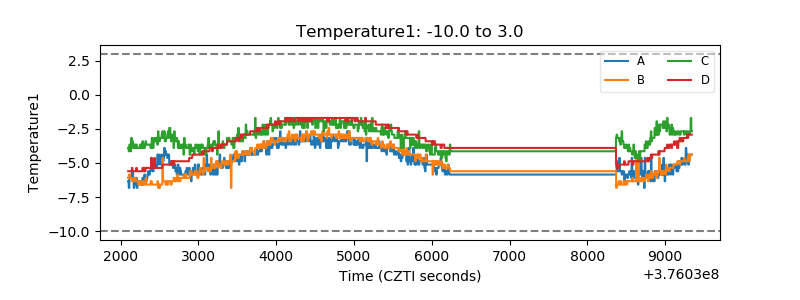 |
| Veto HV Monitor | 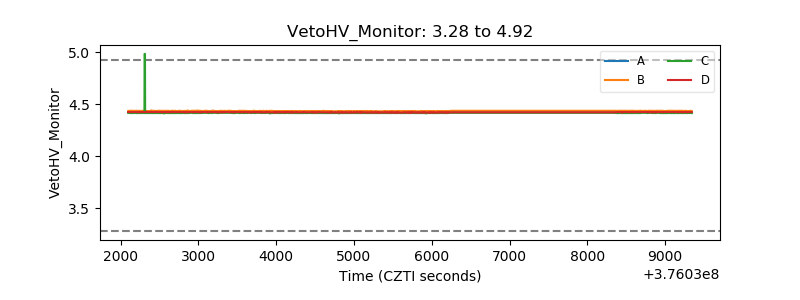 |
| Veto LLD | 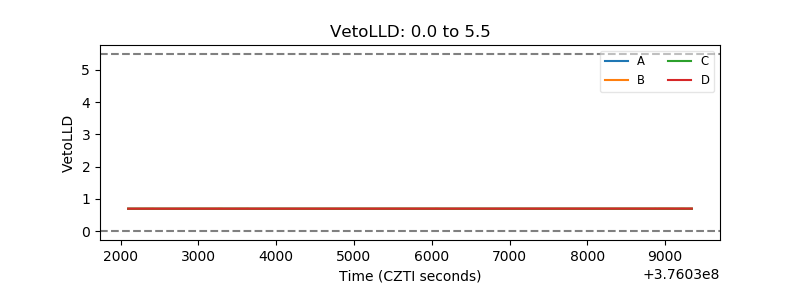 |
| Alpha Counter | 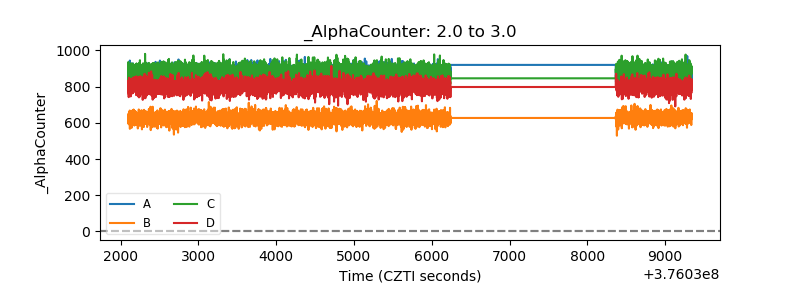 |
| _CPM_Rate | 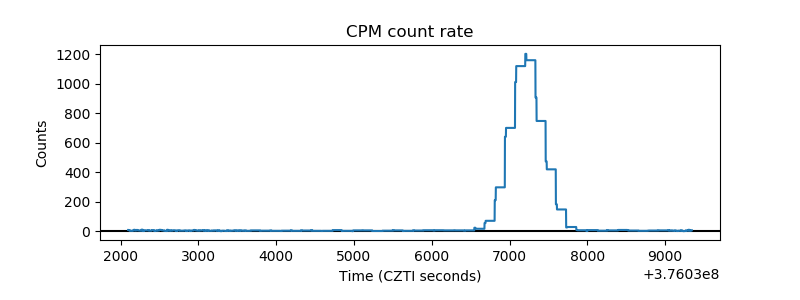 |
| CZT Counter | 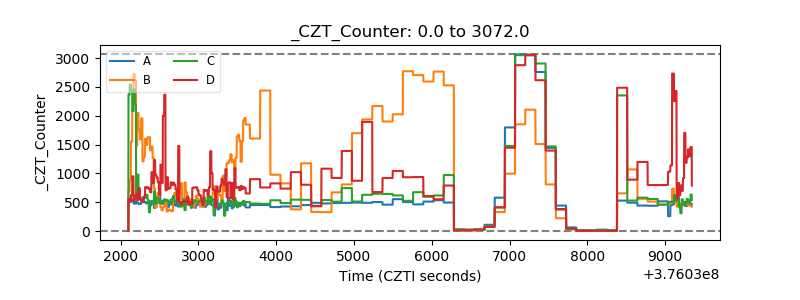 |
| +2.5 Volts monitor |  |
| +5 Volts monitor |  |
| _ROLL_ROT | 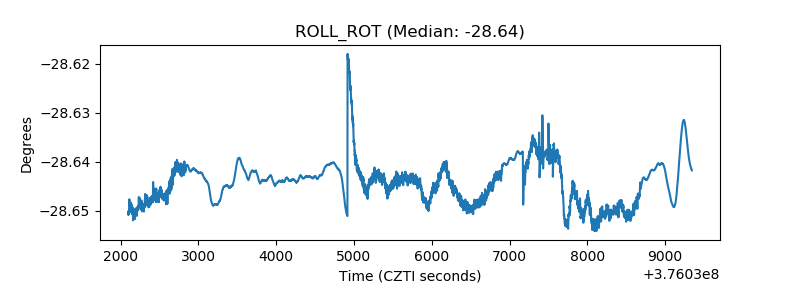 |
| _Roll_DEC | 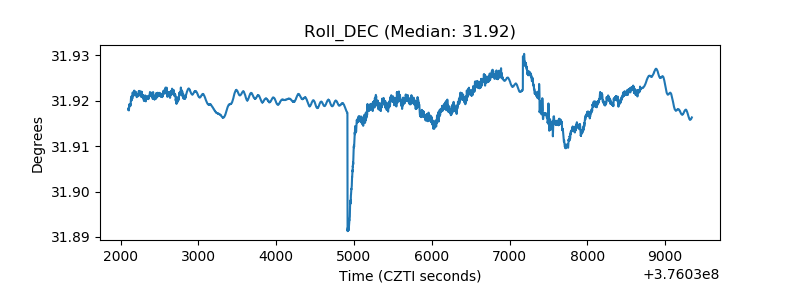 |
| _Roll_RA | 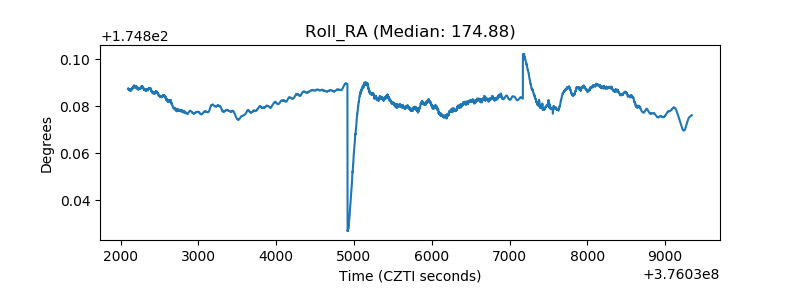 |
| Veto Counter | 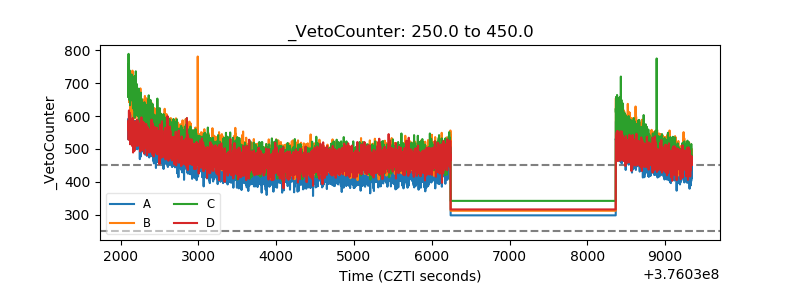 |