| Param | Original file | Final file |
|---|---|---|
| Filename | modeM0/AS1A10_064T02_9000004788_33398cztM0_level2.evt | modeM0/AS1A10_064T02_9000004788_33398cztM0_level2_quad_clean.evt |
| Size (bytes) | 377,331,840 | 34,361,280 |
| Size | 359.9 MB | 32.8 MB |
| Events in quadrant A | 1,711,661 | 200,194 |
| Events in quadrant B | 3,713,456 | 194,016 |
| Events in quadrant C | 2,007,394 | 198,341 |
| Events in quadrant D | 3,739,568 | 181,820 |
| Mode M9 | |||
|---|---|---|---|
| Quadrant | BADHDUFLAG | Total packets | Discarded packets |
| A | 0 | 2 | 0 |
| B | 0 | 2 | 0 |
| C | 0 | 2 | 0 |
| D | 0 | 3 | 0 |
| Mode M0 | |||
|---|---|---|---|
| Quadrant | BADHDUFLAG | Total packets | Discarded packets |
| A | 0 | 7526 | 1 |
| B | 0 | 13519 | 14 |
| C | 0 | 8018 | 1 |
| D | 0 | 13718 | 9 |
| Mode SS | |||
|---|---|---|---|
| Quadrant | BADHDUFLAG | Total packets | Discarded packets |
| A | 0 | 76 | 0 |
| B | 0 | 76 | 0 |
| C | 0 | 76 | 0 |
| D | 0 | 76 | 0 |
| Quadrant | Total seconds | Saturated seconds | Saturation percentage |
|---|---|---|---|
| A | 3753 | 4 | 0.106581% |
| B | 3751 | 608 | 16.209011% |
| C | 3753 | 41 | 1.092459% |
| D | 3751 | 236 | 6.291656% |
Noise dominated data is calculated using 1-second bins in cleaned event files. If a bin has >2000 counts, and if more than 50% of those come from <1% of pixels, then it is considered to be noise-dominated and hence unusable.
| Quadrant | # 1 sec bins | Bins with >0 counts | Bins with >2000 counts | High rate bins dominated by noise | Noise dominated (total time) | Noise dominated (detector-on time) | Marked lightcurve |
|---|---|---|---|---|---|---|---|
| A | 3753 | 3753 | 0 | 0 | 0.00% | 0.00% | 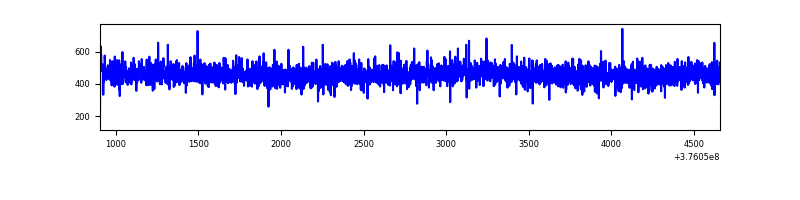 |
| B | 3753 | 3753 | 455 | 455 | 12.12% | 12.12% | 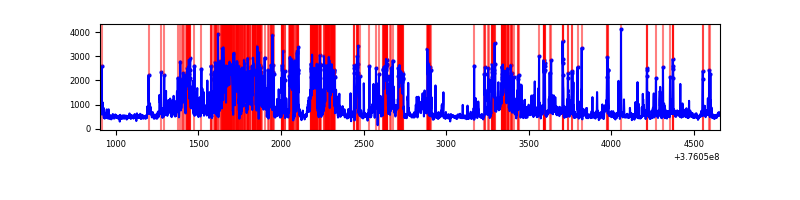 |
| C | 3753 | 3753 | 29 | 29 | 0.77% | 0.77% | 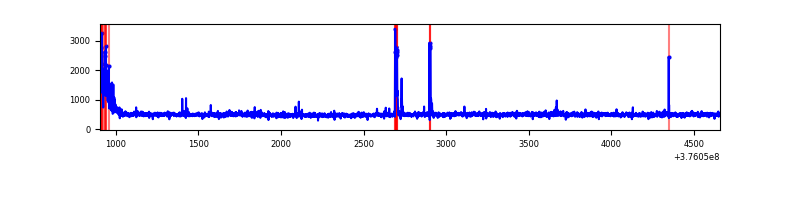 |
| D | 3752 | 3752 | 210 | 210 | 5.60% | 5.60% | 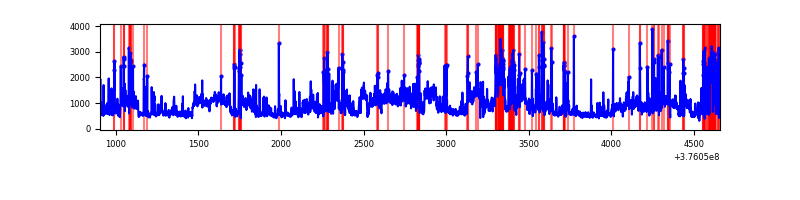 |
Top three noisy pixels from each quadrant. If the there are fewer than three noisy pixels in the level2.evt file, extra rows are filled as -1
| Pixel properties | Quadrant properties | ||||||
|---|---|---|---|---|---|---|---|
| Quadrant | DetID | PixID | Counts | Sigma | Mean | Median | Sigma |
| A | 13 | 254 | 6265 | 64.79 | 441 | 431 | 90.0 |
| A | 13 | 6 | 5908 | 60.82 | 441 | 431 | 90.0 |
| A | 3 | 137 | 4124 | 41.01 | 441 | 431 | 90.0 |
| B | 5 | 172 | 1321248 | 16528.46 | 411 | 401 | 79.9 |
| B | 5 | 255 | 191081 | 2386.08 | 411 | 401 | 79.9 |
| B | 0 | 219 | 172632 | 2155.22 | 411 | 401 | 79.9 |
| C | 15 | 214 | 162782 | 1620.08 | 428 | 430 | 100.2 |
| C | 0 | 10 | 97658 | 970.22 | 428 | 430 | 100.2 |
| C | 0 | 207 | 40447 | 399.32 | 428 | 430 | 100.2 |
| D | 8 | 195 | 1049619 | 10072.27 | 420 | 409 | 104.2 |
| D | 12 | 6 | 252378 | 2418.87 | 420 | 409 | 104.2 |
| D | 12 | 233 | 197684 | 1893.81 | 420 | 409 | 104.2 |
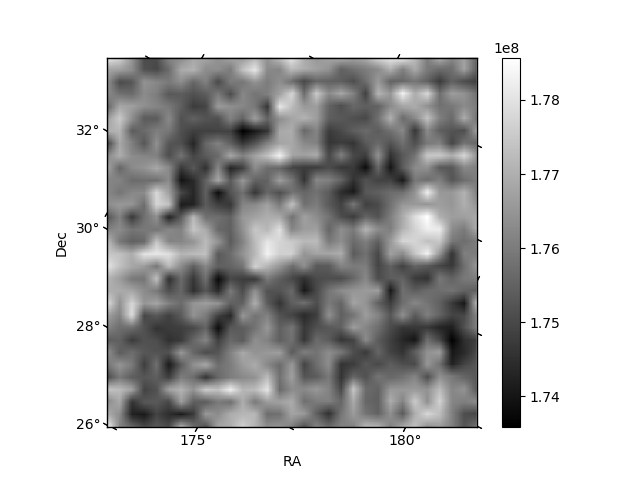
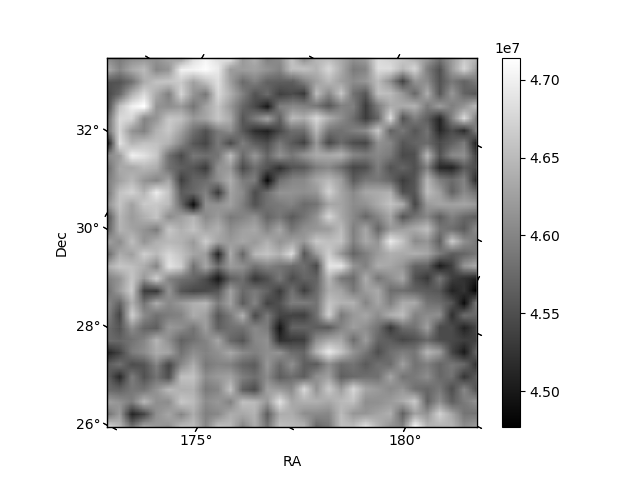
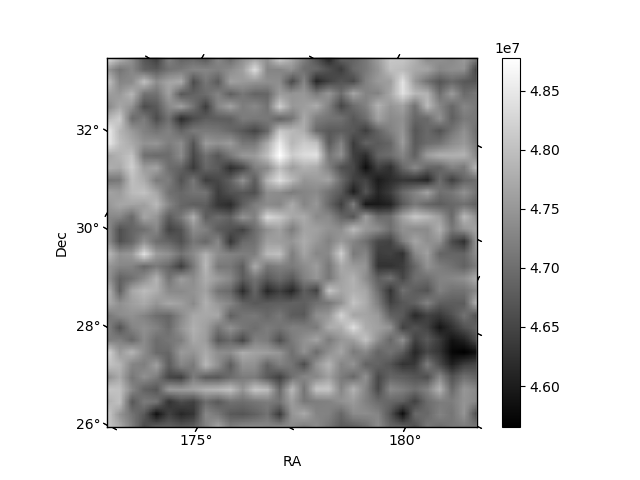
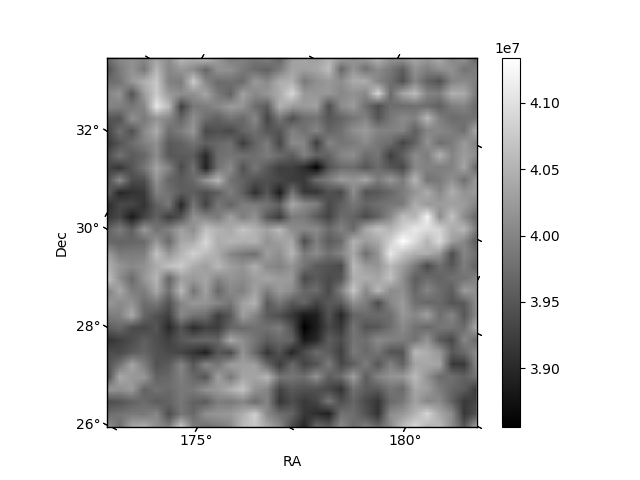
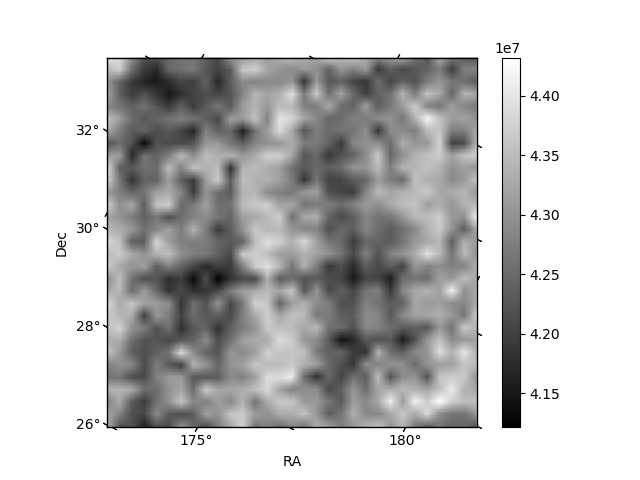
Histogram calculated using DETX and DETY for each event in the final _common_clean file
| Quadrant A | 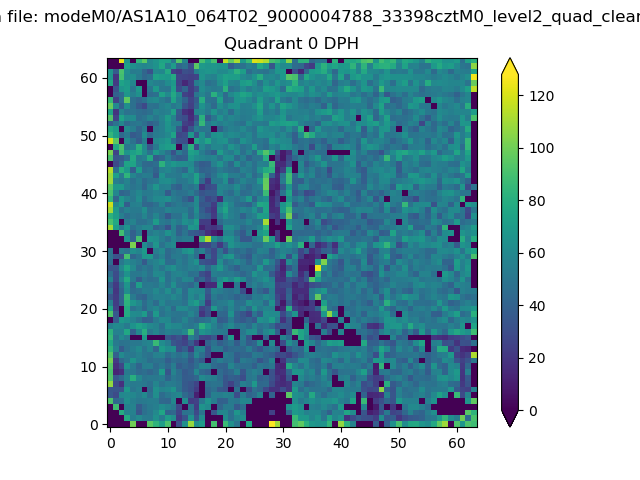 |
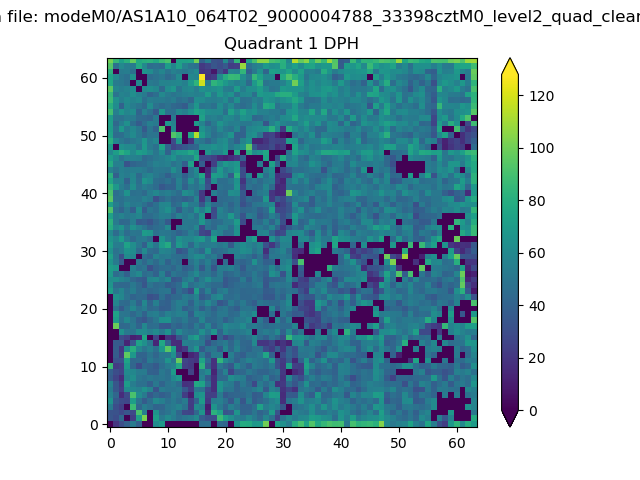 |
Quadrant B |
|---|---|---|---|
| Quadrant D | 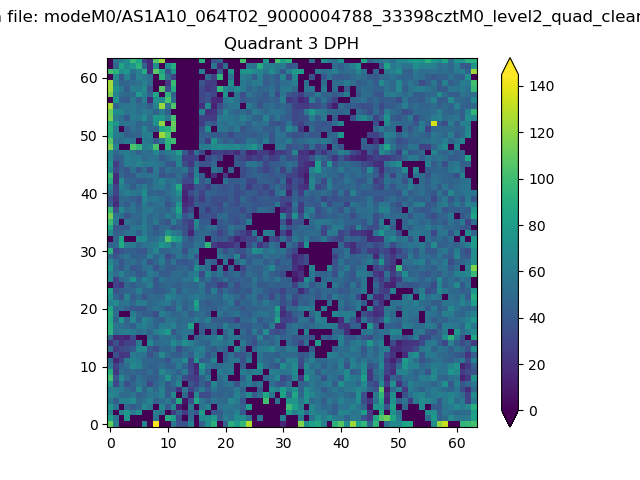 |
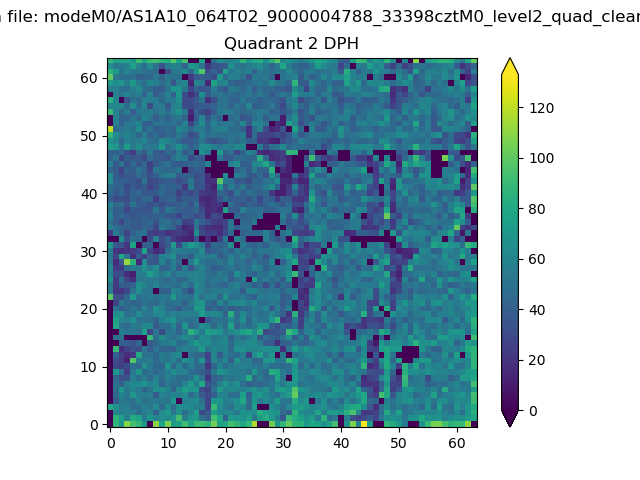 |
Quadrant C |
| Plot type | Count rate plots | Images |
|---|---|---|
| Comparison with Poisson distribution Blue bars denote a histogram of data divided into 1 sec bins. Red curve is a Poisson curve with rate = median count rate of data. |
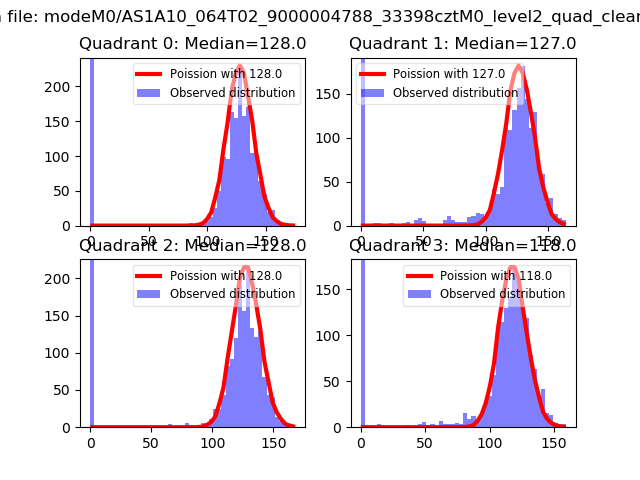 |
 |
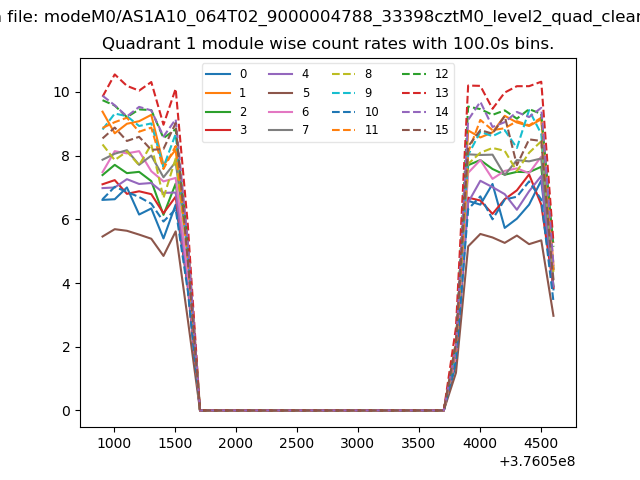
| Quadrant-wise count rates Data is divided into 100 sec bins |
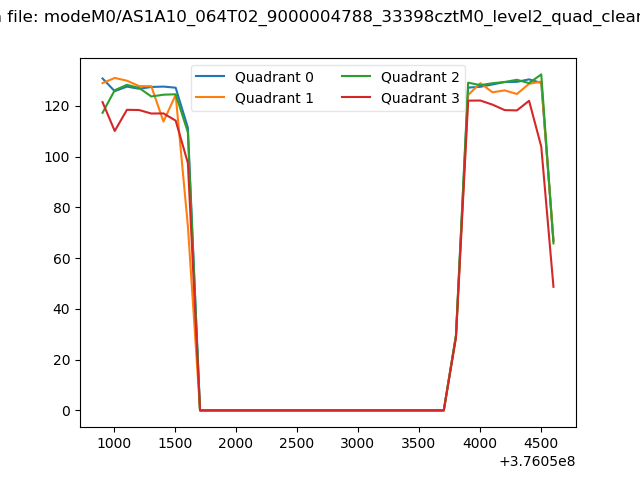 |
|
| Module-wise count rates for Quadrant A Data is divided into 100 sec bins |
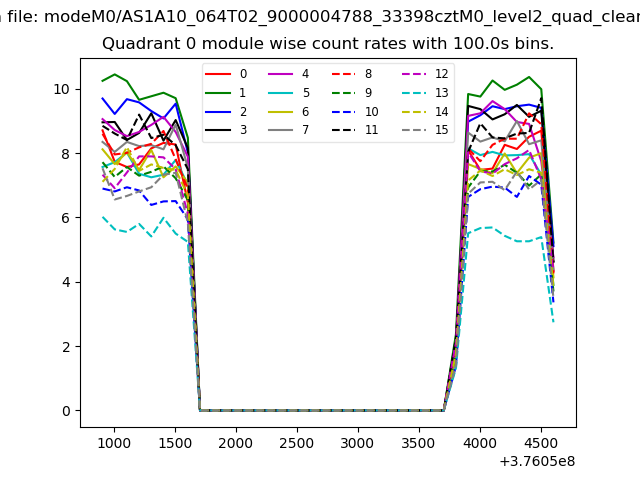 |
 |
| Module-wise count rates for Quadrant B Data is divided into 100 sec bins |
 |
 |
| Module-wise count rates for Quadrant C Data is divided into 100 sec bins |
 |
 |
| Module-wise count rates for Quadrant D Data is divided into 100 sec bins |
 |
 |
| Parameter | Plot |
|---|---|
| CZT HV Monitor |  |
| D_VDD | 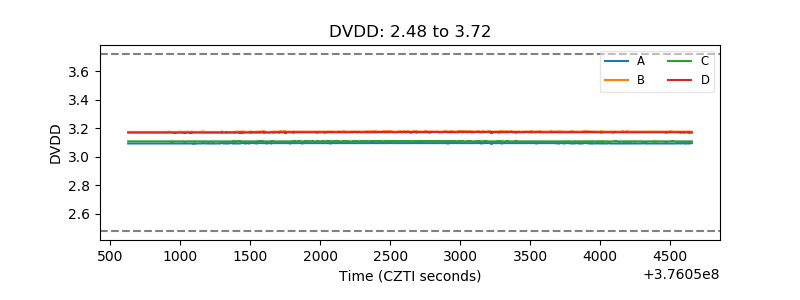 |
| Temperature 1 | 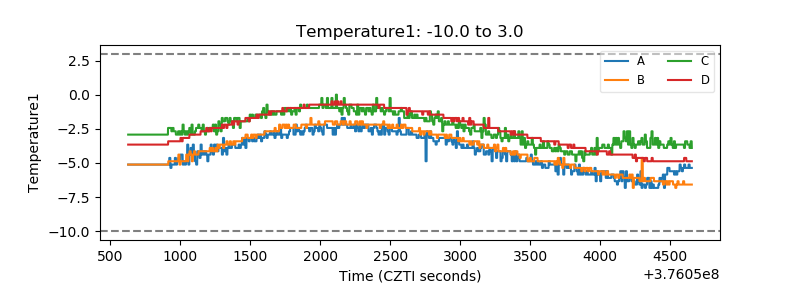 |
| Veto HV Monitor | 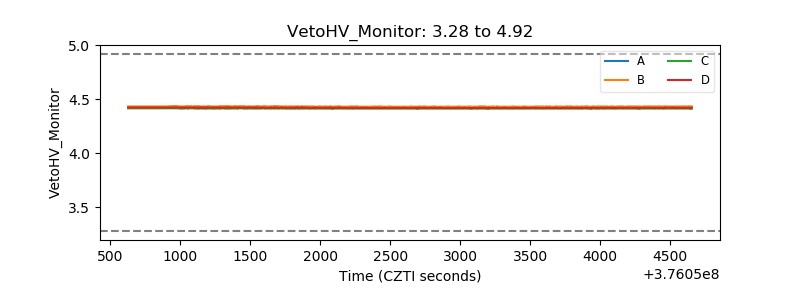 |
| Veto LLD | 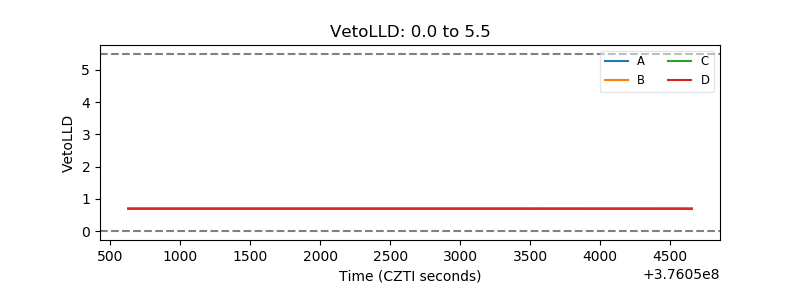 |
| Alpha Counter | 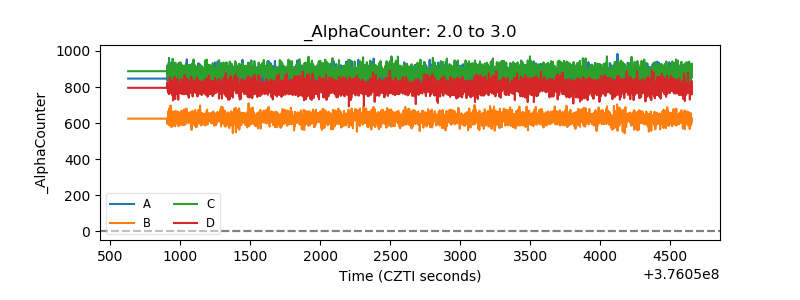 |
| _CPM_Rate | 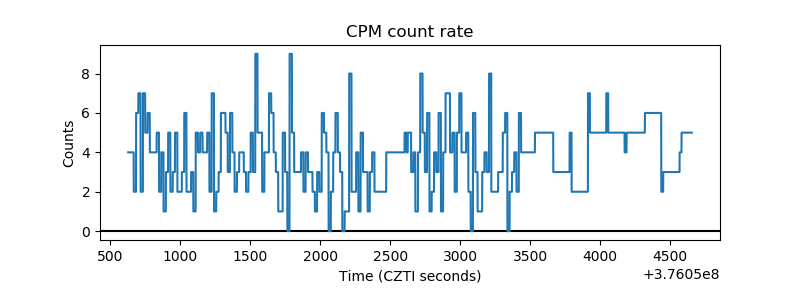 |
| CZT Counter | 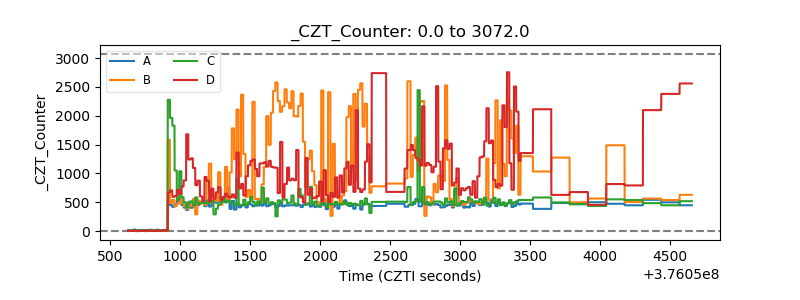 |
| +2.5 Volts monitor |  |
| +5 Volts monitor |  |
| _ROLL_ROT | 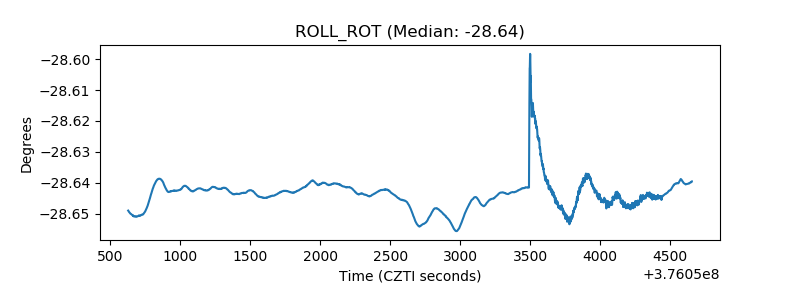 |
| _Roll_DEC | 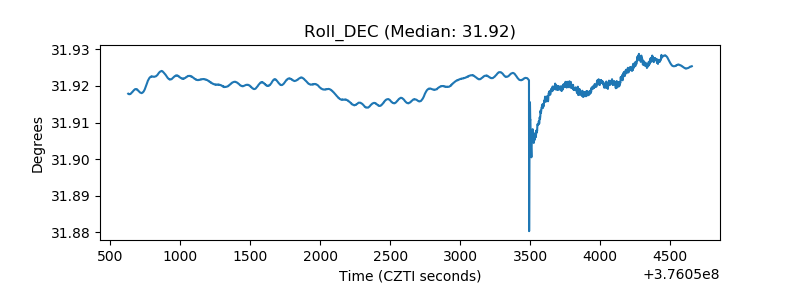 |
| _Roll_RA | 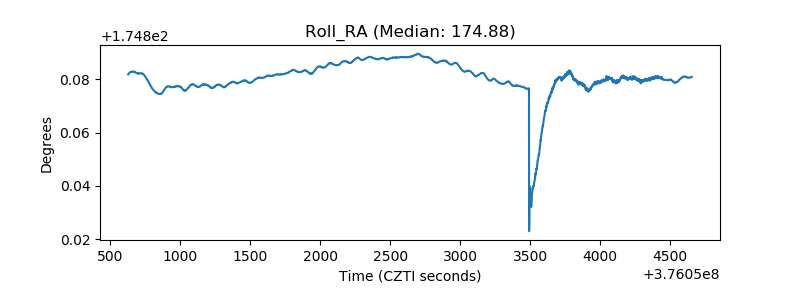 |
| Veto Counter | 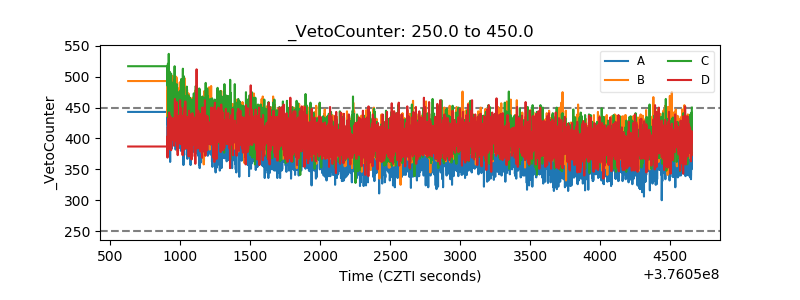 |