| Param | Original file | Final file |
|---|---|---|
| Filename | modeM0/AS1C07_001T03_9000004790cztM0_level2.fits | modeM0/AS1C07_001T03_9000004790cztM0_level2_quad_clean.evt |
| Size (bytes) | 796,357,440 | 972,213,120 |
| Size | 759.5 MB | 927.2 MB |
| Events in quadrant A | 4,996,200 | 6,501,029 |
| Events in quadrant B | 4,532,336 | 5,935,066 |
| Events in quadrant C | 4,746,760 | 6,002,750 |
| Events in quadrant D | 3,924,088 | 5,093,888 |
| Mode SS | |||
|---|---|---|---|
| Quadrant | BADHDUFLAG | Total packets | Discarded packets |
| A | 0 | 1758 | 0 |
| B | 0 | 1758 | 0 |
| C | 0 | 1758 | 0 |
| D | 0 | 1758 | 0 |
| Mode M0 | |||
|---|---|---|---|
| Quadrant | BADHDUFLAG | Total packets | Discarded packets |
| A | 0 | 173746 | 0 |
| B | 0 | 240549 | 0 |
| C | 0 | 185970 | 0 |
| D | 0 | 303477 | 0 |
| Mode M9 | |||
|---|---|---|---|
| Quadrant | BADHDUFLAG | Total packets | Discarded packets |
| A | 0 | 313 | 0 |
| B | 0 | 313 | 0 |
| C | 0 | 313 | 0 |
| D | 0 | 313 | 0 |
| Quadrant | Total seconds | Saturated seconds | Saturation percentage |
|---|---|---|---|
| A | 86270 | 72 | 0.083459% |
| B | 86270 | 6872 | 7.965689% |
| C | 86270 | 860 | 0.996870% |
| D | 86270 | 7206 | 8.352846% |
Noise dominated data is calculated using 1-second bins in cleaned event files. If a bin has >2000 counts, and if more than 50% of those come from <1% of pixels, then it is considered to be noise-dominated and hence unusable.
| Quadrant | # 1 sec bins | Bins with >0 counts | Bins with >2000 counts | High rate bins dominated by noise | Noise dominated (total time) | Noise dominated (detector-on time) | Marked lightcurve |
|---|---|---|---|---|---|---|---|
| A | 117339 | 86270 | 0 | 0 | 0.00% | 0.00% | 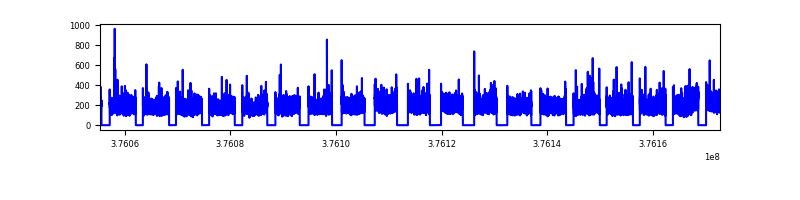 |
| B | 117339 | 86188 | 0 | 0 | 0.00% | 0.00% |  |
| C | 117339 | 86262 | 0 | 0 | 0.00% | 0.00% |  |
| D | 117338 | 86038 | 0 | 0 | 0.00% | 0.00% |  |
Top three noisy pixels from each quadrant. If the there are fewer than three noisy pixels in the level2.evt file, extra rows are filled as -1
| Pixel properties | Quadrant properties | ||||||
|---|---|---|---|---|---|---|---|
| Quadrant | DetID | PixID | Counts | Sigma | Mean | Median | Sigma |
| A | 9 | 19 | 4097 | 8.86 | 1302 | 1225 | 324.1 |
| A | 7 | 110 | 4055 | 8.73 | 1302 | 1225 | 324.1 |
| A | 0 | 29 | 3937 | 8.37 | 1302 | 1225 | 324.1 |
| B | 2 | 9 | 3878 | 11.42 | 1203 | 1150 | 238.8 |
| B | 3 | 80 | 3518 | 9.91 | 1203 | 1150 | 238.8 |
| B | 2 | 8 | 3167 | 8.44 | 1203 | 1150 | 238.8 |
| C | 3 | 203 | 3701 | 7.94 | 1257 | 1181 | 317.5 |
| C | 3 | 202 | 3690 | 7.9 | 1257 | 1181 | 317.5 |
| C | 3 | 187 | 3242 | 6.49 | 1257 | 1181 | 317.5 |
| D | 7 | 3 | 2901 | 6.24 | 1123 | 1022 | 301.1 |
| D | 6 | 62 | 2879 | 6.17 | 1123 | 1022 | 301.1 |
| D | 4 | 160 | 2854 | 6.08 | 1123 | 1022 | 301.1 |
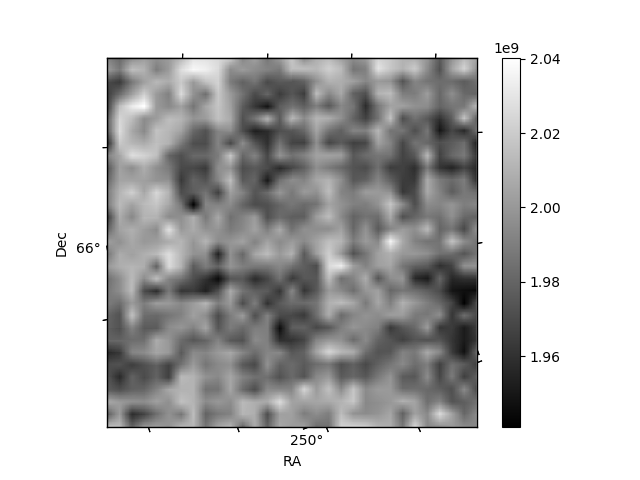
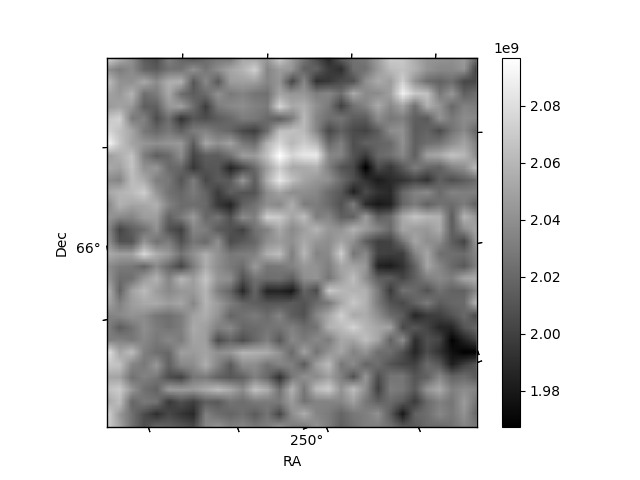
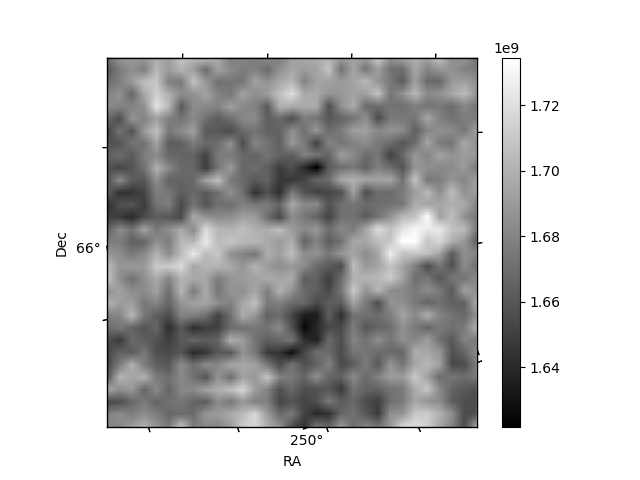
Histogram calculated using DETX and DETY for each event in the final _common_clean file
| Quadrant A | 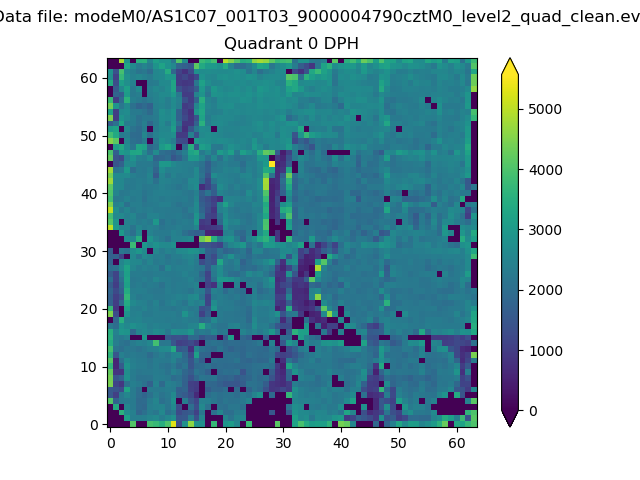 |
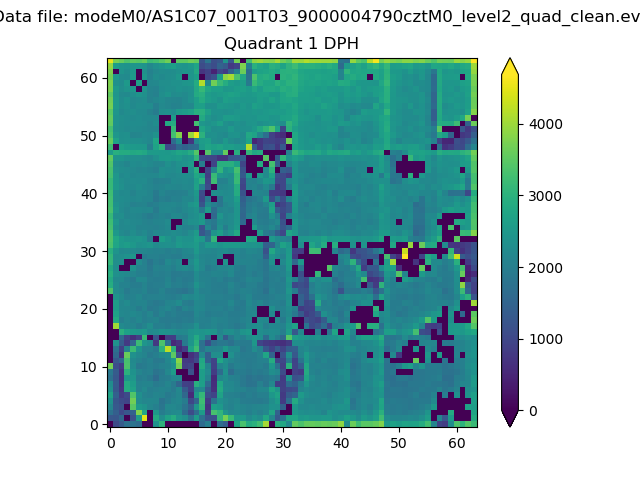 |
Quadrant B |
|---|---|---|---|
| Quadrant D | 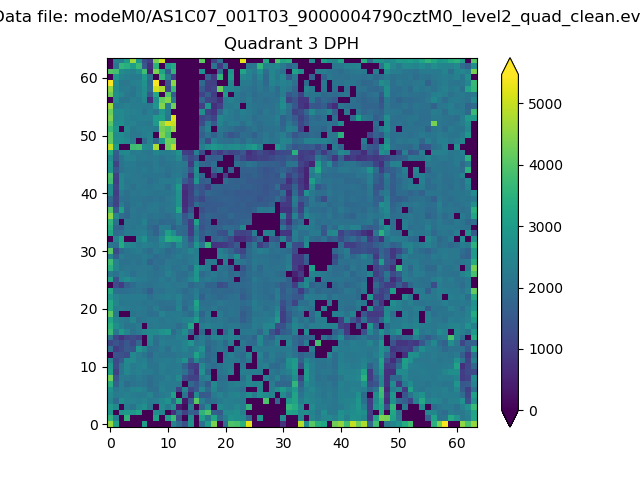 |
 |
Quadrant C |
| Plot type | Count rate plots | Images |
|---|---|---|
| Comparison with Poisson distribution Blue bars denote a histogram of data divided into 1 sec bins. Red curve is a Poisson curve with rate = median count rate of data. |
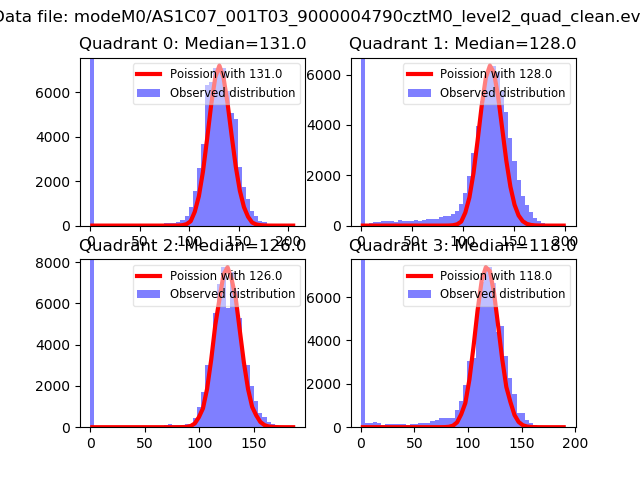 |
 |
| Quadrant-wise count rates Data is divided into 100 sec bins |
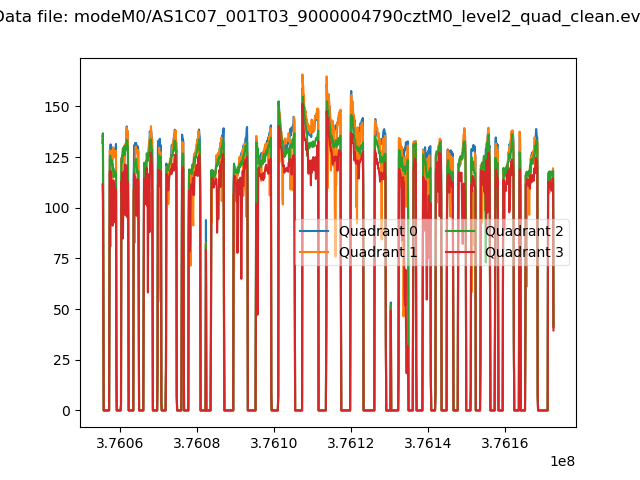 |
|
| Module-wise count rates for Quadrant A Data is divided into 100 sec bins |
 |
 |
| Module-wise count rates for Quadrant B Data is divided into 100 sec bins |
 |
 |
| Module-wise count rates for Quadrant C Data is divided into 100 sec bins |
 |
 |
| Module-wise count rates for Quadrant D Data is divided into 100 sec bins |
 |
 |
| Parameter | Plot |
|---|---|
| CZT HV Monitor |  |
| D_VDD |  |
| Temperature 1 |  |
| Veto HV Monitor |  |
| Veto LLD |  |
| Alpha Counter |  |
| _CPM_Rate |  |
| CZT Counter |  |
| +2.5 Volts monitor |  |
| +5 Volts monitor |  |
| _ROLL_ROT | 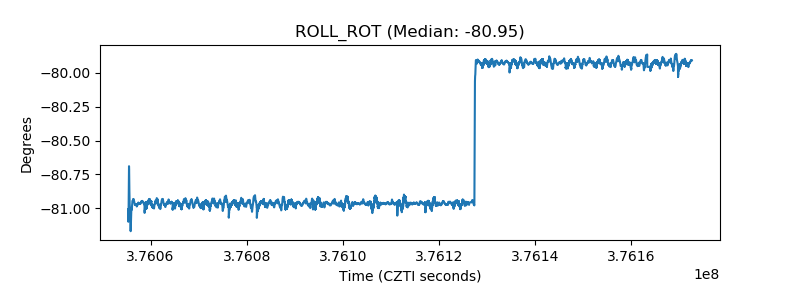 |
| _Roll_DEC |  |
| _Roll_RA |  |
| Veto Counter |  |