| Param | Original file | Final file |
|---|---|---|
| Filename | modeM0/AS1C07_001T03_9000004790_33398cztM0_level2.evt | modeM0/AS1C07_001T03_9000004790_33398cztM0_level2_quad_clean.evt |
| Size (bytes) | 117,169,920 | 20,813,760 |
| Size | 111.7 MB | 19.8 MB |
| Events in quadrant A | 519,211 | 145,613 |
| Events in quadrant B | 911,029 | 140,492 |
| Events in quadrant C | 619,261 | 139,481 |
| Events in quadrant D | 1,420,406 | 119,174 |
| Mode SS | |||
|---|---|---|---|
| Quadrant | BADHDUFLAG | Total packets | Discarded packets |
| A | 0 | 24 | 0 |
| B | 0 | 24 | 0 |
| C | 0 | 24 | 0 |
| D | 0 | 24 | 0 |
| Mode M0 | |||
|---|---|---|---|
| Quadrant | BADHDUFLAG | Total packets | Discarded packets |
| A | 0 | 2244 | 2 |
| B | 0 | 3432 | 1 |
| C | 0 | 2490 | 1 |
| D | 0 | 4988 | 1 |
| Mode M9 | |||
|---|---|---|---|
| Quadrant | BADHDUFLAG | Total packets | Discarded packets |
| A | 0 | 16 | 0 |
| B | 0 | 16 | 0 |
| C | 0 | 16 | 0 |
| D | 0 | 16 | 0 |
| Quadrant | Total seconds | Saturated seconds | Saturation percentage |
|---|---|---|---|
| A | 1117 | 2 | 0.179051% |
| B | 1117 | 89 | 7.967771% |
| C | 1117 | 21 | 1.880036% |
| D | 1117 | 254 | 22.739481% |
Noise dominated data is calculated using 1-second bins in cleaned event files. If a bin has >2000 counts, and if more than 50% of those come from <1% of pixels, then it is considered to be noise-dominated and hence unusable.
| Quadrant | # 1 sec bins | Bins with >0 counts | Bins with >2000 counts | High rate bins dominated by noise | Noise dominated (total time) | Noise dominated (detector-on time) | Marked lightcurve |
|---|---|---|---|---|---|---|---|
| A | 2700 | 1118 | 0 | 0 | 0.00% | 0.00% | 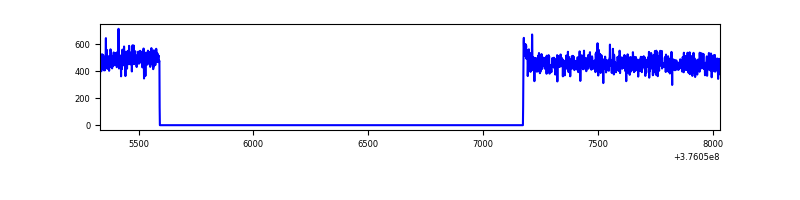 |
| B | 2700 | 1118 | 66 | 66 | 2.44% | 5.90% | 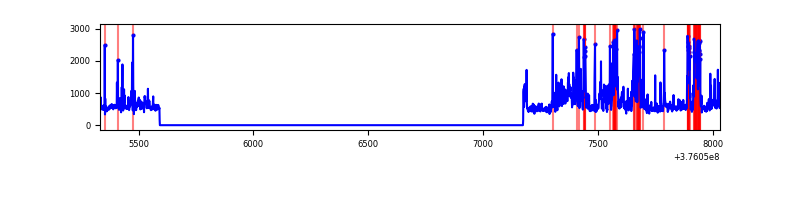 |
| C | 2700 | 1118 | 15 | 15 | 0.56% | 1.34% | 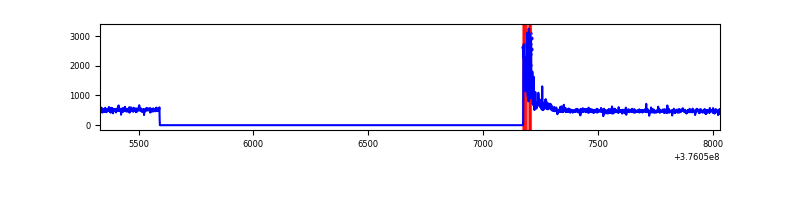 |
| D | 2700 | 1118 | 216 | 216 | 8.00% | 19.32% | 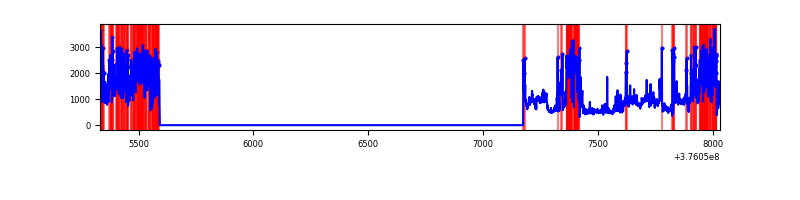 |
Top three noisy pixels from each quadrant. If the there are fewer than three noisy pixels in the level2.evt file, extra rows are filled as -1
| Pixel properties | Quadrant properties | ||||||
|---|---|---|---|---|---|---|---|
| Quadrant | DetID | PixID | Counts | Sigma | Mean | Median | Sigma |
| A | 13 | 254 | 1950 | 64.94 | 133 | 130 | 28.0 |
| A | 10 | 83 | 1730 | 57.09 | 133 | 130 | 28.0 |
| A | 13 | 6 | 1378 | 44.53 | 133 | 130 | 28.0 |
| B | 5 | 172 | 252499 | 9484.68 | 126 | 123 | 26.6 |
| B | 4 | 170 | 34185 | 1280.1 | 126 | 123 | 26.6 |
| B | 0 | 245 | 32498 | 1216.7 | 126 | 123 | 26.6 |
| C | 0 | 10 | 77378 | 2582.51 | 124 | 125 | 29.9 |
| C | 15 | 214 | 51031 | 1701.75 | 124 | 125 | 29.9 |
| C | 10 | 49 | 2293 | 72.47 | 124 | 125 | 29.9 |
| D | 8 | 195 | 270135 | 8980.15 | 116 | 112 | 30.1 |
| D | 2 | 250 | 181856 | 6044.26 | 116 | 112 | 30.1 |
| D | 12 | 218 | 160324 | 5328.17 | 116 | 112 | 30.1 |
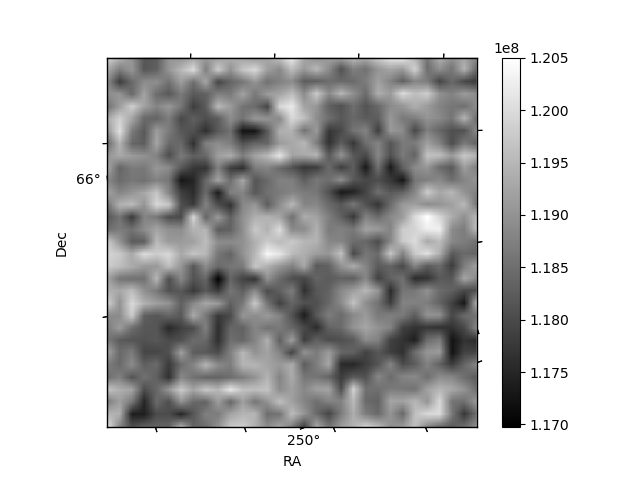
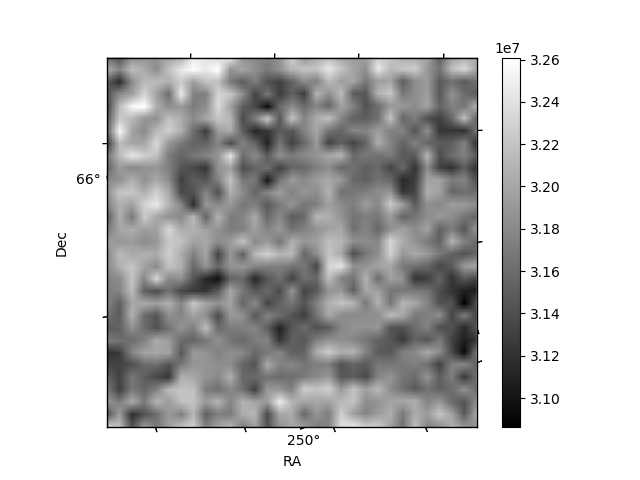
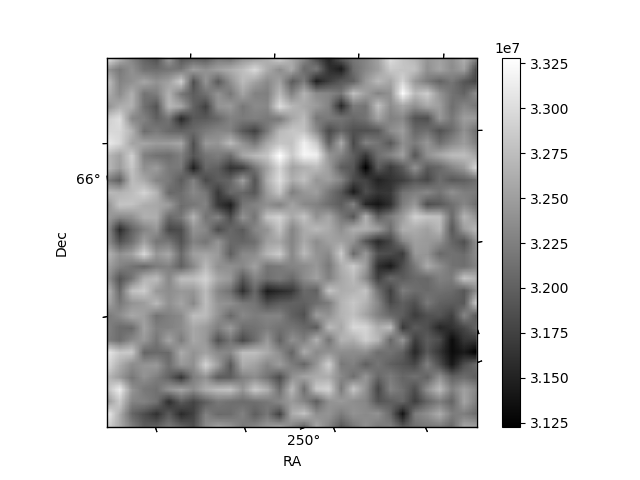
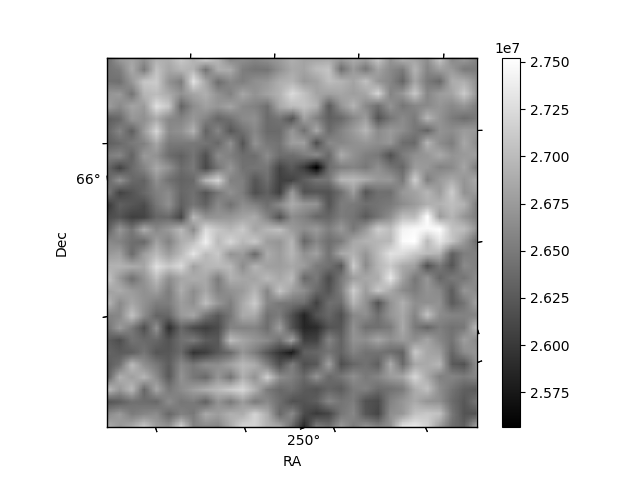
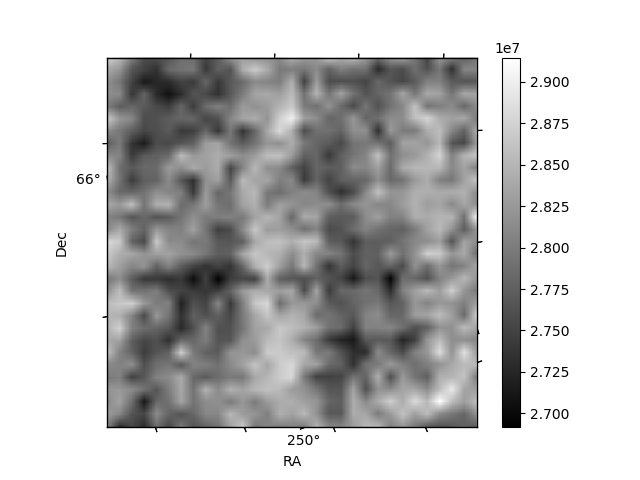
Histogram calculated using DETX and DETY for each event in the final _common_clean file
| Quadrant A | 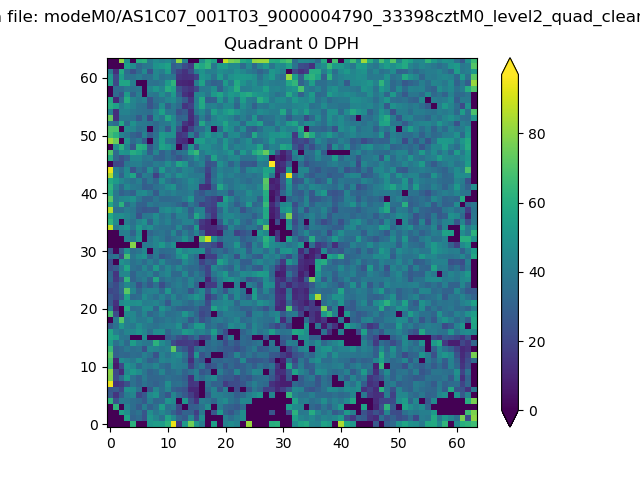 |
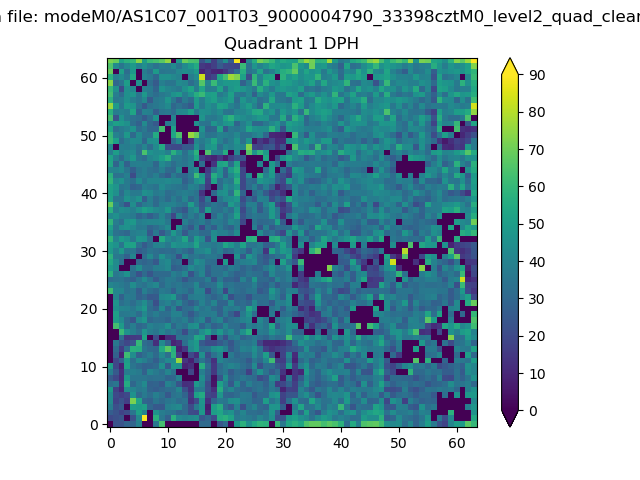 |
Quadrant B |
|---|---|---|---|
| Quadrant D | 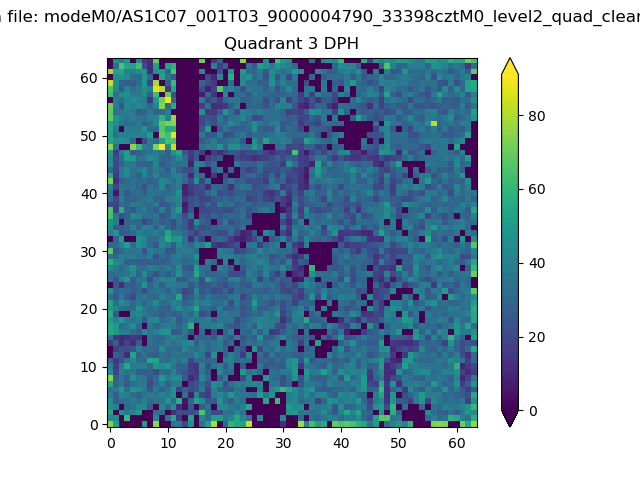 |
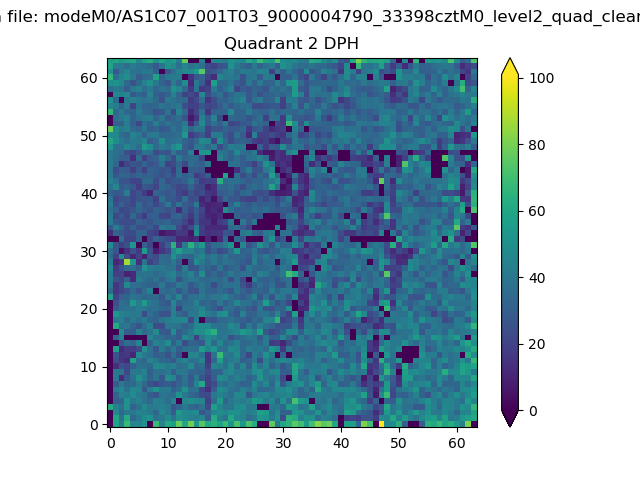 |
Quadrant C |
| Plot type | Count rate plots | Images |
|---|---|---|
| Comparison with Poisson distribution Blue bars denote a histogram of data divided into 1 sec bins. Red curve is a Poisson curve with rate = median count rate of data. |
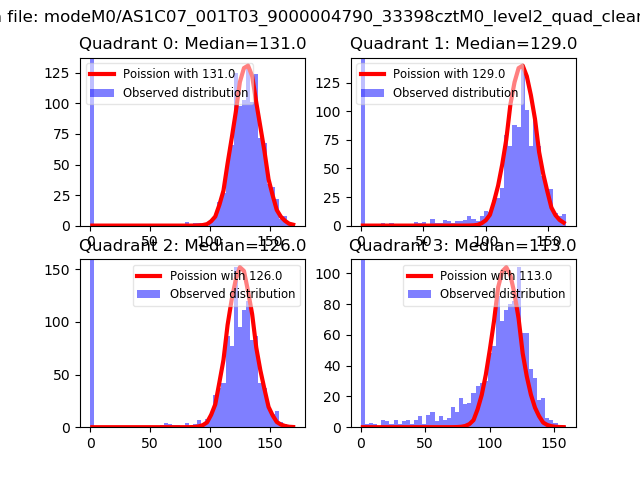 |
 |
| Quadrant-wise count rates Data is divided into 100 sec bins |
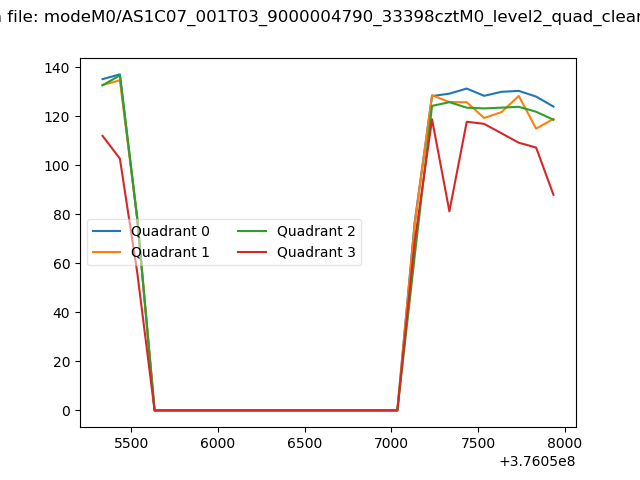 |
|
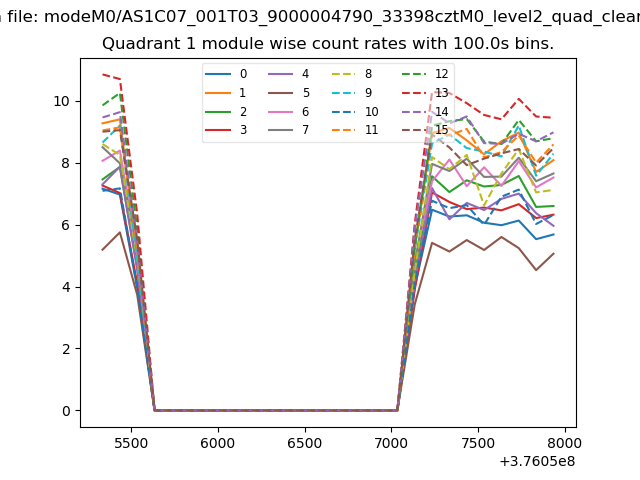
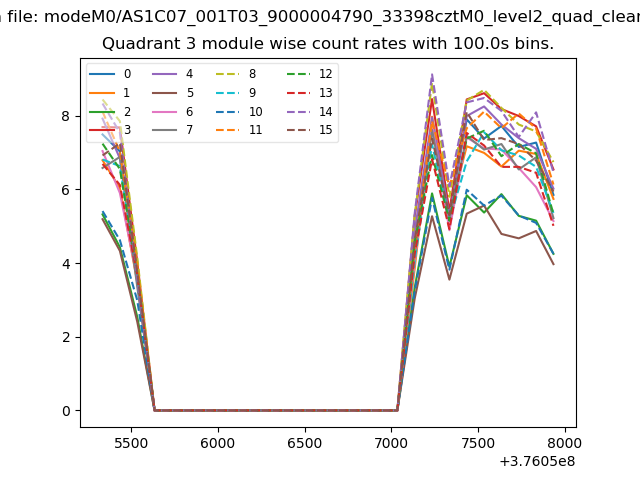
| Module-wise count rates for Quadrant A Data is divided into 100 sec bins |
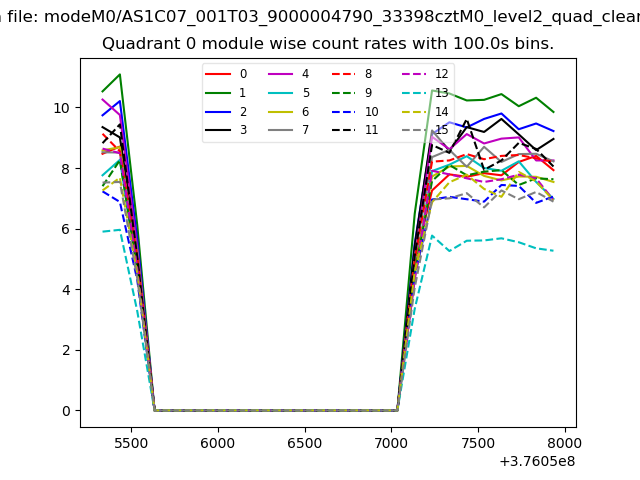 |
 |
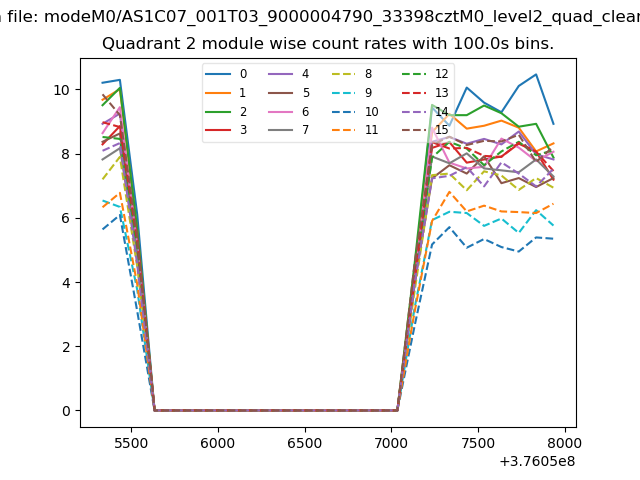
| Module-wise count rates for Quadrant B Data is divided into 100 sec bins |
 |
 |
| Module-wise count rates for Quadrant C Data is divided into 100 sec bins |
 |
 |
| Module-wise count rates for Quadrant D Data is divided into 100 sec bins |
 |
 |
| Parameter | Plot |
|---|---|
| CZT HV Monitor | 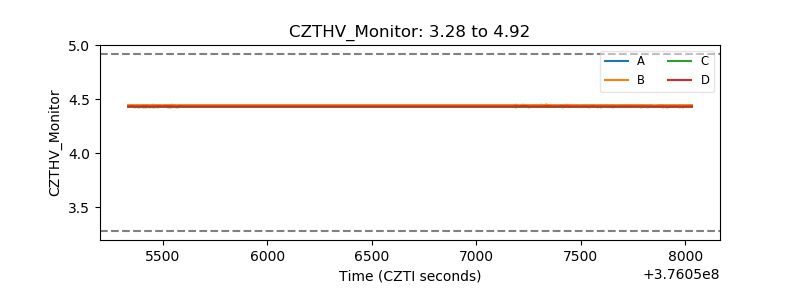 |
| D_VDD | 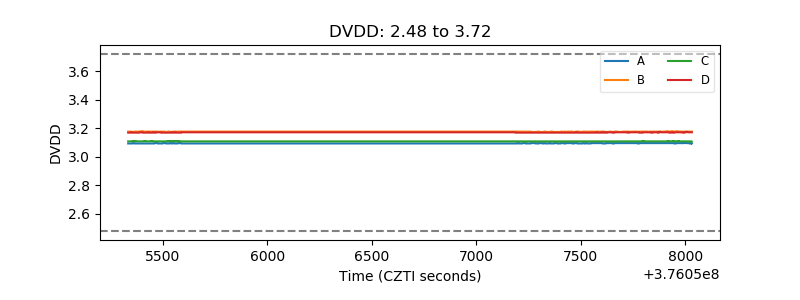 |
| Temperature 1 | 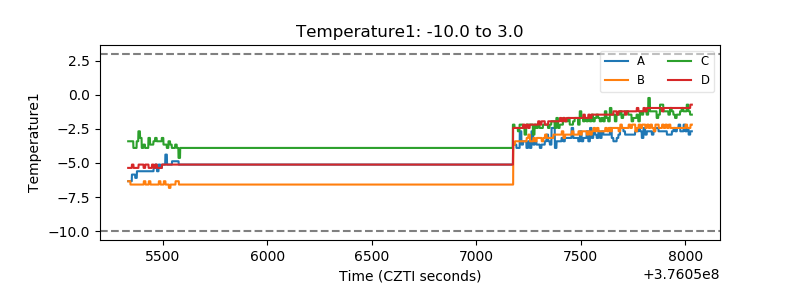 |
| Veto HV Monitor | 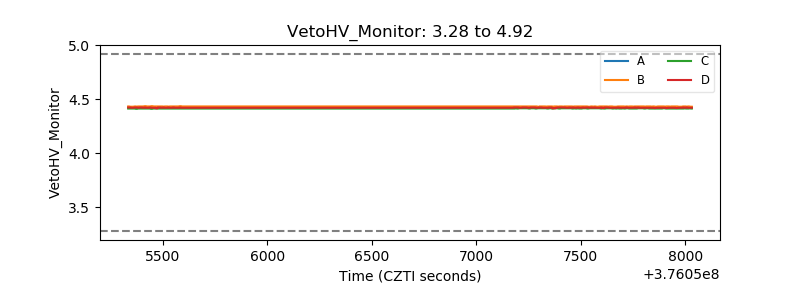 |
| Veto LLD | 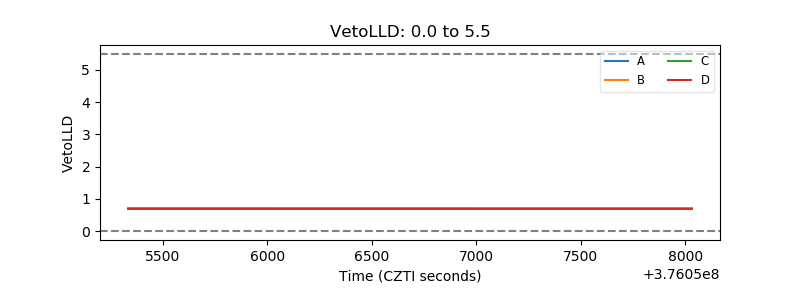 |
| Alpha Counter | 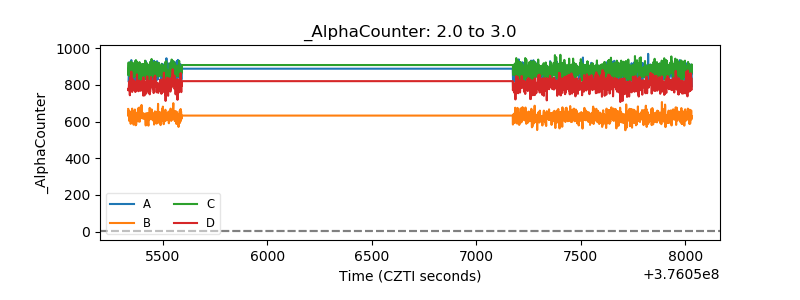 |
| _CPM_Rate | 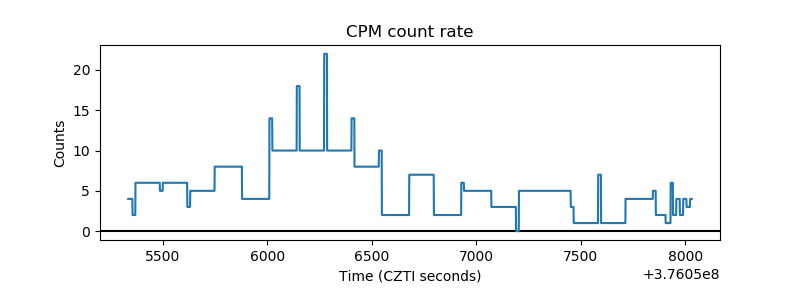 |
| CZT Counter | 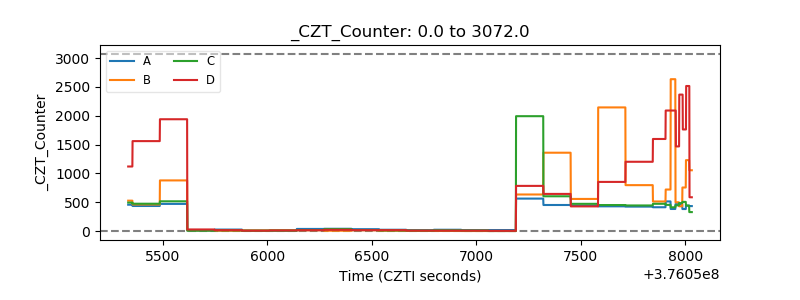 |
| +2.5 Volts monitor |  |
| +5 Volts monitor |  |
| _ROLL_ROT | 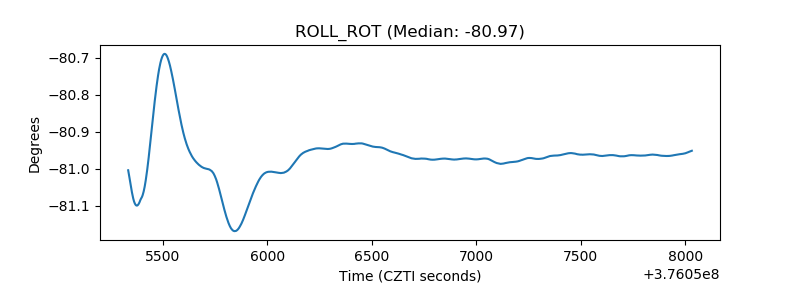 |
| _Roll_DEC | 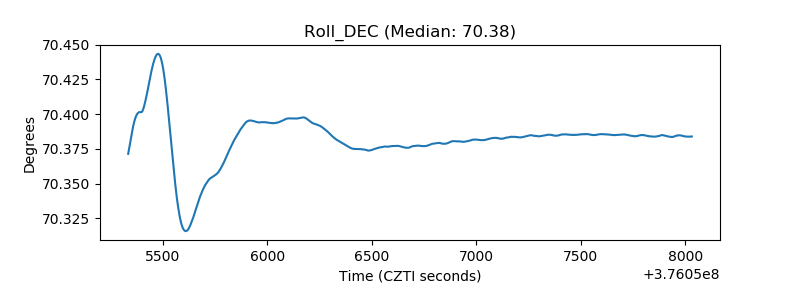 |
| _Roll_RA | 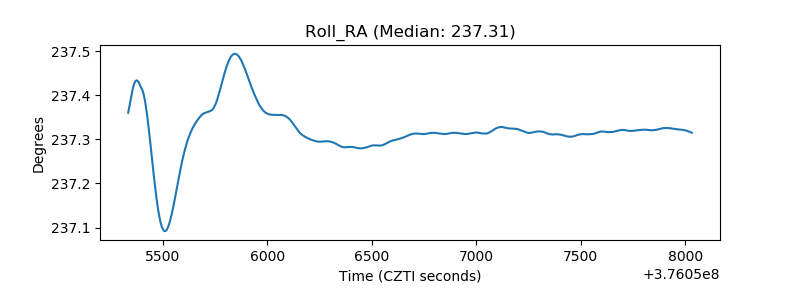 |
| Veto Counter | 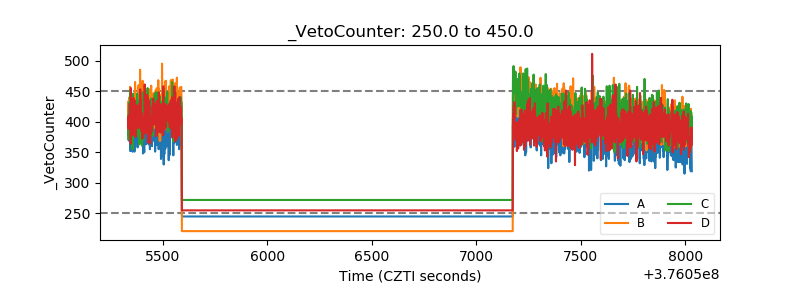 |