| Param | Original file | Final file |
|---|---|---|
| Filename | modeM0/AS1C07_001T03_9000004790_33399cztM0_level2.evt | modeM0/AS1C07_001T03_9000004790_33399cztM0_level2_quad_clean.evt |
| Size (bytes) | 559,903,680 | 85,965,120 |
| Size | 534.0 MB | 82.0 MB |
| Events in quadrant A | 2,625,863 | 583,975 |
| Events in quadrant B | 3,972,946 | 561,675 |
| Events in quadrant C | 3,118,125 | 558,734 |
| Events in quadrant D | 6,847,385 | 493,412 |
| Mode SS | |||
|---|---|---|---|
| Quadrant | BADHDUFLAG | Total packets | Discarded packets |
| A | 0 | 116 | 0 |
| B | 0 | 116 | 0 |
| C | 0 | 116 | 0 |
| D | 0 | 116 | 0 |
| Mode M0 | |||
|---|---|---|---|
| Quadrant | BADHDUFLAG | Total packets | Discarded packets |
| A | 0 | 11665 | 3 |
| B | 0 | 15424 | 2 |
| C | 0 | 12710 | 2 |
| D | 0 | 24423 | 2 |
| Mode M9 | |||
|---|---|---|---|
| Quadrant | BADHDUFLAG | Total packets | Discarded packets |
| A | 0 | 19 | 0 |
| B | 0 | 19 | 0 |
| C | 0 | 19 | 0 |
| D | 0 | 20 | 0 |
| Quadrant | Total seconds | Saturated seconds | Saturation percentage |
|---|---|---|---|
| A | 5802 | 7 | 0.120648% |
| B | 5802 | 380 | 6.549466% |
| C | 5802 | 50 | 0.861772% |
| D | 5802 | 734 | 12.650810% |
Noise dominated data is calculated using 1-second bins in cleaned event files. If a bin has >2000 counts, and if more than 50% of those come from <1% of pixels, then it is considered to be noise-dominated and hence unusable.
| Quadrant | # 1 sec bins | Bins with >0 counts | Bins with >2000 counts | High rate bins dominated by noise | Noise dominated (total time) | Noise dominated (detector-on time) | Marked lightcurve |
|---|---|---|---|---|---|---|---|
| A | 7145 | 5803 | 0 | 0 | 0.00% | 0.00% | 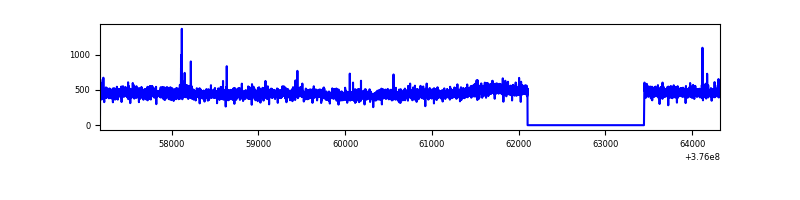 |
| B | 7145 | 5803 | 287 | 287 | 4.02% | 4.95% | 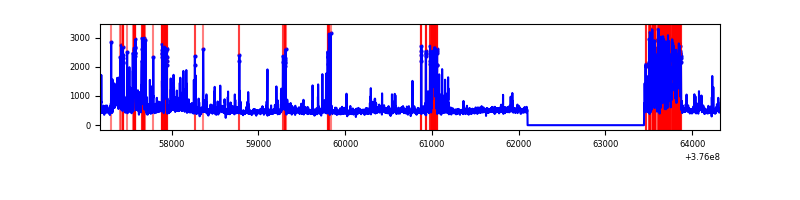 |
| C | 7145 | 5803 | 43 | 43 | 0.60% | 0.74% | 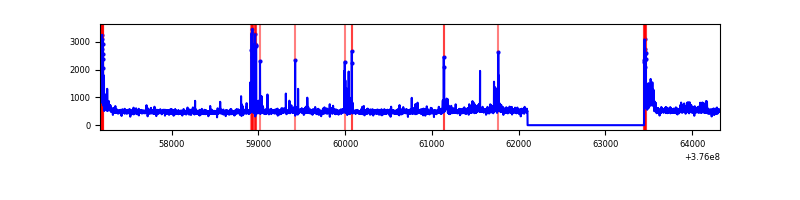 |
| D | 7145 | 5803 | 646 | 646 | 9.04% | 11.13% | 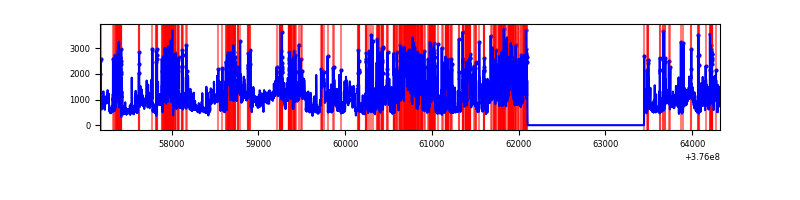 |
Top three noisy pixels from each quadrant. If the there are fewer than three noisy pixels in the level2.evt file, extra rows are filled as -1
| Pixel properties | Quadrant properties | ||||||
|---|---|---|---|---|---|---|---|
| Quadrant | DetID | PixID | Counts | Sigma | Mean | Median | Sigma |
| A | 13 | 6 | 12980 | 91.62 | 673 | 661 | 134.5 |
| A | 9 | 254 | 10900 | 76.15 | 673 | 661 | 134.5 |
| A | 13 | 254 | 10257 | 71.37 | 673 | 661 | 134.5 |
| B | 5 | 172 | 1018570 | 8184.04 | 651 | 633 | 124.4 |
| B | 0 | 219 | 93383 | 745.69 | 651 | 633 | 124.4 |
| B | 4 | 170 | 61199 | 486.94 | 651 | 633 | 124.4 |
| C | 15 | 214 | 249647 | 1678.88 | 646 | 649 | 148.3 |
| C | 0 | 10 | 186164 | 1250.84 | 646 | 649 | 148.3 |
| C | 14 | 254 | 97464 | 652.78 | 646 | 649 | 148.3 |
| D | 8 | 195 | 1768192 | 11536.95 | 619 | 601 | 153.2 |
| D | 14 | 173 | 756013 | 4930.52 | 619 | 601 | 153.2 |
| D | 12 | 218 | 688645 | 4490.82 | 619 | 601 | 153.2 |
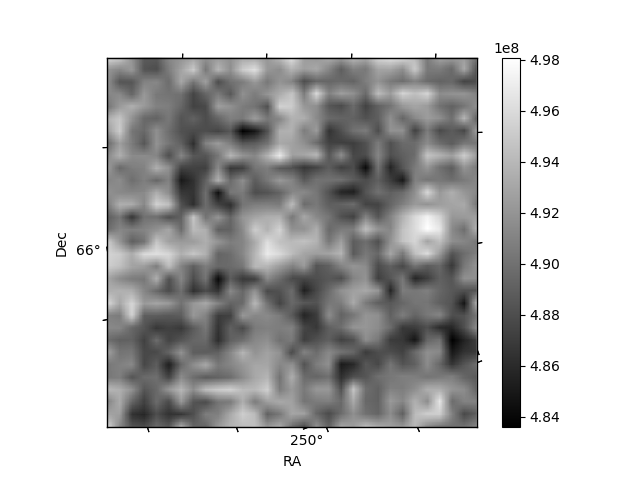
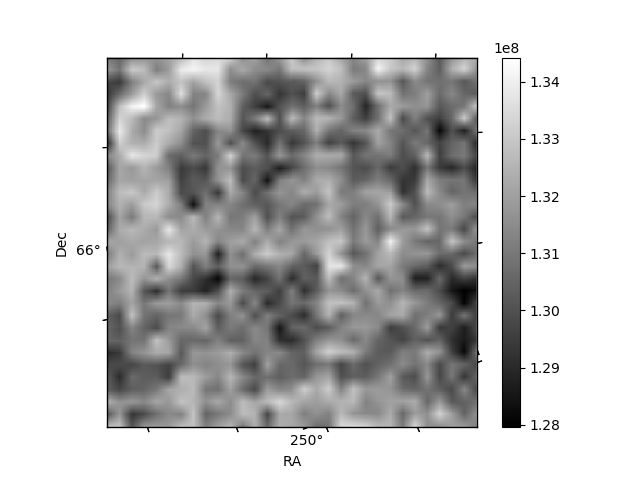
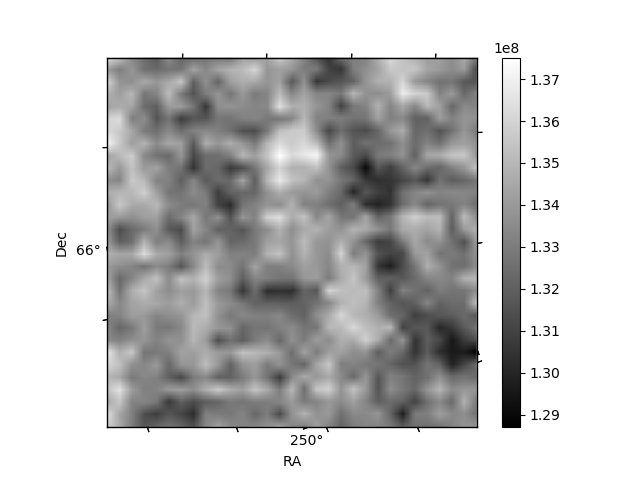
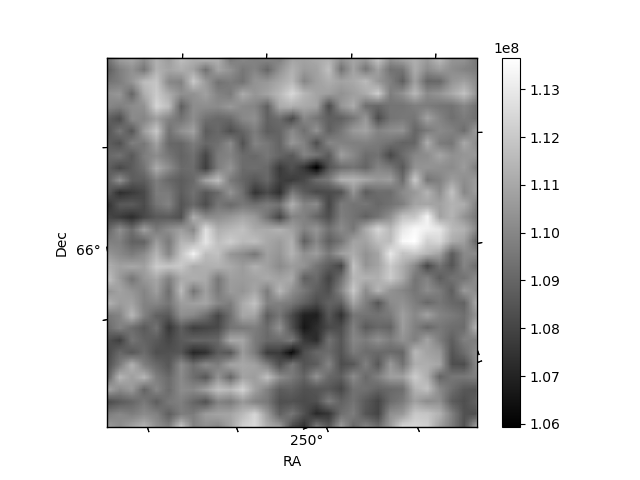
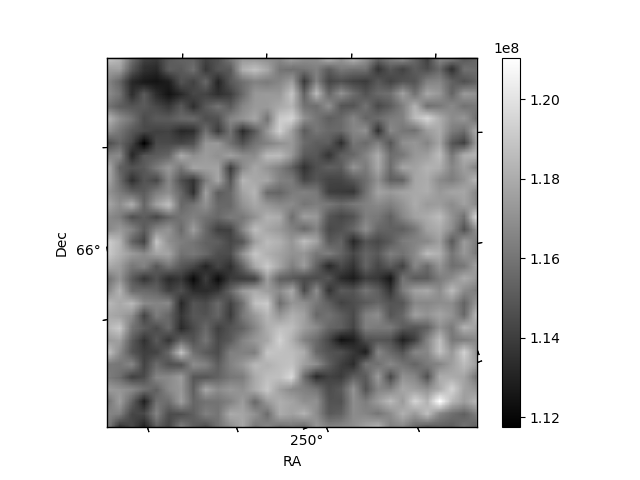
Histogram calculated using DETX and DETY for each event in the final _common_clean file
| Quadrant A | 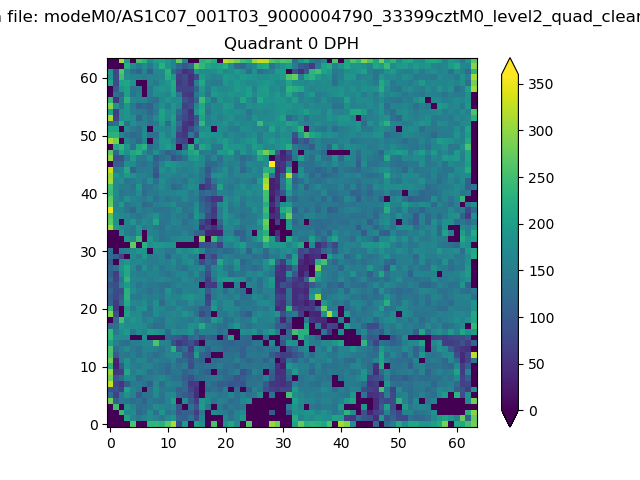 |
 |
Quadrant B |
|---|---|---|---|
| Quadrant D | 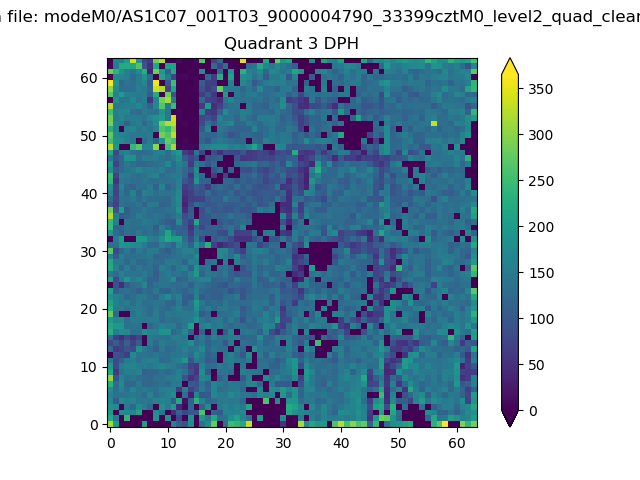 |
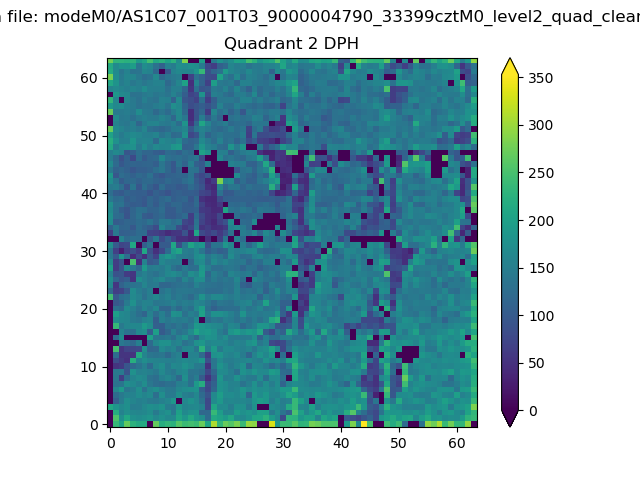 |
Quadrant C |
| Plot type | Count rate plots | Images |
|---|---|---|
| Comparison with Poisson distribution Blue bars denote a histogram of data divided into 1 sec bins. Red curve is a Poisson curve with rate = median count rate of data. |
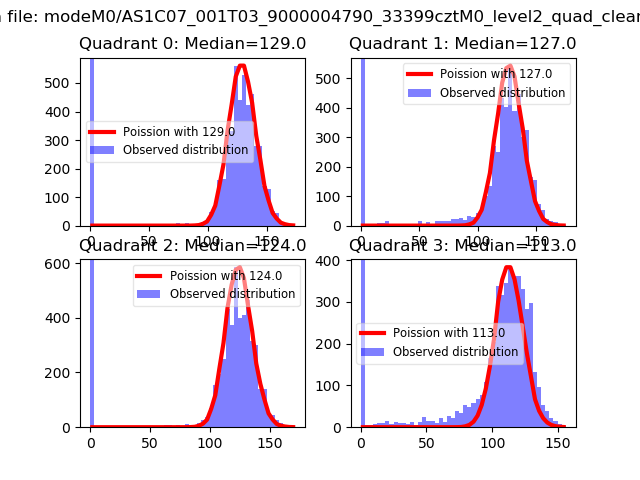 |
 |
| Quadrant-wise count rates Data is divided into 100 sec bins |
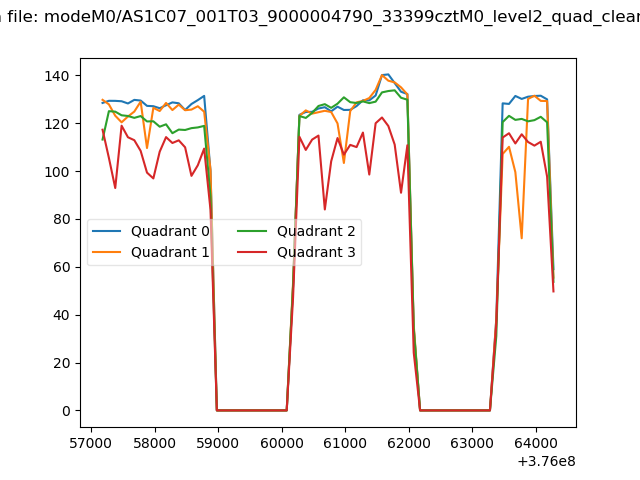 |
|
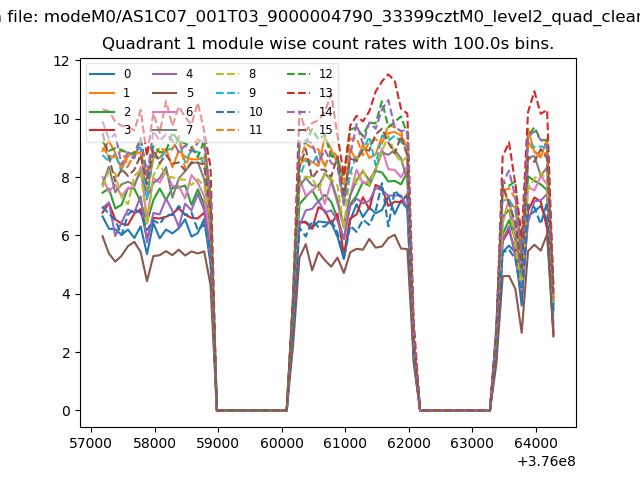
| Module-wise count rates for Quadrant A Data is divided into 100 sec bins |
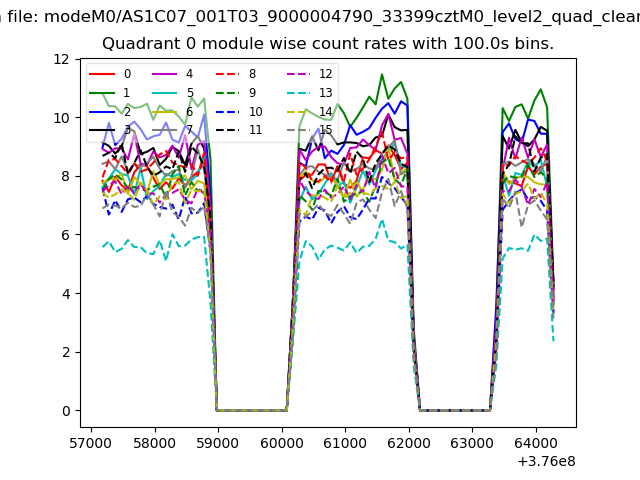 |
 |
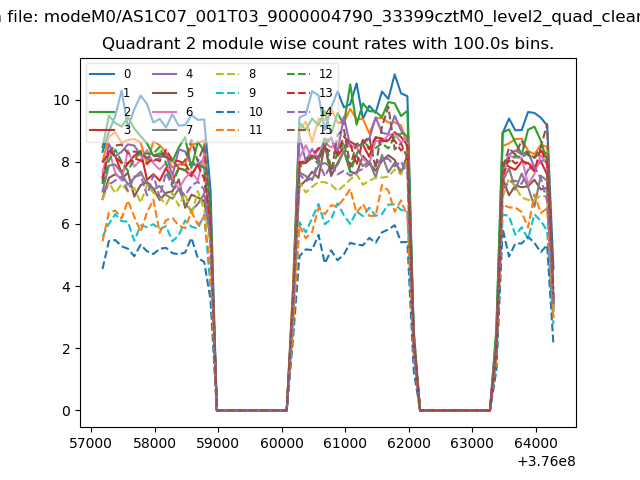
| Module-wise count rates for Quadrant B Data is divided into 100 sec bins |
 |
 |
| Module-wise count rates for Quadrant C Data is divided into 100 sec bins |
 |
 |
| Module-wise count rates for Quadrant D Data is divided into 100 sec bins |
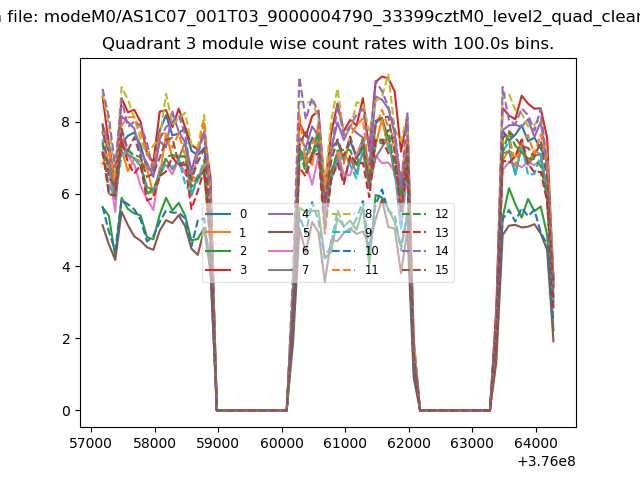 |
 |
| Parameter | Plot |
|---|---|
| CZT HV Monitor | 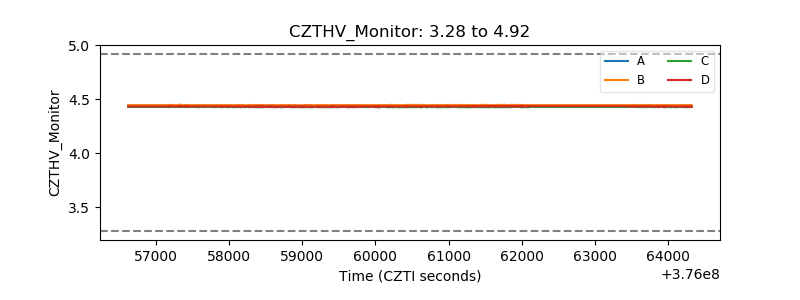 |
| D_VDD | 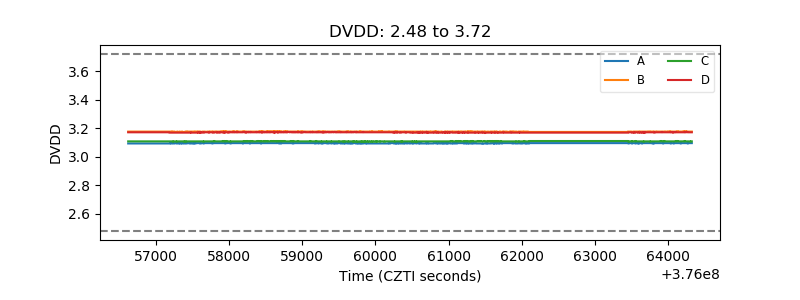 |
| Temperature 1 | 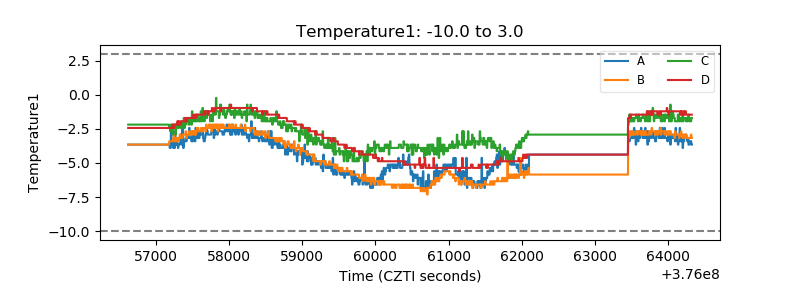 |
| Veto HV Monitor | 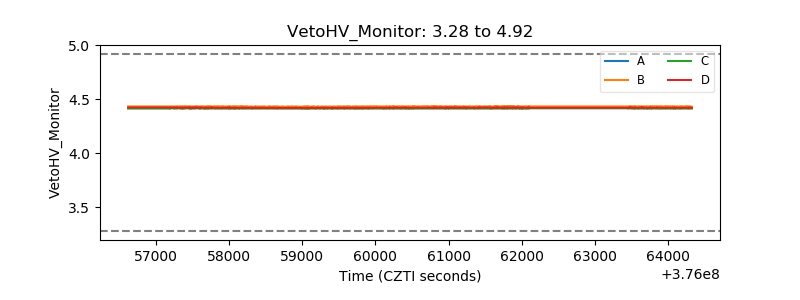 |
| Veto LLD | 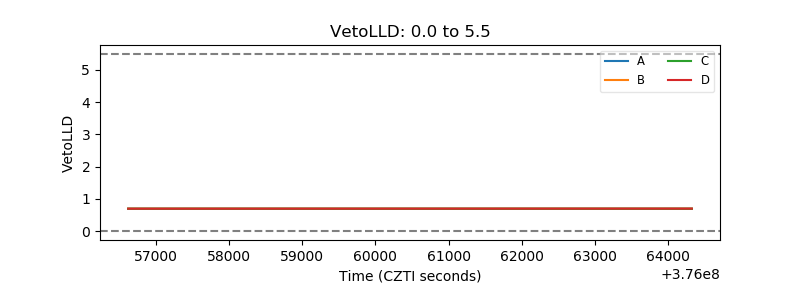 |
| Alpha Counter | 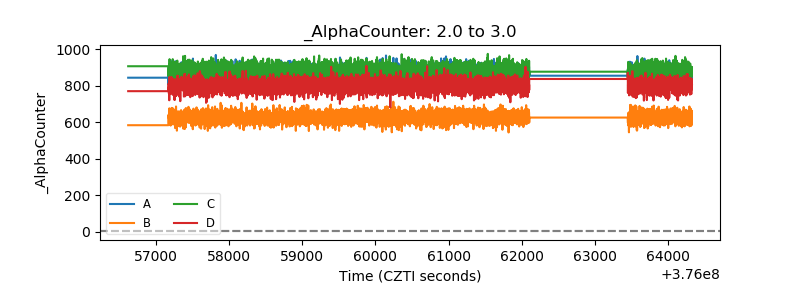 |
| _CPM_Rate | 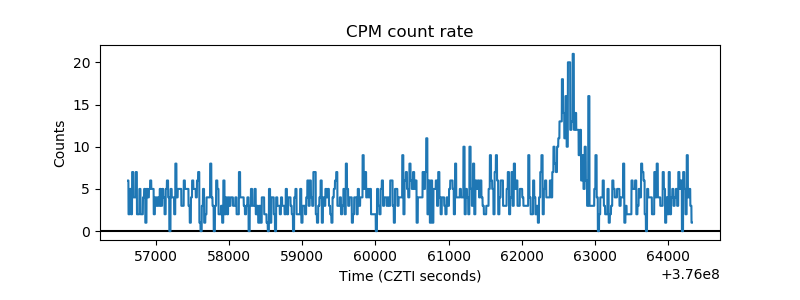 |
| CZT Counter | 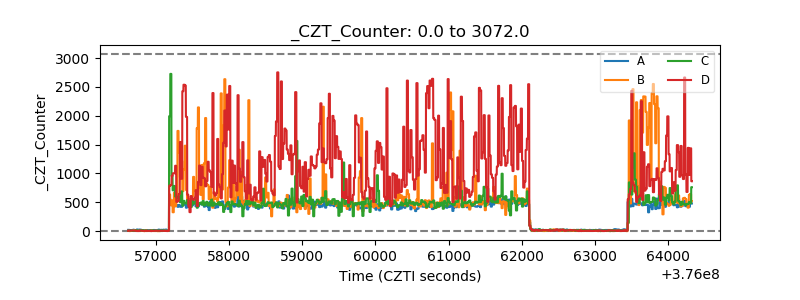 |
| +2.5 Volts monitor |  |
| +5 Volts monitor | 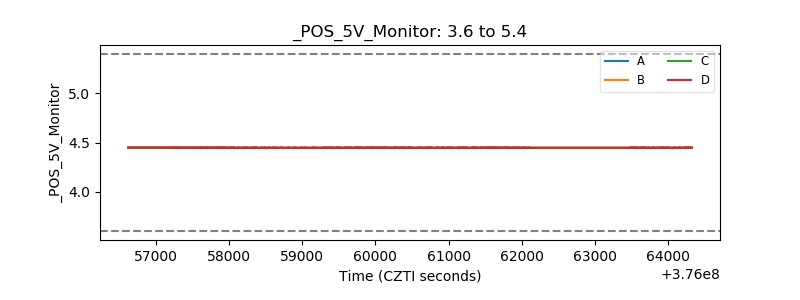 |
| _ROLL_ROT | 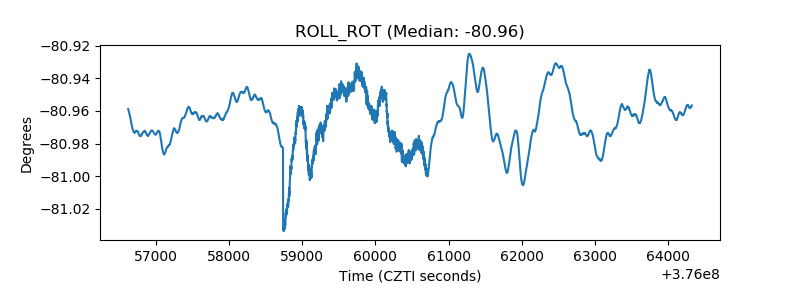 |
| _Roll_DEC | 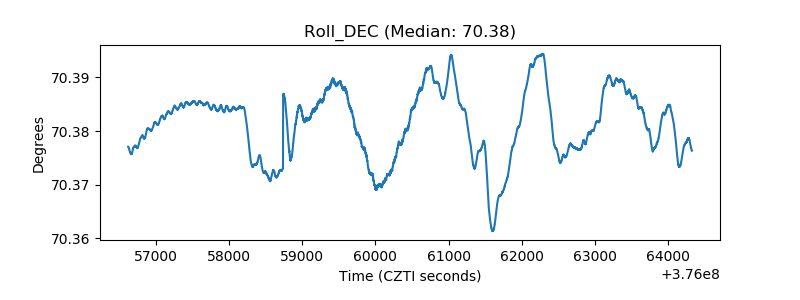 |
| _Roll_RA | 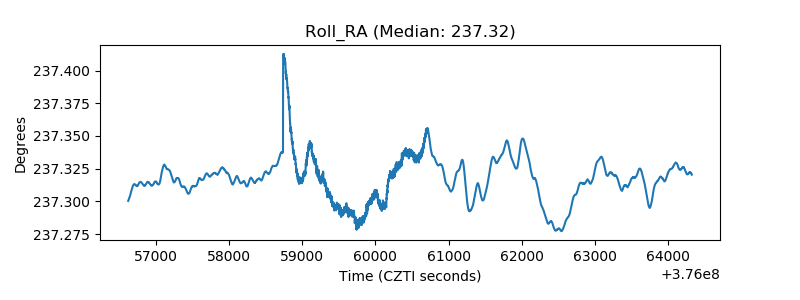 |
| Veto Counter | 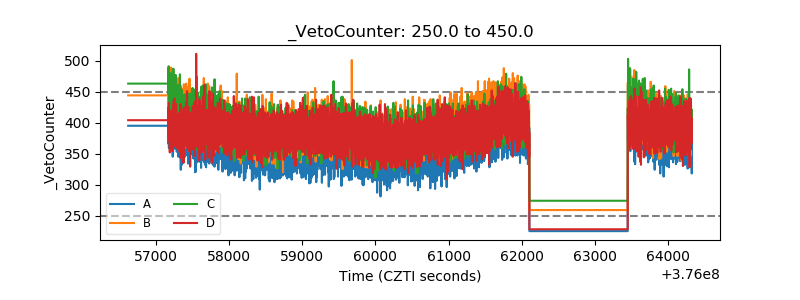 |