| Param | Original file | Final file |
|---|---|---|
| Filename | modeM0/AS1C07_001T03_9000004790_33400cztM0_level2.evt | modeM0/AS1C07_001T03_9000004790_33400cztM0_level2_quad_clean.evt |
| Size (bytes) | 550,546,560 | 86,679,360 |
| Size | 525.0 MB | 82.7 MB |
| Events in quadrant A | 2,652,733 | 591,707 |
| Events in quadrant B | 4,562,757 | 544,516 |
| Events in quadrant C | 3,169,679 | 566,231 |
| Events in quadrant D | 5,890,293 | 511,614 |
| Mode SS | |||
|---|---|---|---|
| Quadrant | BADHDUFLAG | Total packets | Discarded packets |
| A | 0 | 120 | 0 |
| B | 0 | 120 | 0 |
| C | 0 | 120 | 0 |
| D | 0 | 120 | 0 |
| Mode M0 | |||
|---|---|---|---|
| Quadrant | BADHDUFLAG | Total packets | Discarded packets |
| A | 0 | 11791 | 3 |
| B | 0 | 17300 | 2 |
| C | 0 | 12825 | 2 |
| D | 0 | 21614 | 2 |
| Mode M9 | |||
|---|---|---|---|
| Quadrant | BADHDUFLAG | Total packets | Discarded packets |
| A | 0 | 15 | 0 |
| B | 0 | 15 | 0 |
| C | 0 | 15 | 0 |
| D | 0 | 16 | 0 |
| Quadrant | Total seconds | Saturated seconds | Saturation percentage |
|---|---|---|---|
| A | 5870 | 11 | 0.187394% |
| B | 5870 | 707 | 12.044293% |
| C | 5870 | 55 | 0.936968% |
| D | 5870 | 508 | 8.654174% |
Noise dominated data is calculated using 1-second bins in cleaned event files. If a bin has >2000 counts, and if more than 50% of those come from <1% of pixels, then it is considered to be noise-dominated and hence unusable.
| Quadrant | # 1 sec bins | Bins with >0 counts | Bins with >2000 counts | High rate bins dominated by noise | Noise dominated (total time) | Noise dominated (detector-on time) | Marked lightcurve |
|---|---|---|---|---|---|---|---|
| A | 7183 | 5871 | 0 | 0 | 0.00% | 0.00% | 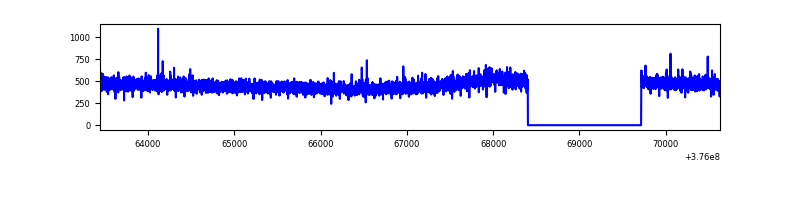 |
| B | 7183 | 5871 | 568 | 568 | 7.91% | 9.67% | 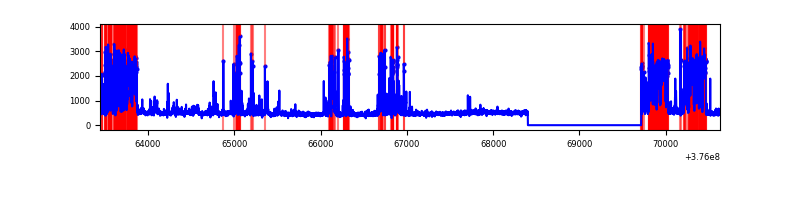 |
| C | 7183 | 5871 | 40 | 40 | 0.56% | 0.68% | 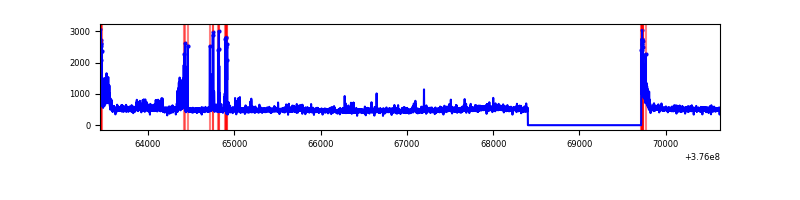 |
| D | 7183 | 5871 | 487 | 487 | 6.78% | 8.30% | 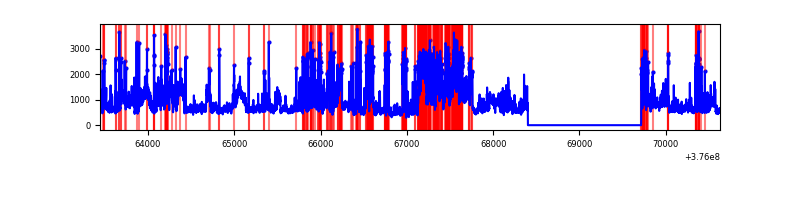 |
Top three noisy pixels from each quadrant. If the there are fewer than three noisy pixels in the level2.evt file, extra rows are filled as -1
| Pixel properties | Quadrant properties | ||||||
|---|---|---|---|---|---|---|---|
| Quadrant | DetID | PixID | Counts | Sigma | Mean | Median | Sigma |
| A | 13 | 6 | 10469 | 70.88 | 683 | 670 | 138.3 |
| A | 13 | 254 | 9990 | 67.41 | 683 | 670 | 138.3 |
| A | 3 | 137 | 6686 | 43.51 | 683 | 670 | 138.3 |
| B | 5 | 172 | 1836044 | 14892.12 | 641 | 625 | 123.2 |
| B | 4 | 170 | 44471 | 355.76 | 641 | 625 | 123.2 |
| B | 0 | 245 | 42948 | 343.4 | 641 | 625 | 123.2 |
| C | 15 | 214 | 252501 | 1645.08 | 659 | 663 | 153.1 |
| C | 0 | 10 | 192710 | 1254.5 | 659 | 663 | 153.1 |
| C | 1 | 23 | 100427 | 651.68 | 659 | 663 | 153.1 |
| D | 8 | 195 | 1248018 | 7869.12 | 641 | 623 | 158.5 |
| D | 14 | 173 | 677762 | 4271.69 | 641 | 623 | 158.5 |
| D | 12 | 218 | 596152 | 3756.86 | 641 | 623 | 158.5 |
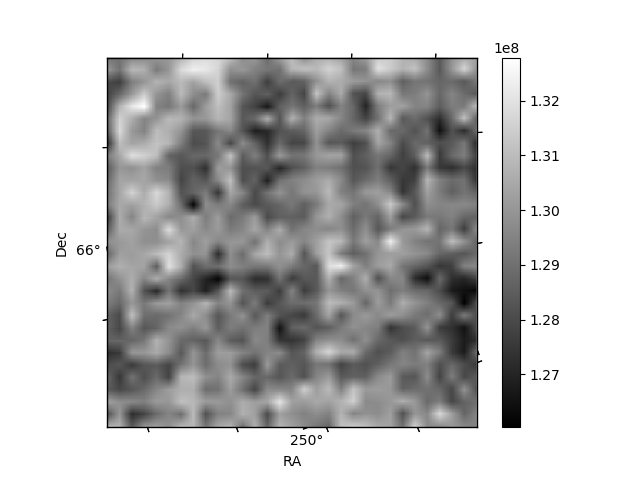
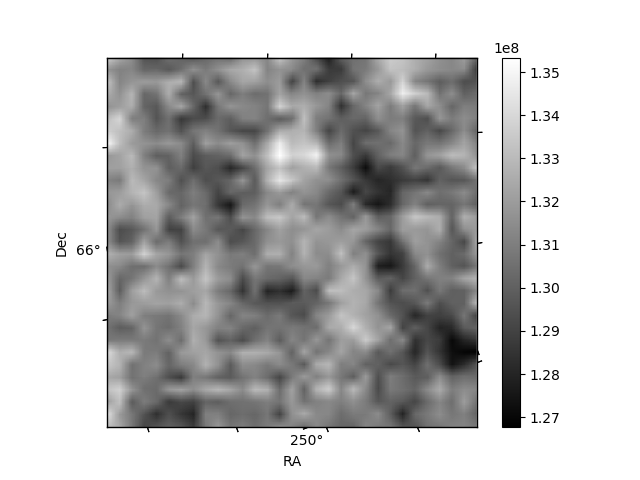
Histogram calculated using DETX and DETY for each event in the final _common_clean file
| Quadrant A |  |
 |
Quadrant B |
|---|---|---|---|
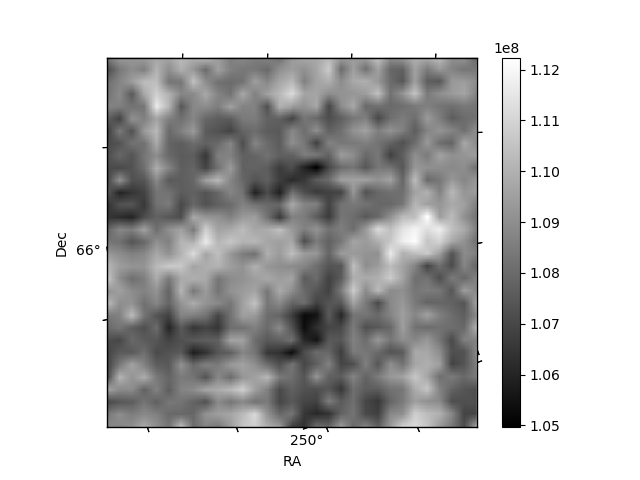
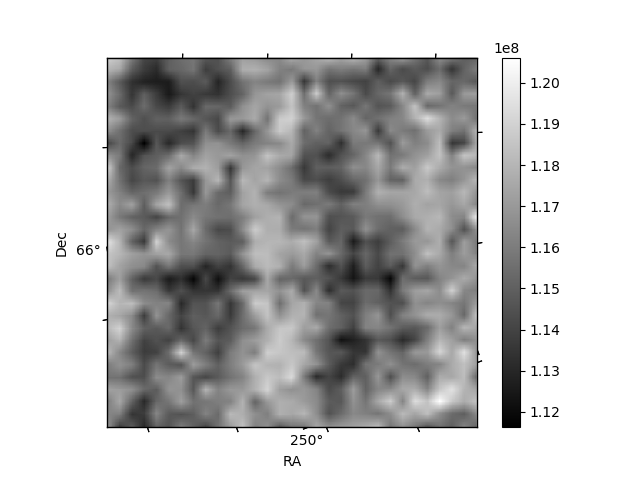
| Quadrant D | 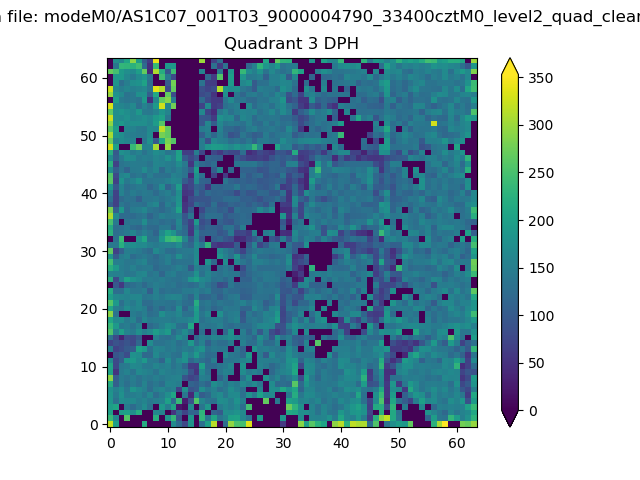 |
 |
Quadrant C |
| Plot type | Count rate plots | Images |
|---|---|---|
| Comparison with Poisson distribution Blue bars denote a histogram of data divided into 1 sec bins. Red curve is a Poisson curve with rate = median count rate of data. |
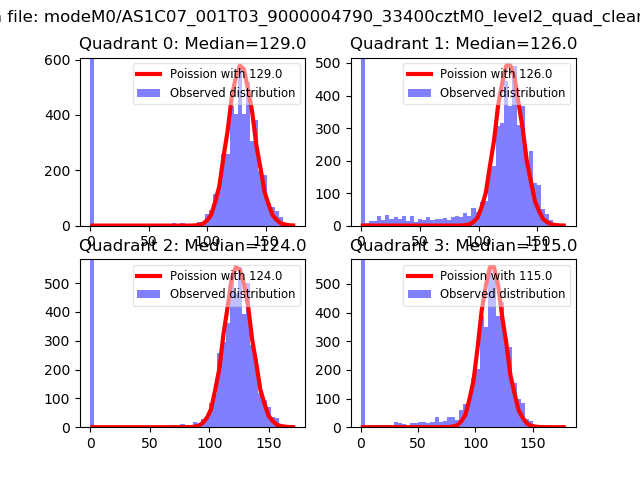 |
 |
| Quadrant-wise count rates Data is divided into 100 sec bins |
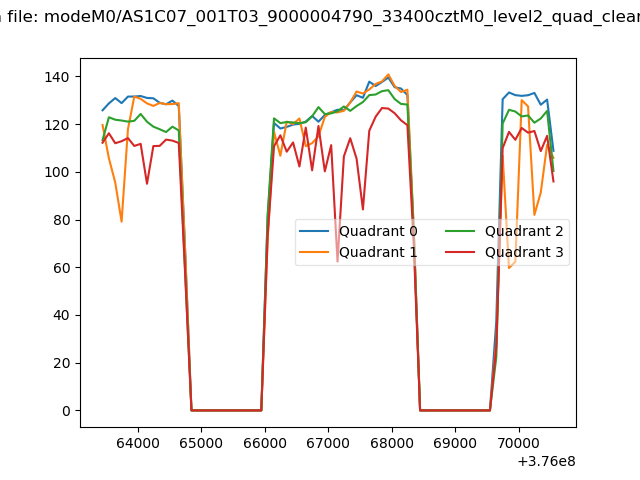 |
|
| Module-wise count rates for Quadrant A Data is divided into 100 sec bins |
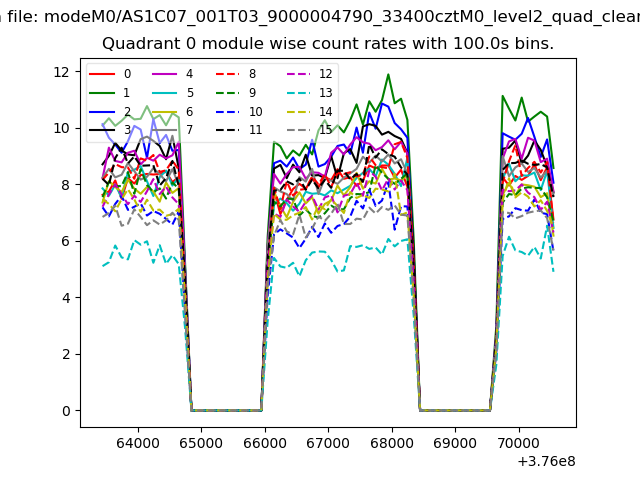 |
 |
| Module-wise count rates for Quadrant B Data is divided into 100 sec bins |
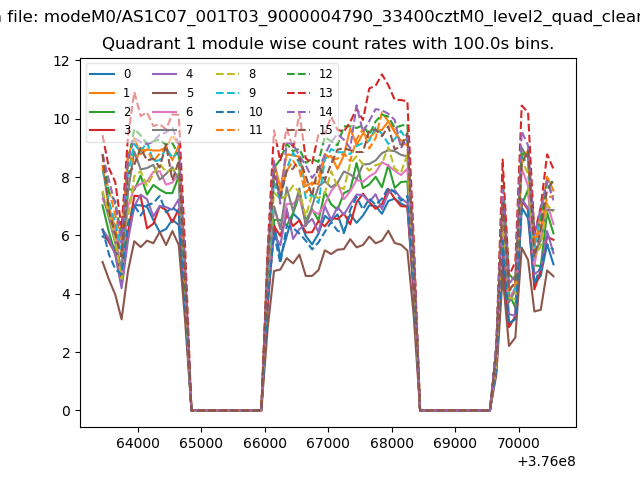 |
 |
| Module-wise count rates for Quadrant C Data is divided into 100 sec bins |
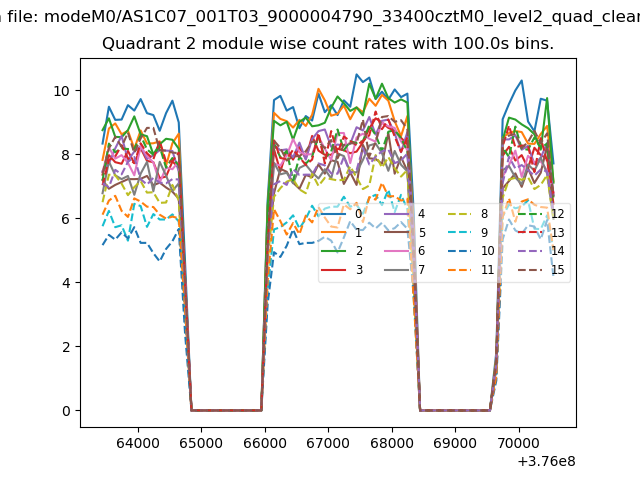 |
 |
| Module-wise count rates for Quadrant D Data is divided into 100 sec bins |
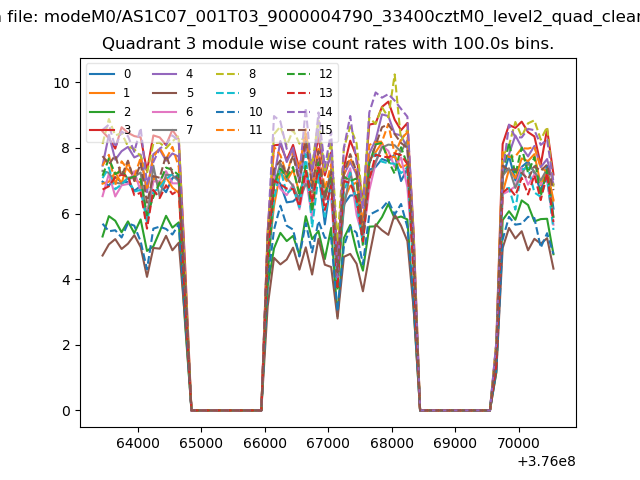 |
 |
| Parameter | Plot |
|---|---|
| CZT HV Monitor |  |
| D_VDD | 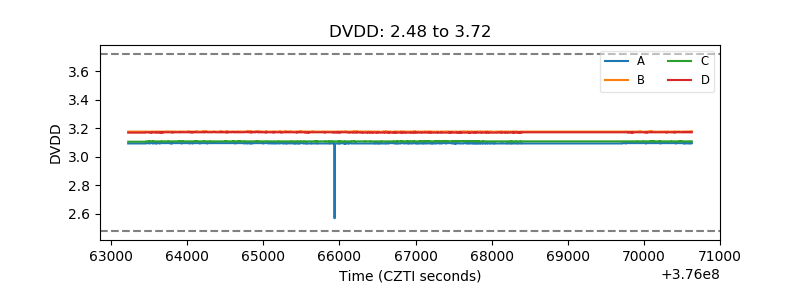 |
| Temperature 1 | 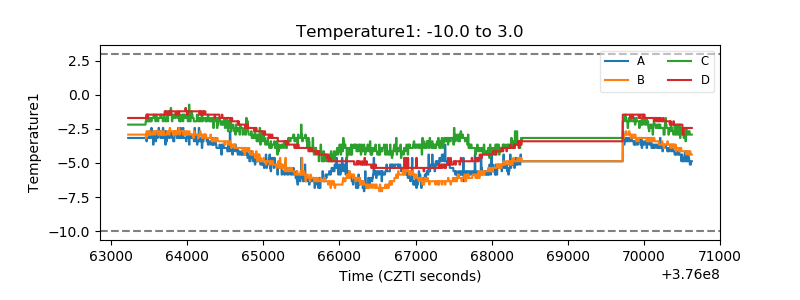 |
| Veto HV Monitor | 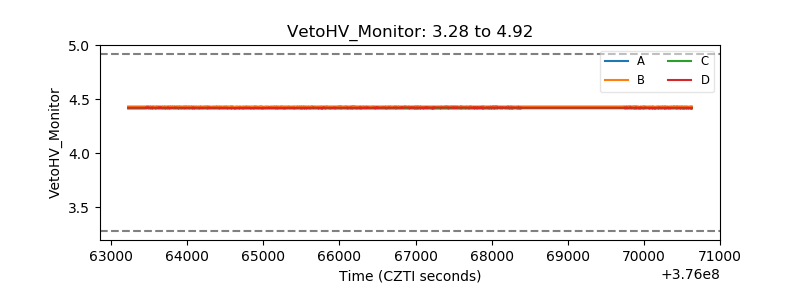 |
| Veto LLD | 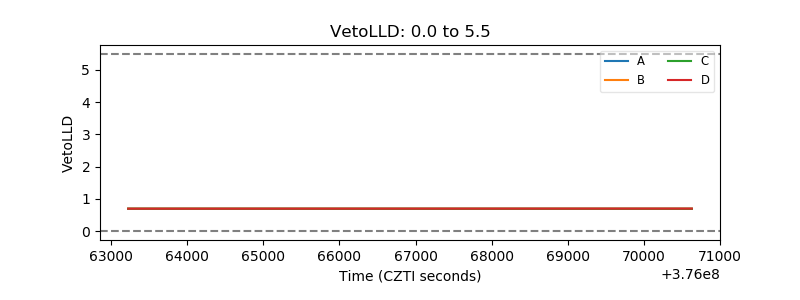 |
| Alpha Counter | 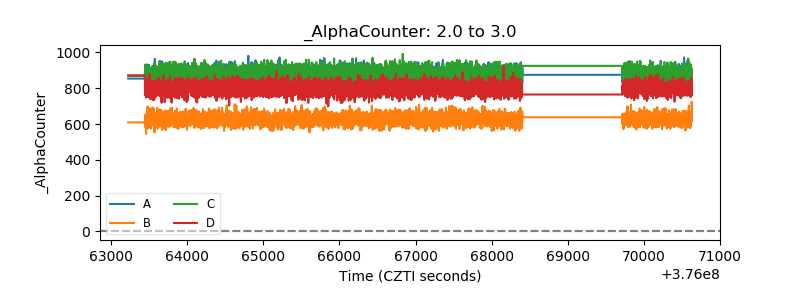 |
| _CPM_Rate | 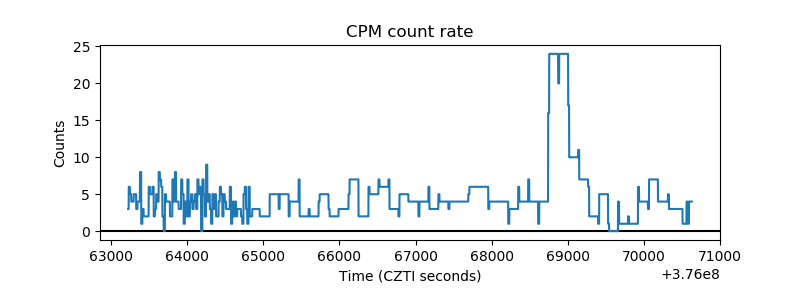 |
| CZT Counter | 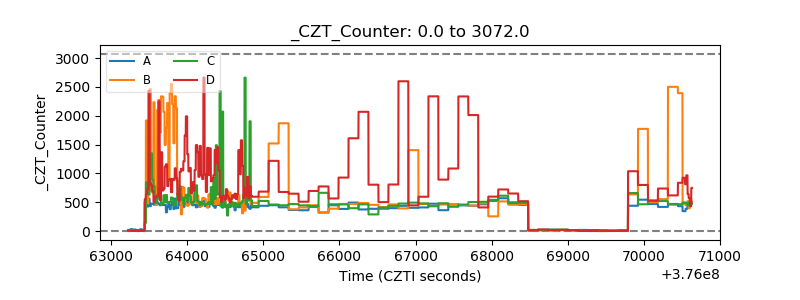 |
| +2.5 Volts monitor |  |
| +5 Volts monitor |  |
| _ROLL_ROT | 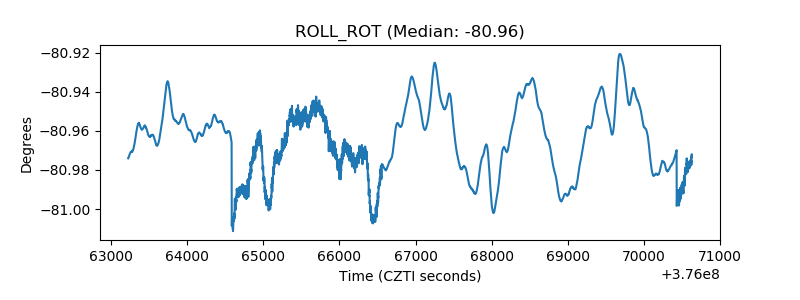 |
| _Roll_DEC | 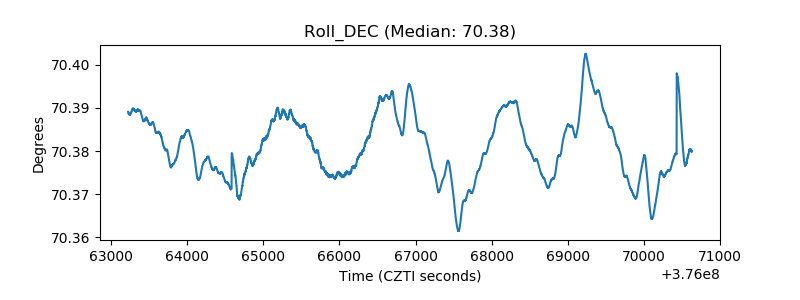 |
| _Roll_RA | 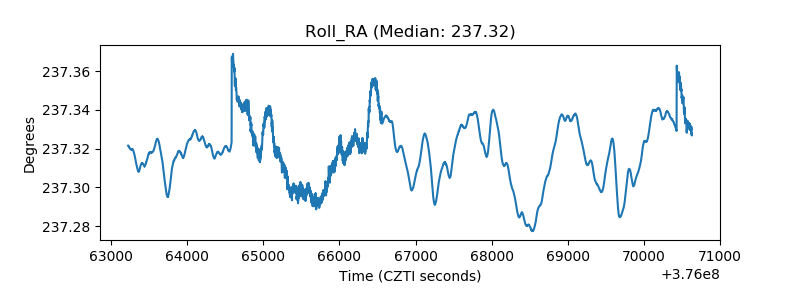 |
| Veto Counter | 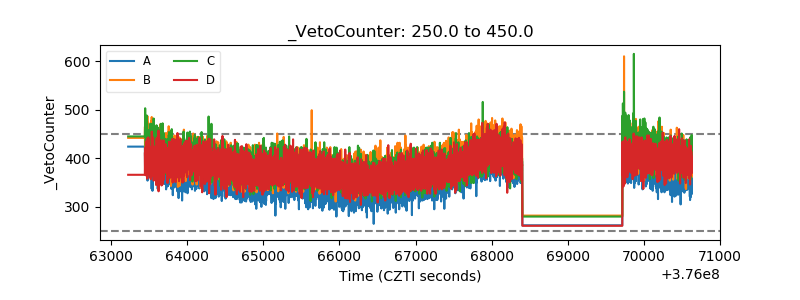 |