| Param | Original file | Final file |
|---|---|---|
| Filename | modeM0/AS1C07_001T03_9000004790_33403cztM0_level2.evt | modeM0/AS1C07_001T03_9000004790_33403cztM0_level2_quad_clean.evt |
| Size (bytes) | 627,932,160 | 92,557,440 |
| Size | 598.8 MB | 88.3 MB |
| Events in quadrant A | 3,179,100 | 602,513 |
| Events in quadrant B | 4,862,233 | 577,822 |
| Events in quadrant C | 4,106,279 | 591,326 |
| Events in quadrant D | 6,399,263 | 547,245 |
| Mode SS | |||
|---|---|---|---|
| Quadrant | BADHDUFLAG | Total packets | Discarded packets |
| A | 0 | 140 | 0 |
| B | 0 | 140 | 0 |
| C | 0 | 140 | 0 |
| D | 0 | 140 | 0 |
| Mode M0 | |||
|---|---|---|---|
| Quadrant | BADHDUFLAG | Total packets | Discarded packets |
| A | 0 | 14029 | 2 |
| B | 0 | 19020 | 1 |
| C | 0 | 16414 | 1 |
| D | 0 | 23928 | 1 |
| Mode M9 | |||
|---|---|---|---|
| Quadrant | BADHDUFLAG | Total packets | Discarded packets |
| A | 0 | 31 | 0 |
| B | 0 | 31 | 0 |
| C | 0 | 31 | 0 |
| D | 0 | 31 | 0 |
| Quadrant | Total seconds | Saturated seconds | Saturation percentage |
|---|---|---|---|
| A | 6956 | 6 | 0.086256% |
| B | 6956 | 544 | 7.820587% |
| C | 6956 | 240 | 3.450259% |
| D | 6956 | 466 | 6.699252% |
Noise dominated data is calculated using 1-second bins in cleaned event files. If a bin has >2000 counts, and if more than 50% of those come from <1% of pixels, then it is considered to be noise-dominated and hence unusable.
| Quadrant | # 1 sec bins | Bins with >0 counts | Bins with >2000 counts | High rate bins dominated by noise | Noise dominated (total time) | Noise dominated (detector-on time) | Marked lightcurve |
|---|---|---|---|---|---|---|---|
| A | 9942 | 6958 | 0 | 0 | 0.00% | 0.00% | 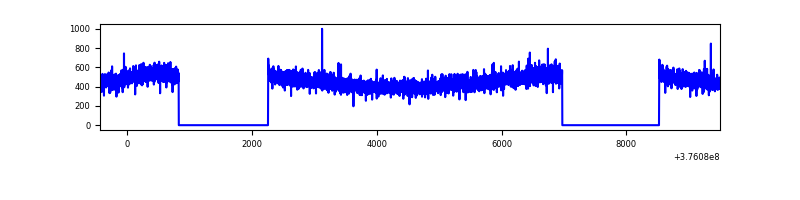 |
| B | 9942 | 6957 | 400 | 400 | 4.02% | 5.75% | 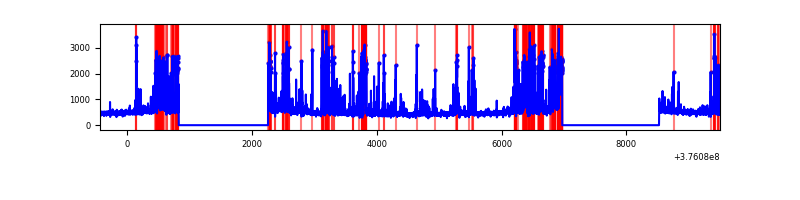 |
| C | 9942 | 6958 | 206 | 206 | 2.07% | 2.96% | 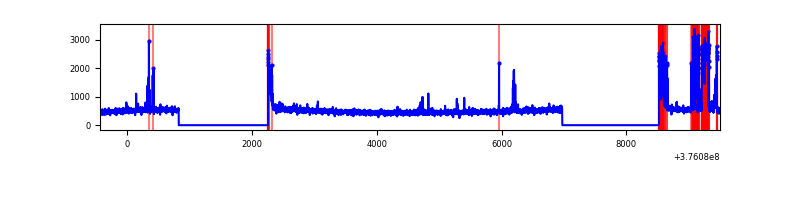 |
| D | 9942 | 6958 | 437 | 437 | 4.40% | 6.28% | 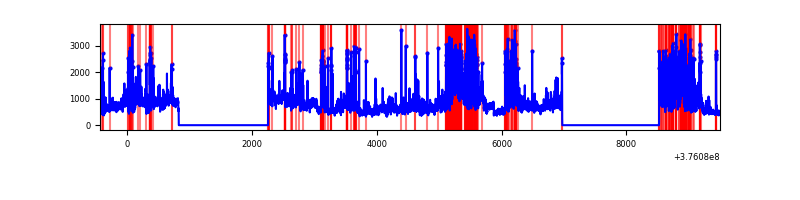 |
Top three noisy pixels from each quadrant. If the there are fewer than three noisy pixels in the level2.evt file, extra rows are filled as -1
| Pixel properties | Quadrant properties | ||||||
|---|---|---|---|---|---|---|---|
| Quadrant | DetID | PixID | Counts | Sigma | Mean | Median | Sigma |
| A | 13 | 254 | 10699 | 60.32 | 821 | 806 | 164.0 |
| A | 3 | 137 | 8315 | 45.78 | 821 | 806 | 164.0 |
| A | 0 | 226 | 6927 | 37.32 | 821 | 806 | 164.0 |
| B | 5 | 172 | 1443306 | 9552.71 | 789 | 768 | 151.0 |
| B | 0 | 219 | 91007 | 597.58 | 789 | 768 | 151.0 |
| B | 0 | 190 | 64106 | 419.43 | 789 | 768 | 151.0 |
| C | 4 | 254 | 446204 | 2465.76 | 780 | 783 | 180.6 |
| C | 15 | 214 | 295942 | 1633.94 | 780 | 783 | 180.6 |
| C | 0 | 10 | 135558 | 746.09 | 780 | 783 | 180.6 |
| D | 8 | 195 | 1293352 | 6811.7 | 775 | 751 | 189.8 |
| D | 2 | 250 | 971208 | 5114.07 | 775 | 751 | 189.8 |
| D | 12 | 218 | 398243 | 2094.69 | 775 | 751 | 189.8 |
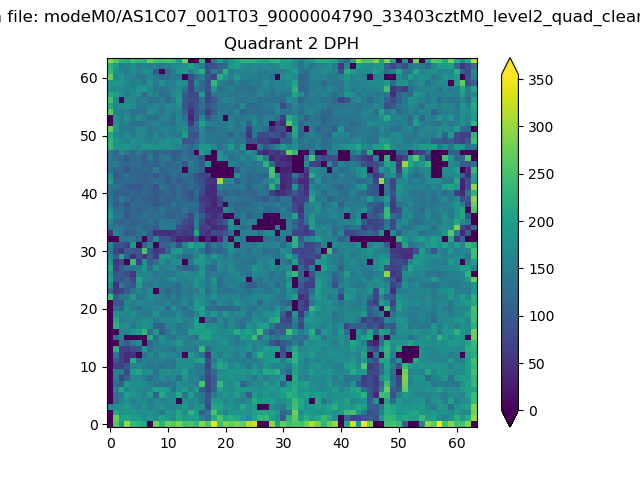
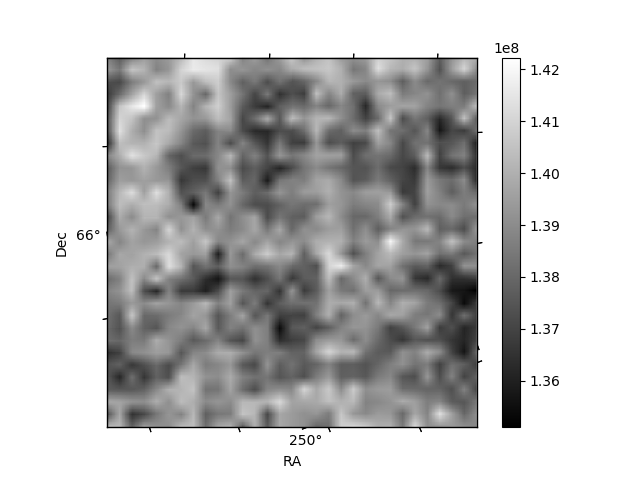
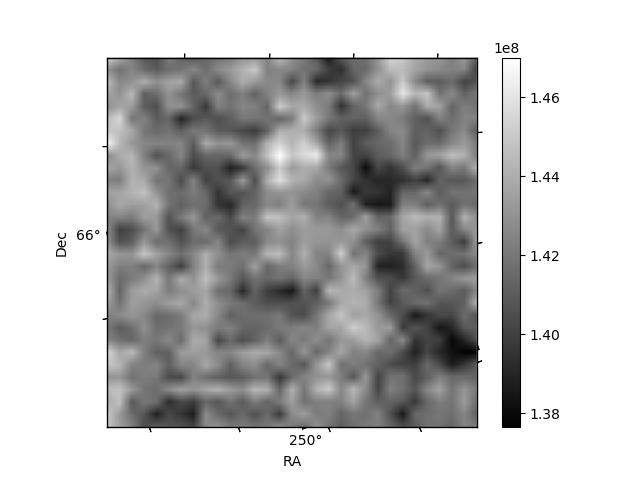
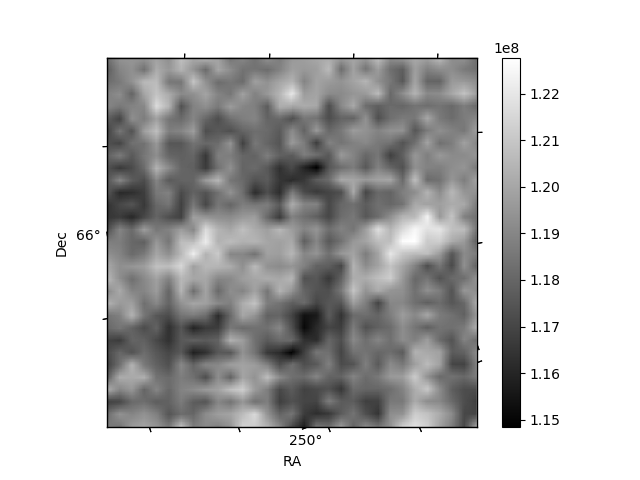
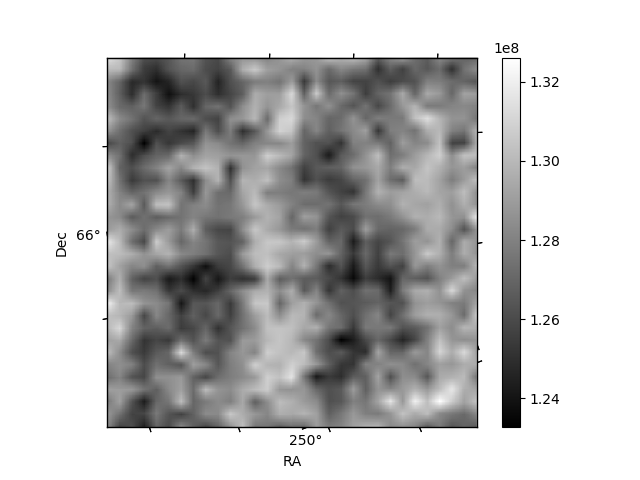
Histogram calculated using DETX and DETY for each event in the final _common_clean file
| Quadrant A | 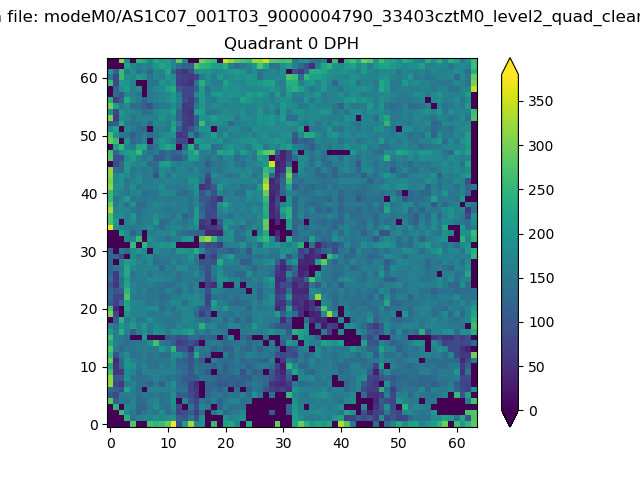 |
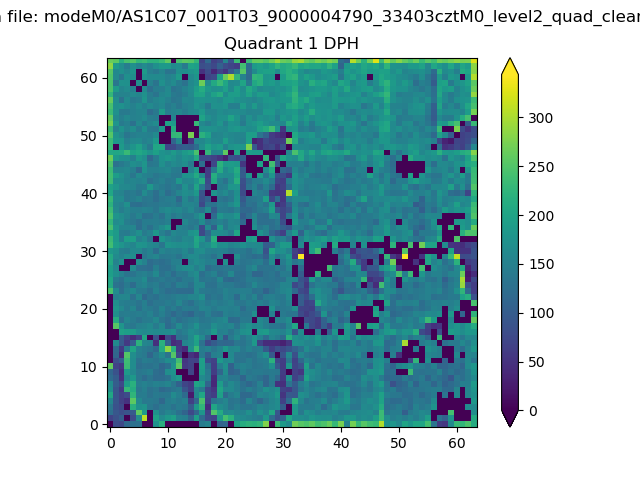 |
Quadrant B |
|---|---|---|---|
| Quadrant D | 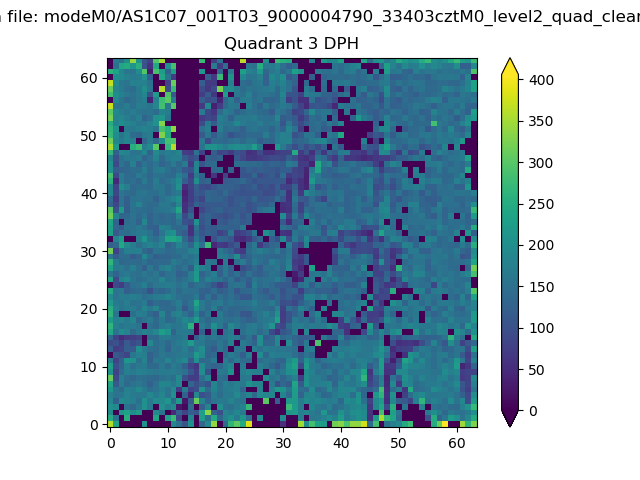 |
 |
Quadrant C |
| Plot type | Count rate plots | Images |
|---|---|---|
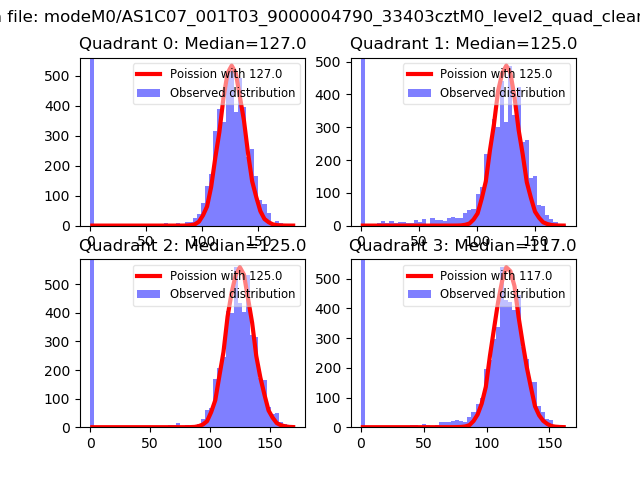
| Comparison with Poisson distribution Blue bars denote a histogram of data divided into 1 sec bins. Red curve is a Poisson curve with rate = median count rate of data. |
 |
 |
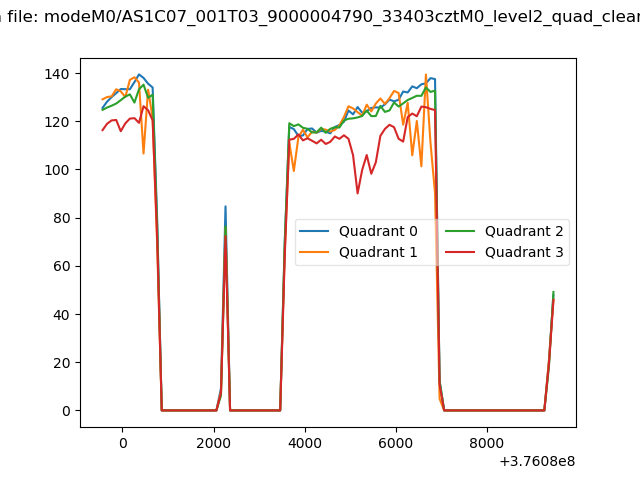
| Quadrant-wise count rates Data is divided into 100 sec bins |
 |
|
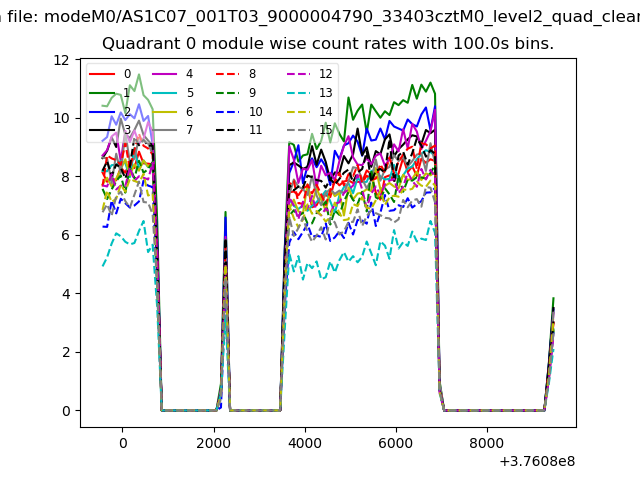
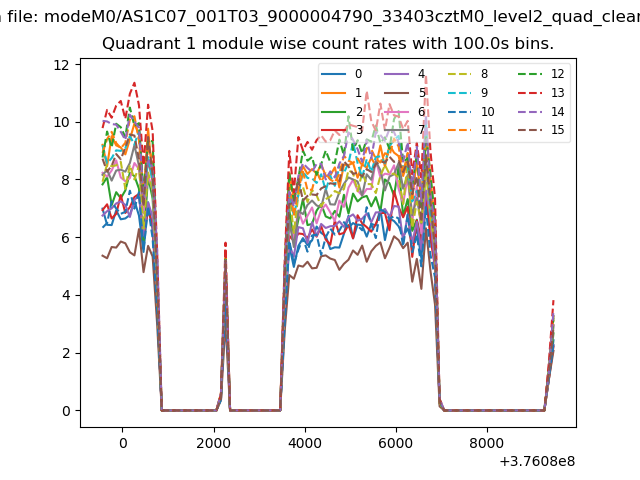
| Module-wise count rates for Quadrant A Data is divided into 100 sec bins |
 |
 |
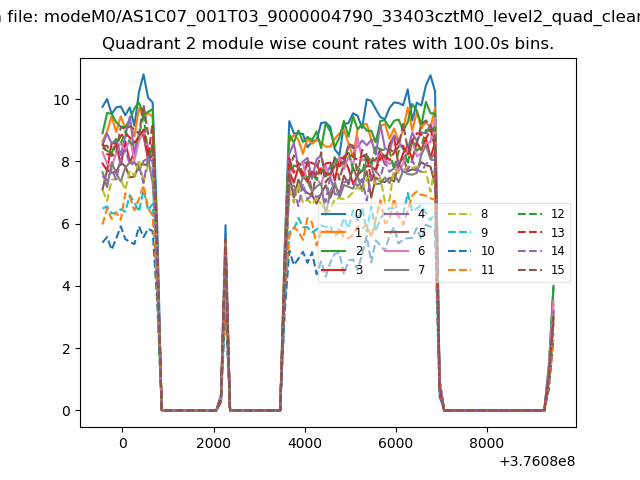
| Module-wise count rates for Quadrant B Data is divided into 100 sec bins |
 |
 |
| Module-wise count rates for Quadrant C Data is divided into 100 sec bins |
 |
 |
| Module-wise count rates for Quadrant D Data is divided into 100 sec bins |
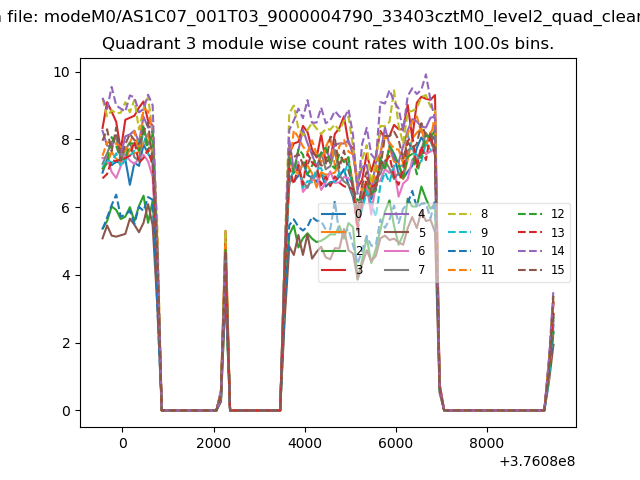 |
 |
| Parameter | Plot |
|---|---|
| CZT HV Monitor | 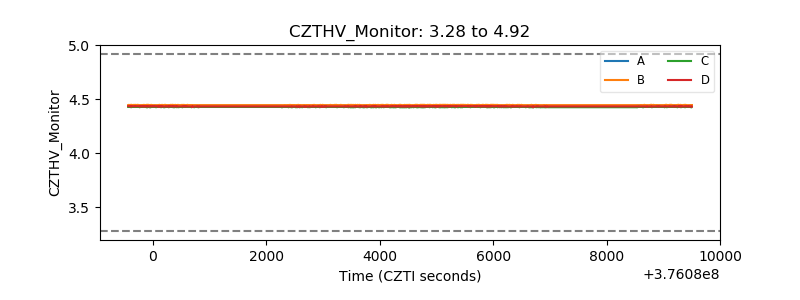 |
| D_VDD | 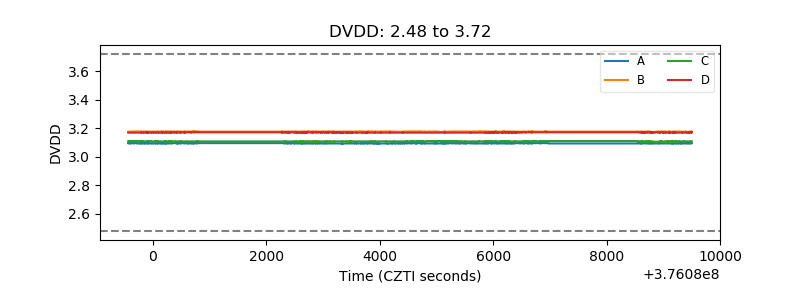 |
| Temperature 1 | 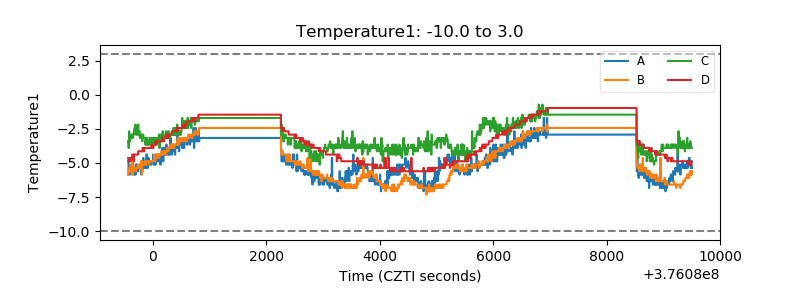 |
| Veto HV Monitor | 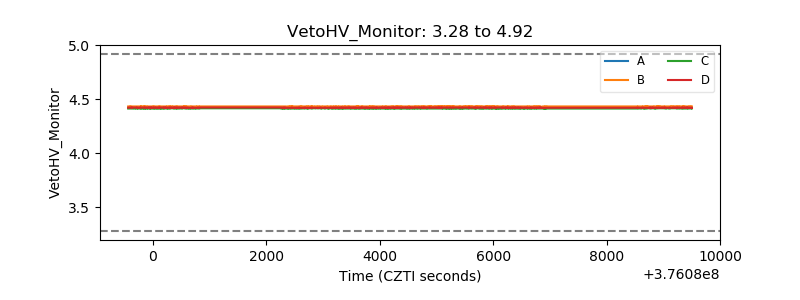 |
| Veto LLD |  |
| Alpha Counter | 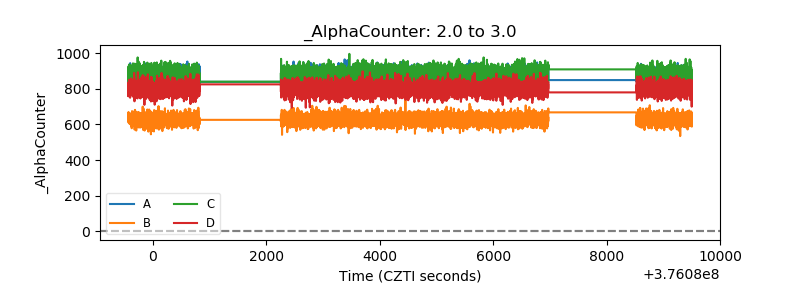 |
| _CPM_Rate | 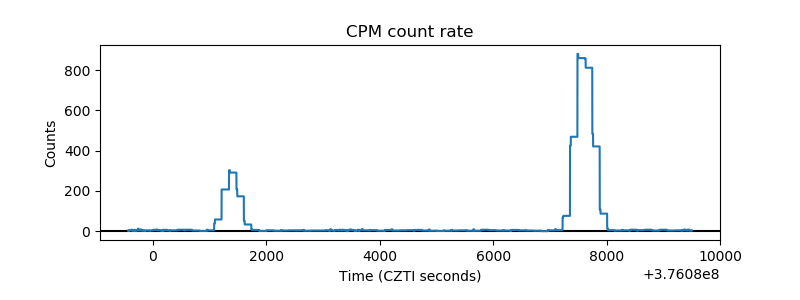 |
| CZT Counter | 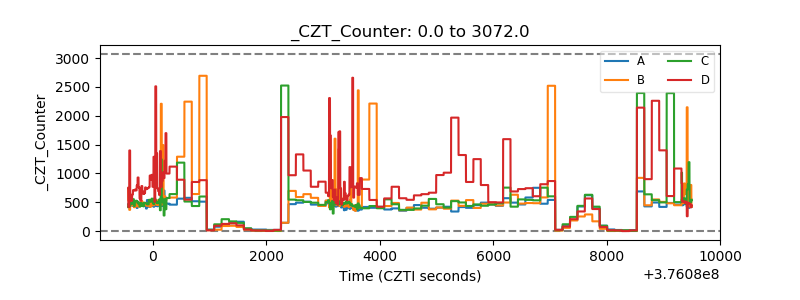 |
| +2.5 Volts monitor |  |
| +5 Volts monitor |  |
| _ROLL_ROT | 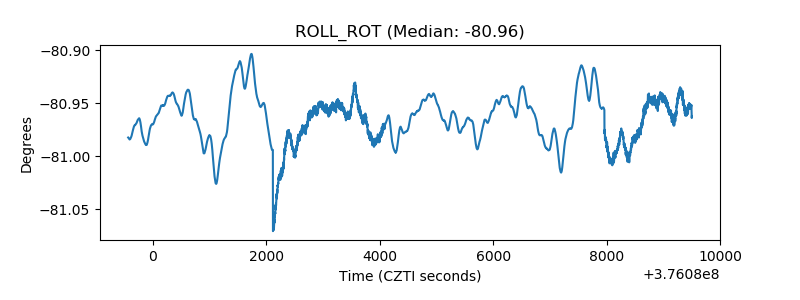 |
| _Roll_DEC | 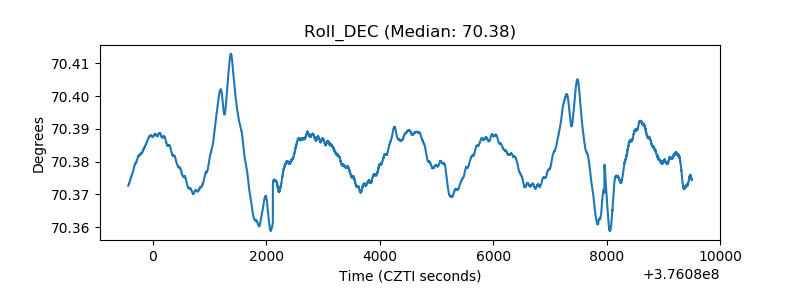 |
| _Roll_RA | 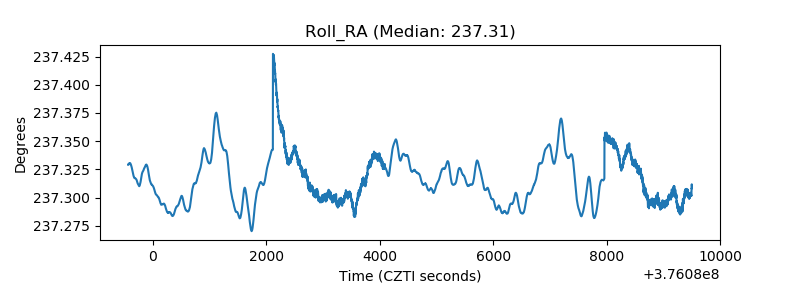 |
| Veto Counter | 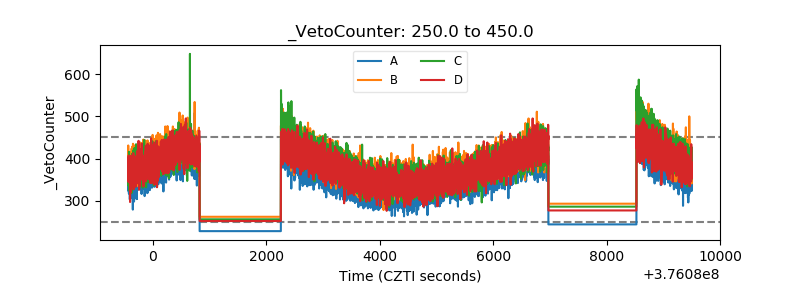 |