| Param | Original file | Final file |
|---|---|---|
| Filename | modeM0/AS1C07_001T03_9000004790_33407cztM0_level2.evt | modeM0/AS1C07_001T03_9000004790_33407cztM0_level2_quad_clean.evt |
| Size (bytes) | 437,506,560 | 104,175,360 |
| Size | 417.2 MB | 99.3 MB |
| Events in quadrant A | 2,447,780 | 721,092 |
| Events in quadrant B | 3,702,862 | 702,396 |
| Events in quadrant C | 2,806,968 | 703,047 |
| Events in quadrant D | 3,934,247 | 659,244 |
| Mode SS | |||
|---|---|---|---|
| Quadrant | BADHDUFLAG | Total packets | Discarded packets |
| A | 0 | 106 | 0 |
| B | 0 | 106 | 0 |
| C | 0 | 106 | 0 |
| D | 0 | 106 | 0 |
| Mode M0 | |||
|---|---|---|---|
| Quadrant | BADHDUFLAG | Total packets | Discarded packets |
| A | 0 | 10636 | 3 |
| B | 0 | 14436 | 2 |
| C | 0 | 11423 | 2 |
| D | 0 | 15307 | 2 |
| Mode M9 | |||
|---|---|---|---|
| Quadrant | BADHDUFLAG | Total packets | Discarded packets |
| A | 0 | 28 | 0 |
| B | 0 | 28 | 0 |
| C | 0 | 28 | 0 |
| D | 0 | 29 | 0 |
| Quadrant | Total seconds | Saturated seconds | Saturation percentage |
|---|---|---|---|
| A | 5278 | 4 | 0.075786% |
| B | 5278 | 392 | 7.427056% |
| C | 5278 | 59 | 1.117848% |
| D | 5278 | 86 | 1.629405% |
Noise dominated data is calculated using 1-second bins in cleaned event files. If a bin has >2000 counts, and if more than 50% of those come from <1% of pixels, then it is considered to be noise-dominated and hence unusable.
| Quadrant | # 1 sec bins | Bins with >0 counts | Bins with >2000 counts | High rate bins dominated by noise | Noise dominated (total time) | Noise dominated (detector-on time) | Marked lightcurve |
|---|---|---|---|---|---|---|---|
| A | 7222 | 5279 | 0 | 0 | 0.00% | 0.00% | 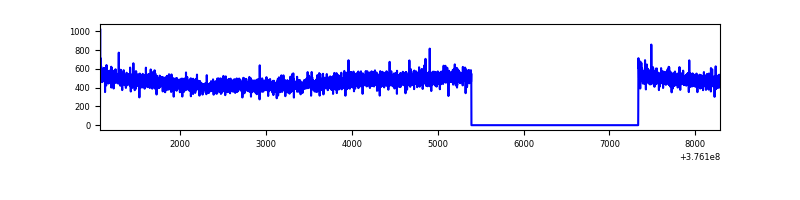 |
| B | 7222 | 5279 | 328 | 328 | 4.54% | 6.21% | 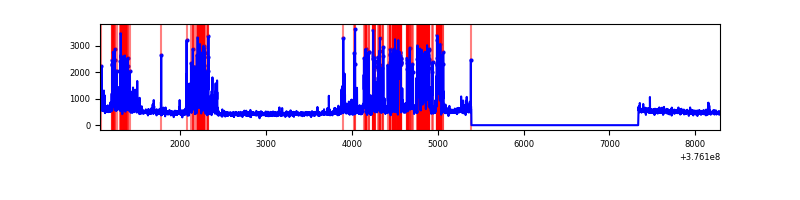 |
| C | 7222 | 5279 | 45 | 45 | 0.62% | 0.85% | 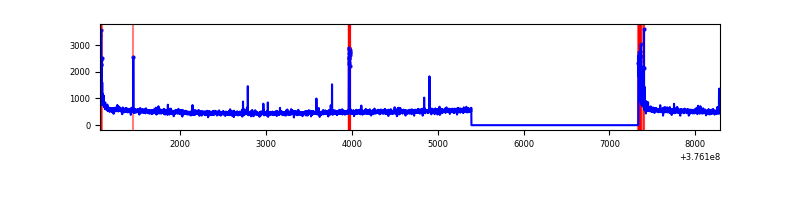 |
| D | 7222 | 5279 | 71 | 71 | 0.98% | 1.34% | 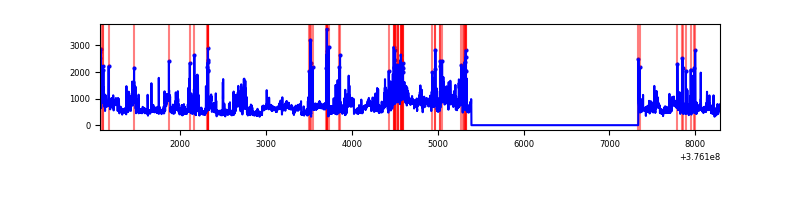 |
Top three noisy pixels from each quadrant. If the there are fewer than three noisy pixels in the level2.evt file, extra rows are filled as -1
| Pixel properties | Quadrant properties | ||||||
|---|---|---|---|---|---|---|---|
| Quadrant | DetID | PixID | Counts | Sigma | Mean | Median | Sigma |
| A | 13 | 254 | 9352 | 69.85 | 632 | 622 | 125.0 |
| A | 3 | 137 | 5813 | 41.53 | 632 | 622 | 125.0 |
| A | 0 | 226 | 5433 | 38.49 | 632 | 622 | 125.0 |
| B | 5 | 172 | 1157576 | 10159.07 | 608 | 593 | 113.9 |
| B | 5 | 255 | 47575 | 412.53 | 608 | 593 | 113.9 |
| B | 0 | 245 | 28939 | 248.9 | 608 | 593 | 113.9 |
| C | 15 | 214 | 230967 | 1661.13 | 604 | 610 | 138.7 |
| C | 0 | 10 | 135549 | 973.06 | 604 | 610 | 138.7 |
| C | 14 | 254 | 68190 | 487.33 | 604 | 610 | 138.7 |
| D | 8 | 195 | 885957 | 6097.68 | 597 | 581 | 145.2 |
| D | 14 | 173 | 214899 | 1476.03 | 597 | 581 | 145.2 |
| D | 13 | 249 | 147969 | 1015.08 | 597 | 581 | 145.2 |
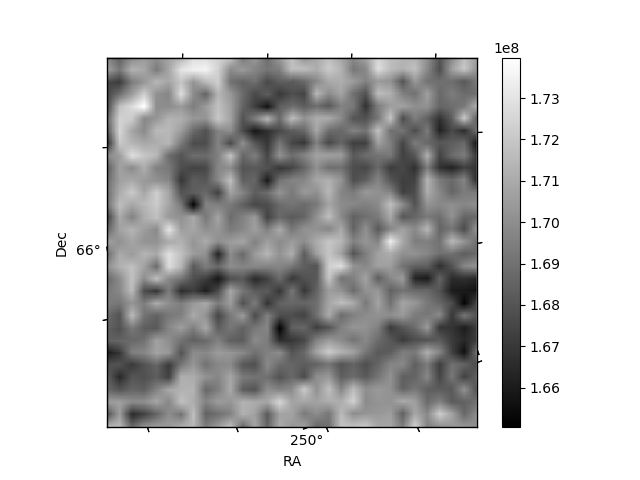
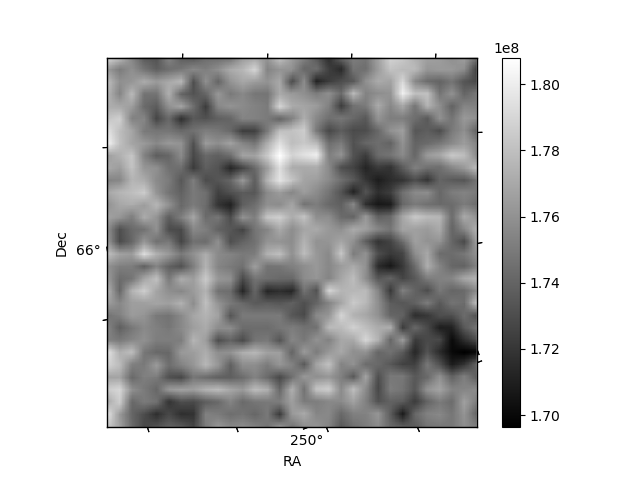
Histogram calculated using DETX and DETY for each event in the final _common_clean file
| Quadrant A |  |
 |
Quadrant B |
|---|---|---|---|
| Quadrant D |  |
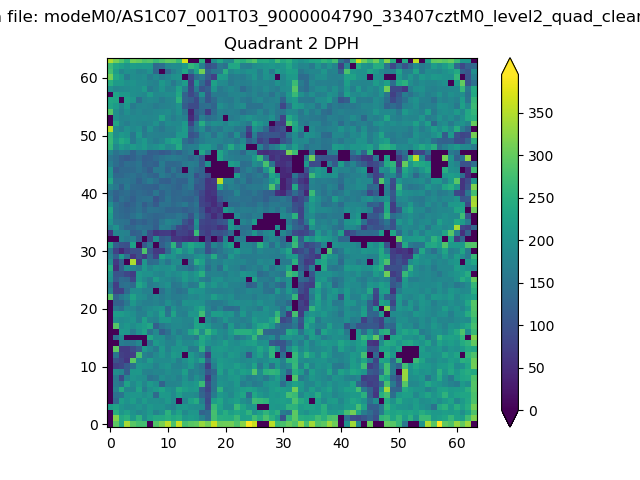 |
Quadrant C |
| Plot type | Count rate plots | Images |
|---|---|---|
| Comparison with Poisson distribution Blue bars denote a histogram of data divided into 1 sec bins. Red curve is a Poisson curve with rate = median count rate of data. |
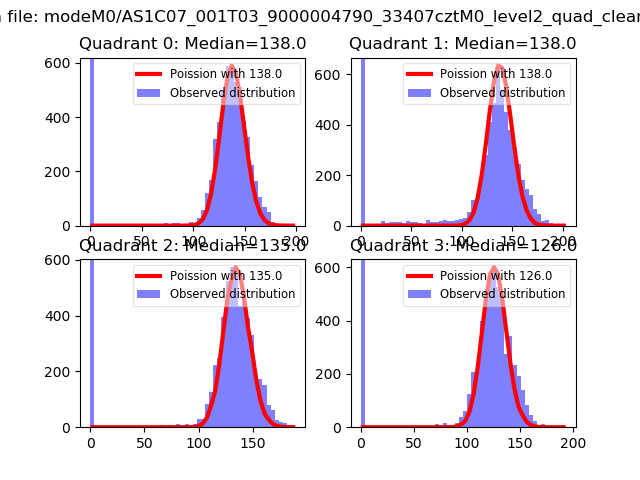 |
 |
| Quadrant-wise count rates Data is divided into 100 sec bins |
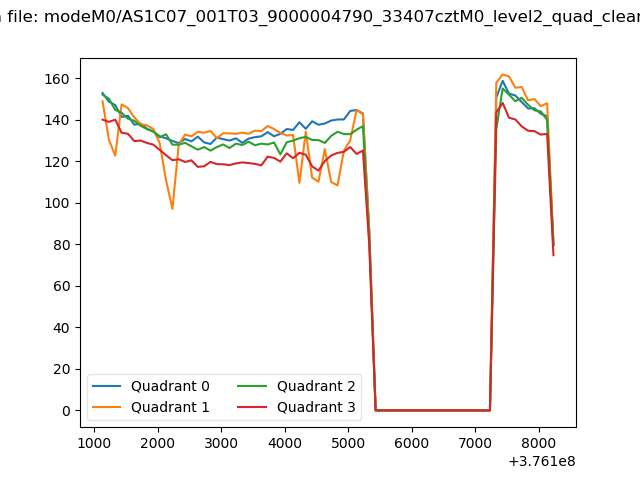 |
|
| Module-wise count rates for Quadrant A Data is divided into 100 sec bins |
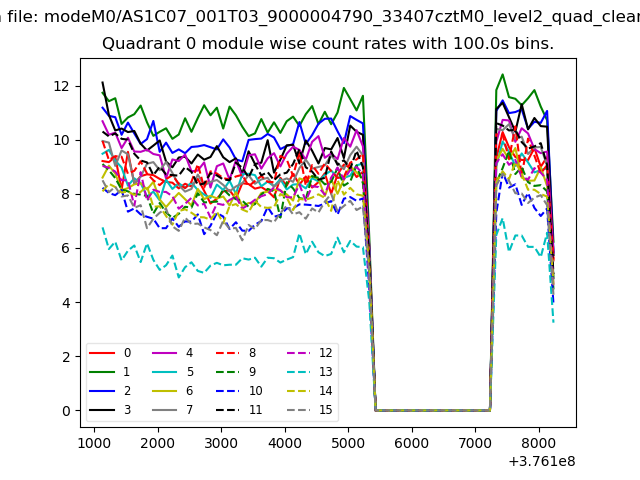 |
 |
| Module-wise count rates for Quadrant B Data is divided into 100 sec bins |
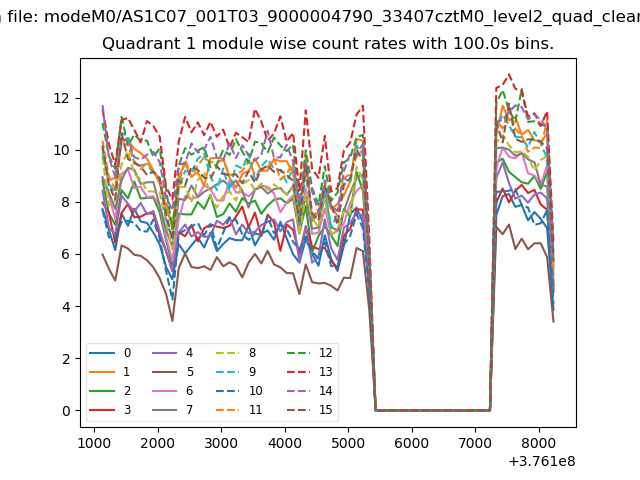 |
 |
| Module-wise count rates for Quadrant C Data is divided into 100 sec bins |
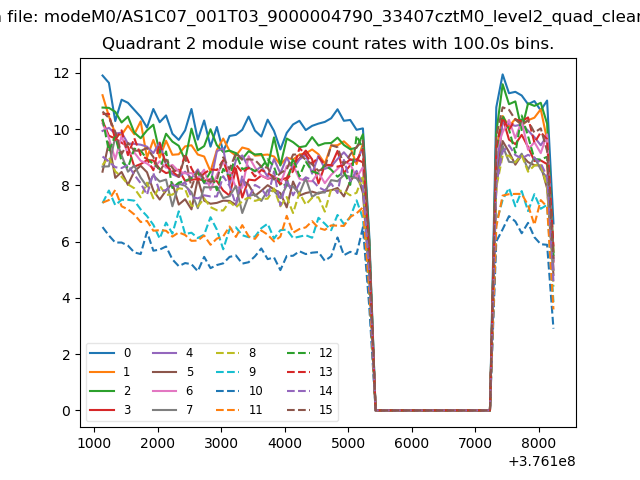 |
 |
| Module-wise count rates for Quadrant D Data is divided into 100 sec bins |
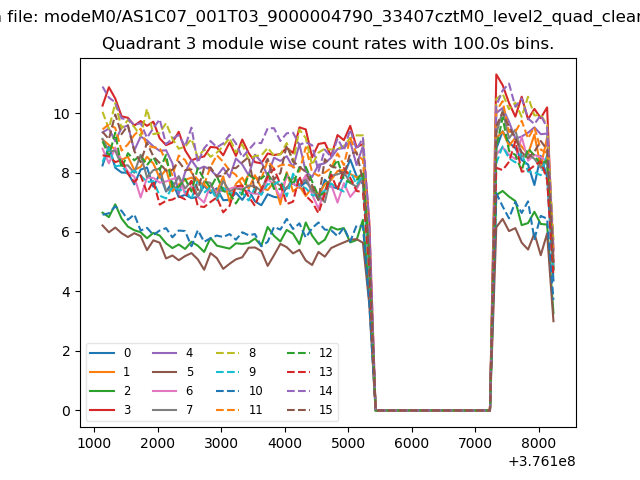 |
 |
| Parameter | Plot |
|---|---|
| CZT HV Monitor | 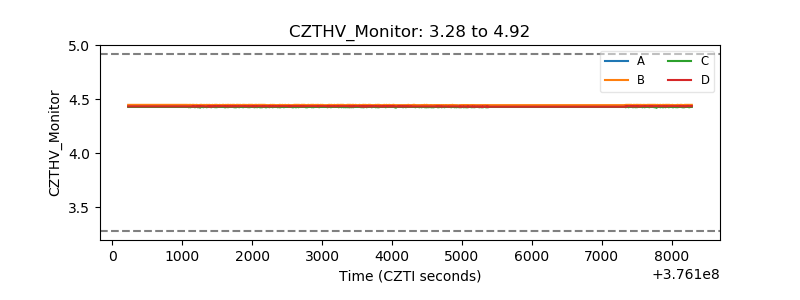 |
| D_VDD | 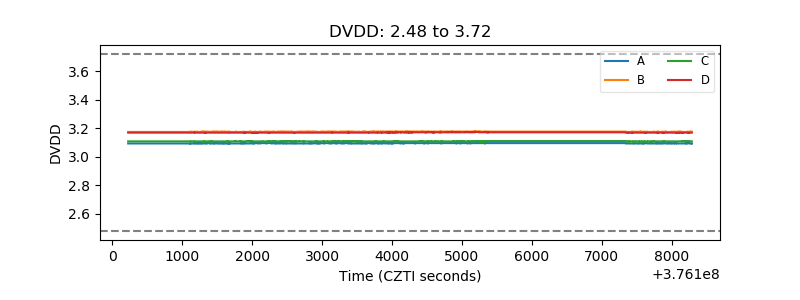 |
| Temperature 1 | 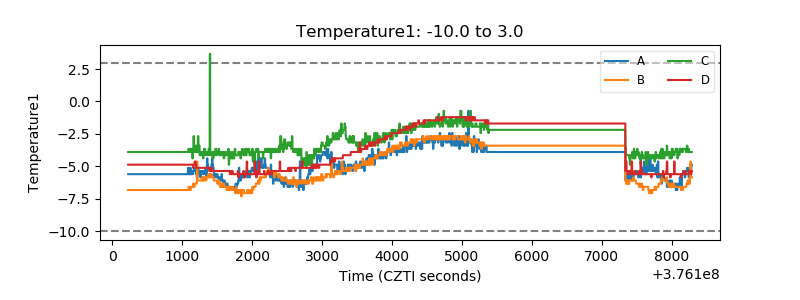 |
| Veto HV Monitor | 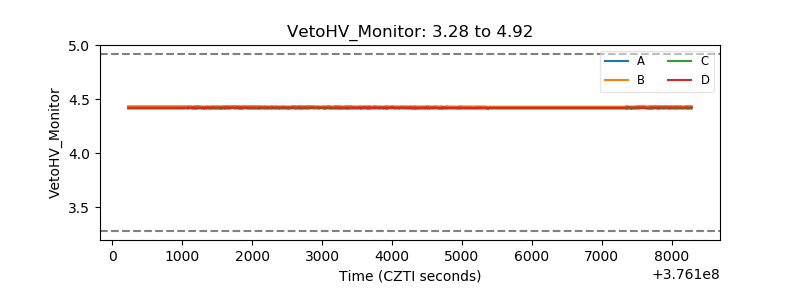 |
| Veto LLD | 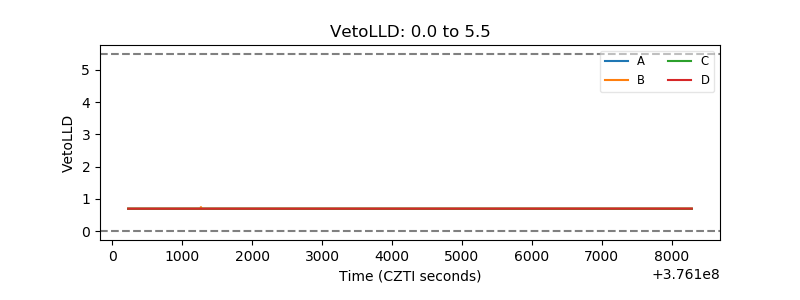 |
| Alpha Counter | 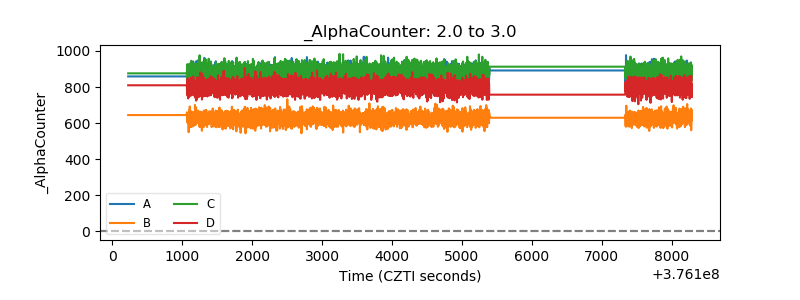 |
| _CPM_Rate | 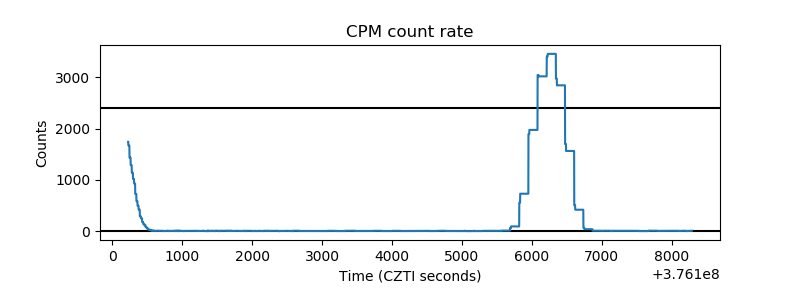 |
| CZT Counter | 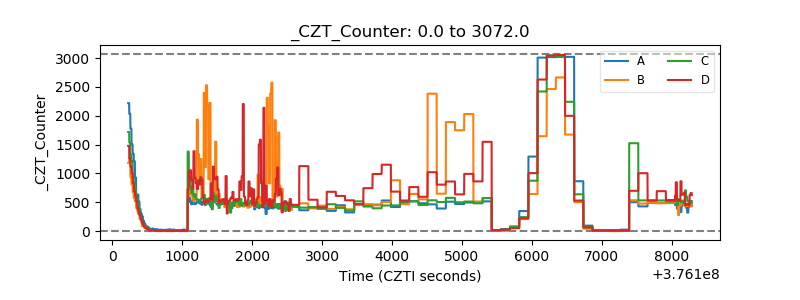 |
| +2.5 Volts monitor |  |
| +5 Volts monitor |  |
| _ROLL_ROT | 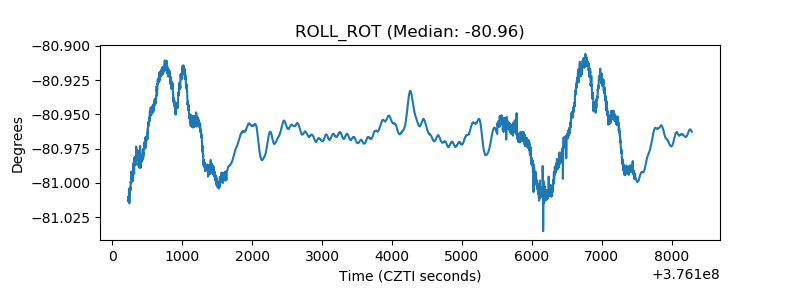 |
| _Roll_DEC | 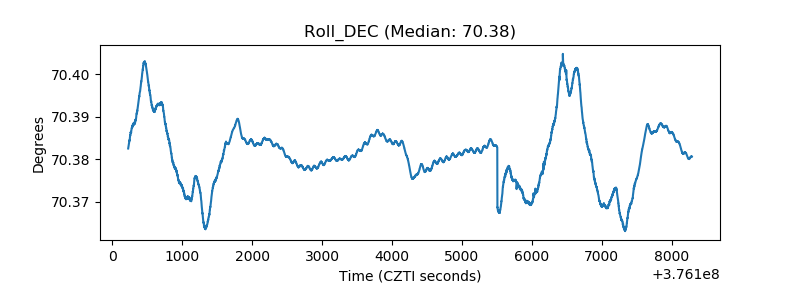 |
| _Roll_RA | 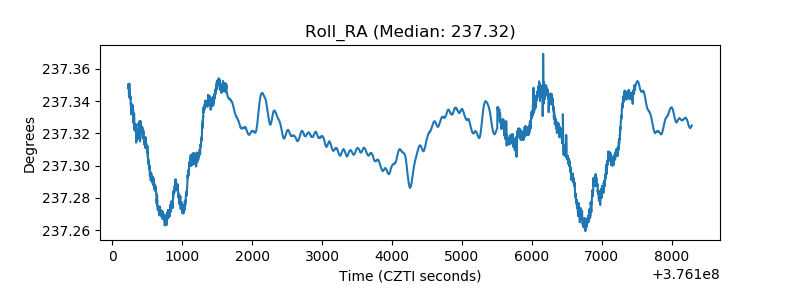 |
| Veto Counter | 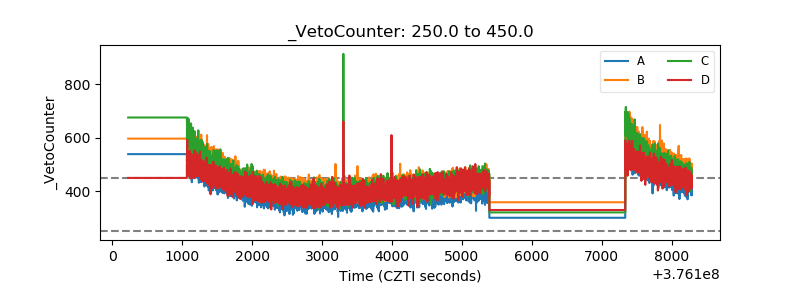 |