| Param | Original file | Final file |
|---|---|---|
| Filename | modeM0/AS1C07_001T03_9000004790_33410cztM0_level2.evt | modeM0/AS1C07_001T03_9000004790_33410cztM0_level2_quad_clean.evt |
| Size (bytes) | 415,840,320 | 85,210,560 |
| Size | 396.6 MB | 81.3 MB |
| Events in quadrant A | 2,310,955 | 589,914 |
| Events in quadrant B | 3,557,043 | 573,319 |
| Events in quadrant C | 2,593,552 | 551,426 |
| Events in quadrant D | 3,798,124 | 520,738 |
| Mode SS | |||
|---|---|---|---|
| Quadrant | BADHDUFLAG | Total packets | Discarded packets |
| A | 0 | 100 | 0 |
| B | 0 | 100 | 0 |
| C | 0 | 100 | 0 |
| D | 0 | 100 | 0 |
| Mode M0 | |||
|---|---|---|---|
| Quadrant | BADHDUFLAG | Total packets | Discarded packets |
| A | 0 | 9882 | 3 |
| B | 0 | 13750 | 2 |
| C | 0 | 10553 | 2 |
| D | 0 | 14562 | 2 |
| Mode M9 | |||
|---|---|---|---|
| Quadrant | BADHDUFLAG | Total packets | Discarded packets |
| A | 0 | 23 | 0 |
| B | 0 | 23 | 0 |
| C | 0 | 23 | 0 |
| D | 0 | 24 | 0 |
| Quadrant | Total seconds | Saturated seconds | Saturation percentage |
|---|---|---|---|
| A | 4920 | 4 | 0.081301% |
| B | 4920 | 322 | 6.544715% |
| C | 4920 | 35 | 0.711382% |
| D | 4920 | 108 | 2.195122% |
Noise dominated data is calculated using 1-second bins in cleaned event files. If a bin has >2000 counts, and if more than 50% of those come from <1% of pixels, then it is considered to be noise-dominated and hence unusable.
| Quadrant | # 1 sec bins | Bins with >0 counts | Bins with >2000 counts | High rate bins dominated by noise | Noise dominated (total time) | Noise dominated (detector-on time) | Marked lightcurve |
|---|---|---|---|---|---|---|---|
| A | 7072 | 4921 | 0 | 0 | 0.00% | 0.00% | 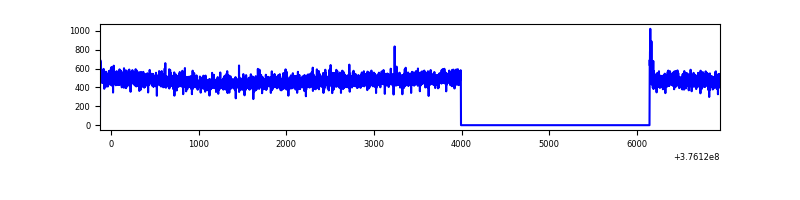 |
| B | 7072 | 4921 | 261 | 261 | 3.69% | 5.30% | 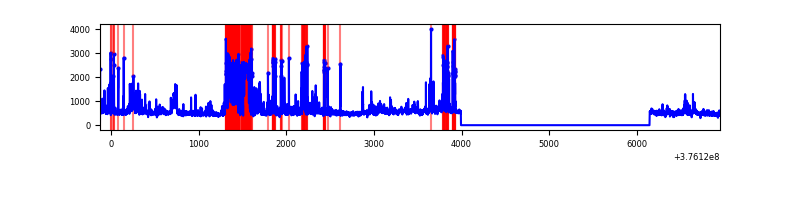 |
| C | 7072 | 4921 | 30 | 30 | 0.42% | 0.61% | 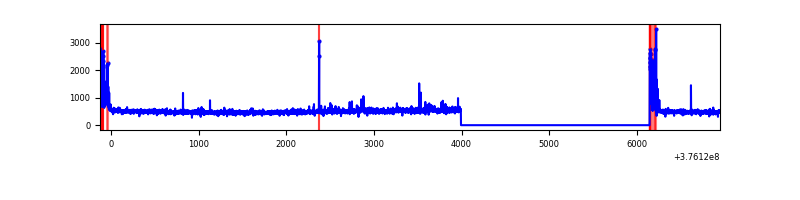 |
| D | 7072 | 4921 | 102 | 102 | 1.44% | 2.07% | 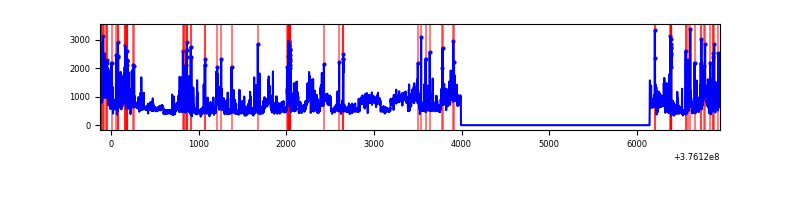 |
Top three noisy pixels from each quadrant. If the there are fewer than three noisy pixels in the level2.evt file, extra rows are filled as -1
| Pixel properties | Quadrant properties | ||||||
|---|---|---|---|---|---|---|---|
| Quadrant | DetID | PixID | Counts | Sigma | Mean | Median | Sigma |
| A | 13 | 6 | 10429 | 84.42 | 594 | 586 | 116.6 |
| A | 13 | 254 | 8570 | 68.48 | 594 | 586 | 116.6 |
| A | 3 | 137 | 5429 | 41.54 | 594 | 586 | 116.6 |
| B | 5 | 172 | 831169 | 7664.31 | 571 | 556 | 108.4 |
| B | 5 | 255 | 178194 | 1639.12 | 571 | 556 | 108.4 |
| B | 0 | 213 | 108988 | 1000.53 | 571 | 556 | 108.4 |
| C | 15 | 214 | 215153 | 1691.11 | 556 | 560 | 126.9 |
| C | 0 | 10 | 158490 | 1244.58 | 556 | 560 | 126.9 |
| C | 14 | 254 | 32643 | 252.83 | 556 | 560 | 126.9 |
| D | 8 | 195 | 738262 | 5530.64 | 558 | 543 | 133.4 |
| D | 2 | 250 | 253064 | 1893.14 | 558 | 543 | 133.4 |
| D | 2 | 249 | 162272 | 1212.47 | 558 | 543 | 133.4 |
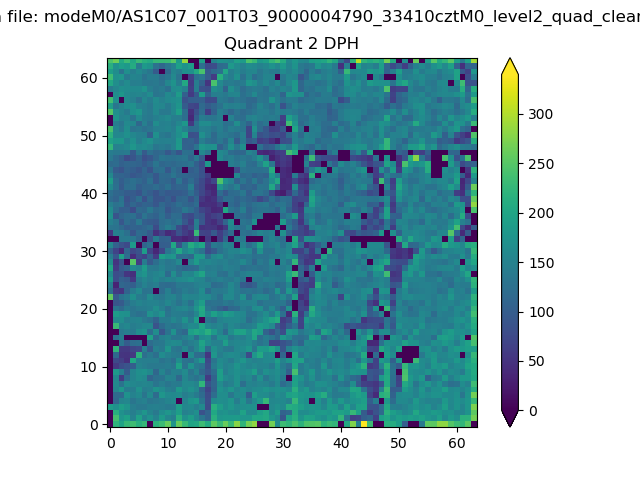
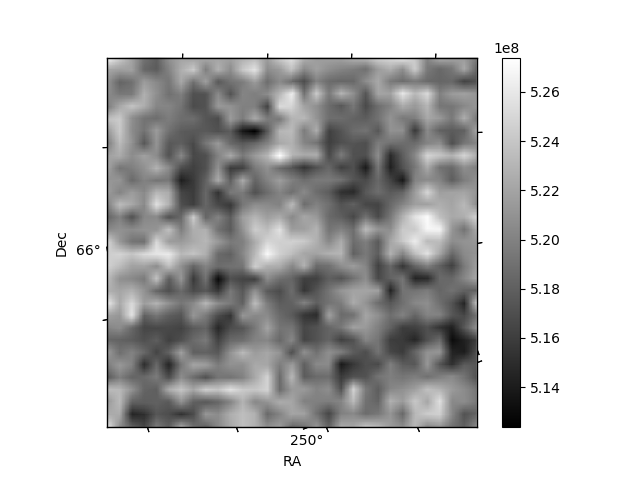
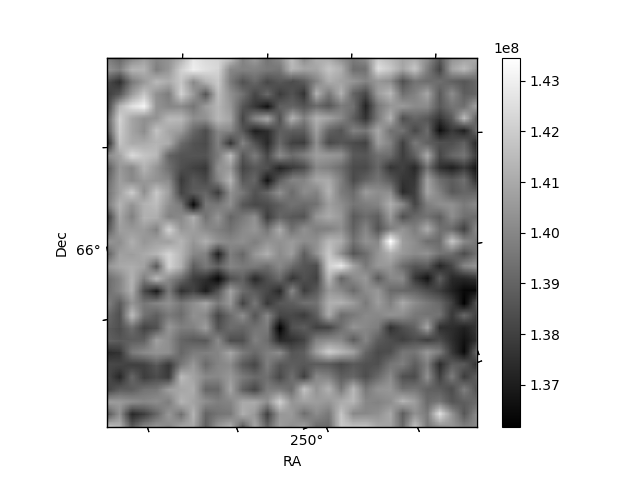
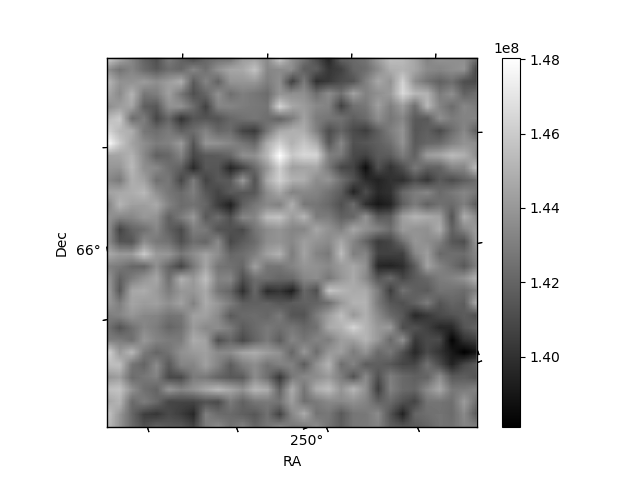
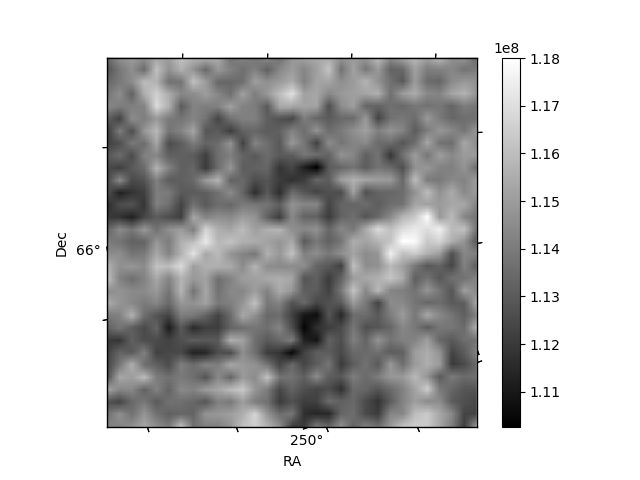
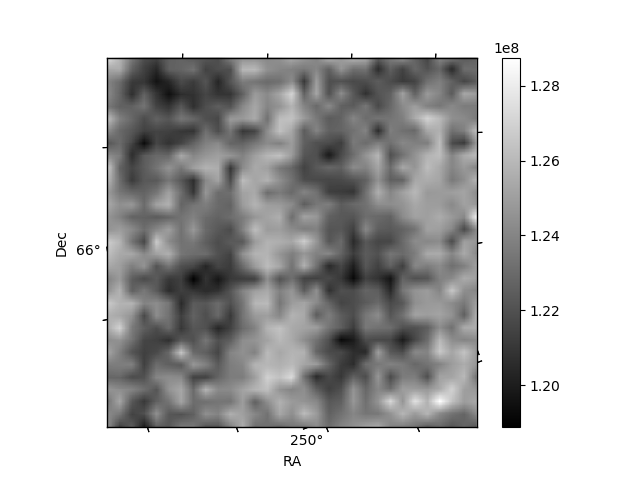
Histogram calculated using DETX and DETY for each event in the final _common_clean file
| Quadrant A | 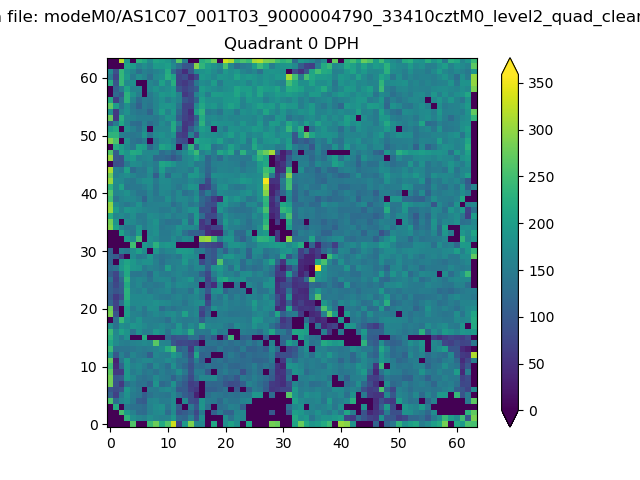 |
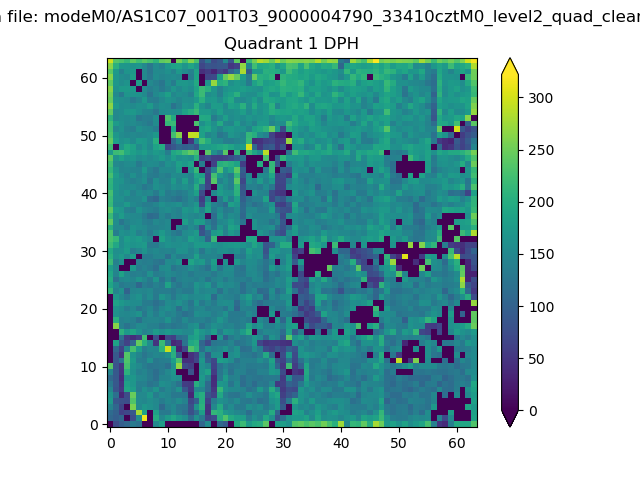 |
Quadrant B |
|---|---|---|---|
| Quadrant D | 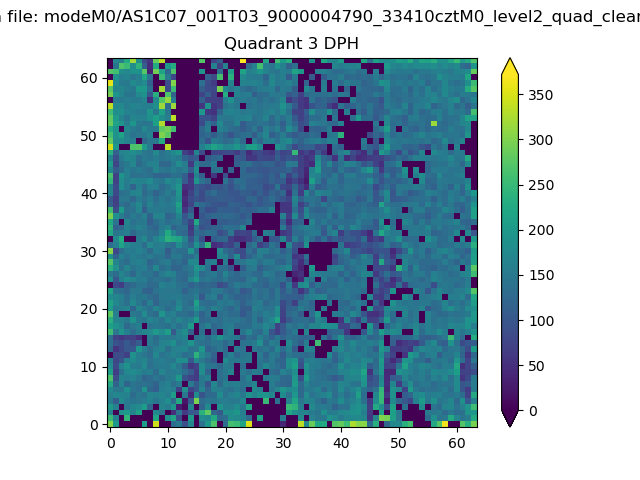 |
 |
Quadrant C |
| Plot type | Count rate plots | Images |
|---|---|---|
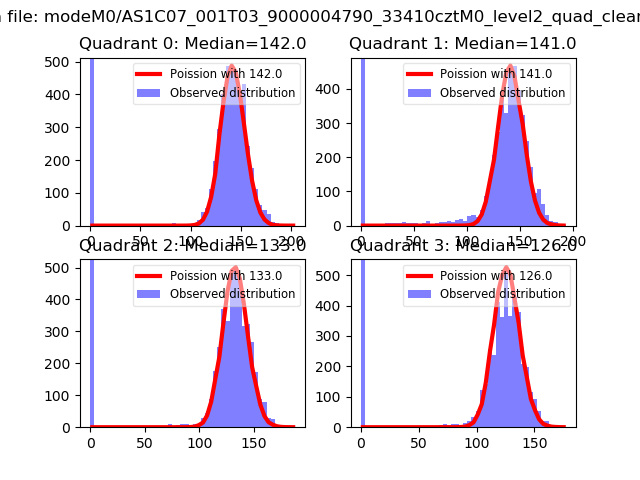
| Comparison with Poisson distribution Blue bars denote a histogram of data divided into 1 sec bins. Red curve is a Poisson curve with rate = median count rate of data. |
 |
 |
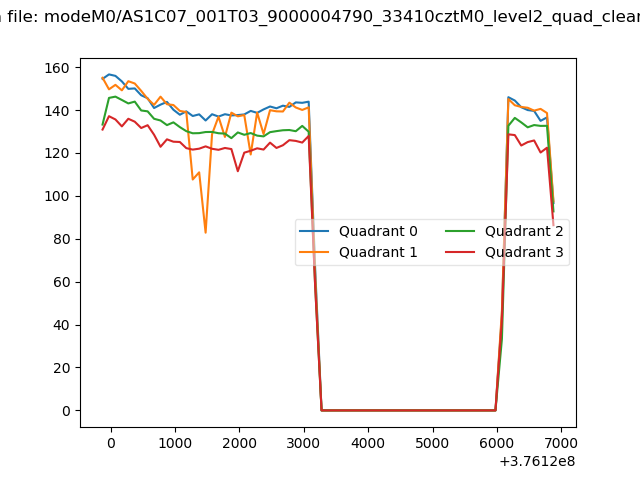
| Quadrant-wise count rates Data is divided into 100 sec bins |
 |
|
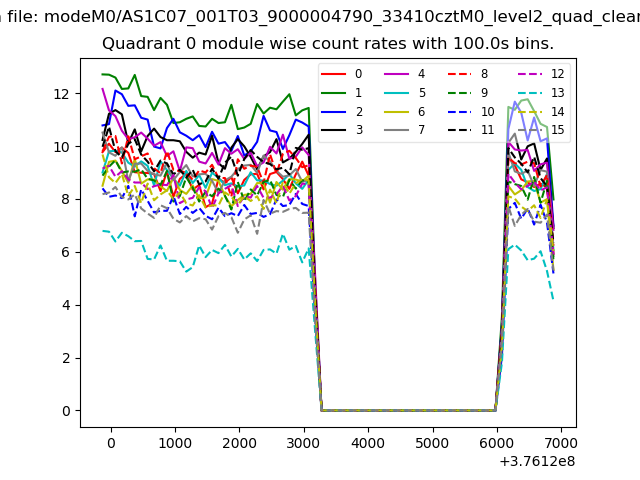
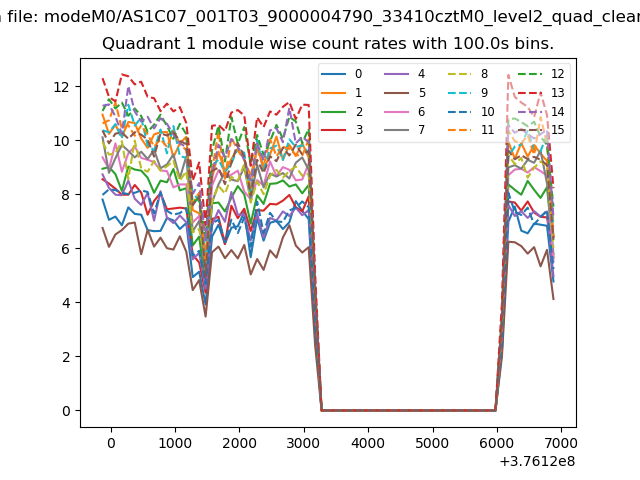
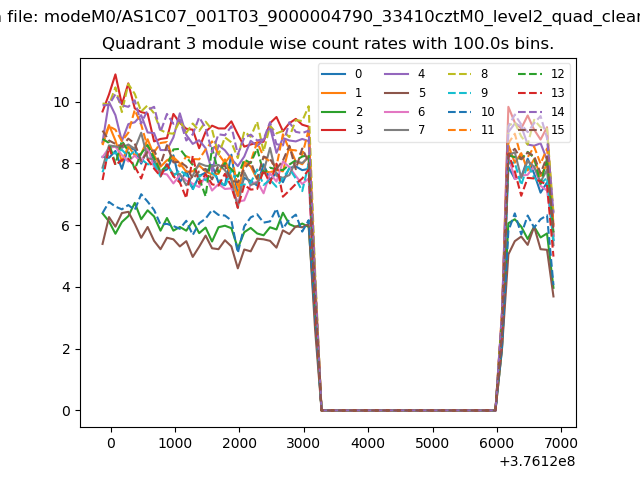
| Module-wise count rates for Quadrant A Data is divided into 100 sec bins |
 |
 |
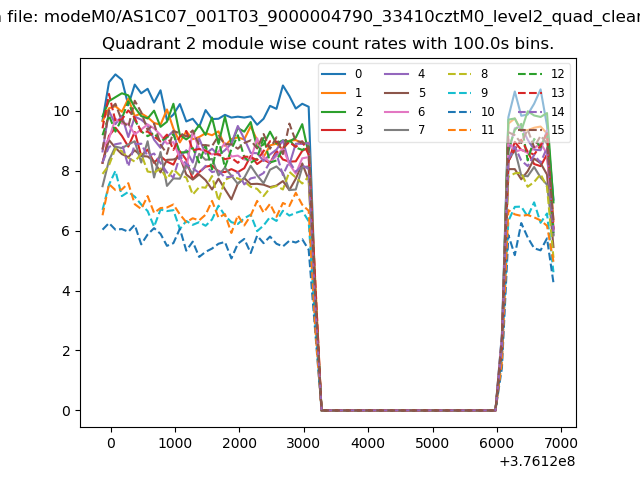
| Module-wise count rates for Quadrant B Data is divided into 100 sec bins |
 |
 |
| Module-wise count rates for Quadrant C Data is divided into 100 sec bins |
 |
 |
| Module-wise count rates for Quadrant D Data is divided into 100 sec bins |
 |
 |
| Parameter | Plot |
|---|---|
| CZT HV Monitor | 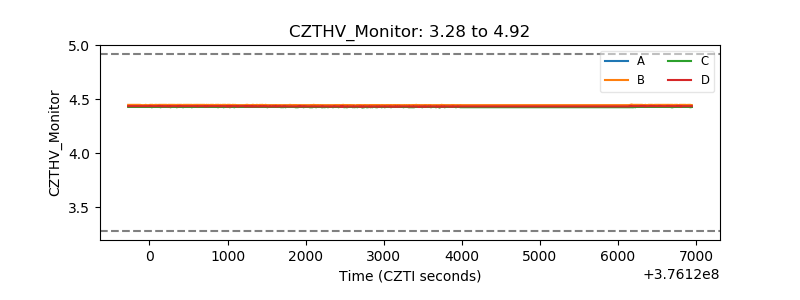 |
| D_VDD | 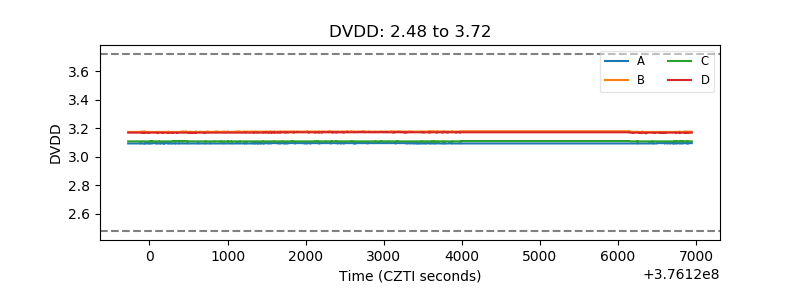 |
| Temperature 1 |  |
| Veto HV Monitor | 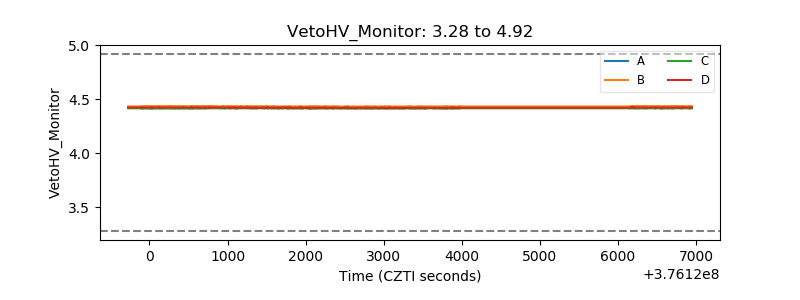 |
| Veto LLD |  |
| Alpha Counter | 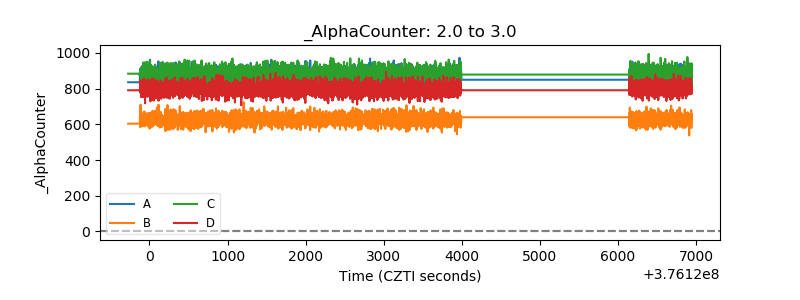 |
| _CPM_Rate | 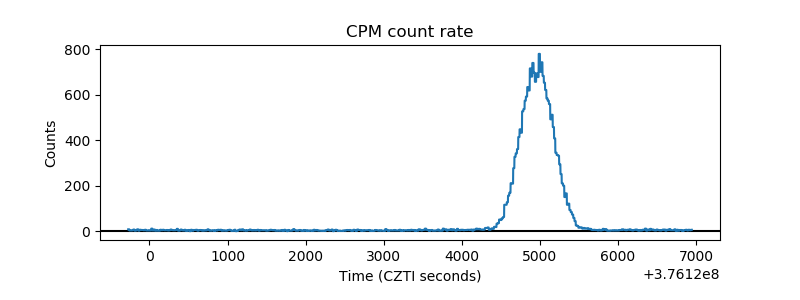 |
| CZT Counter | 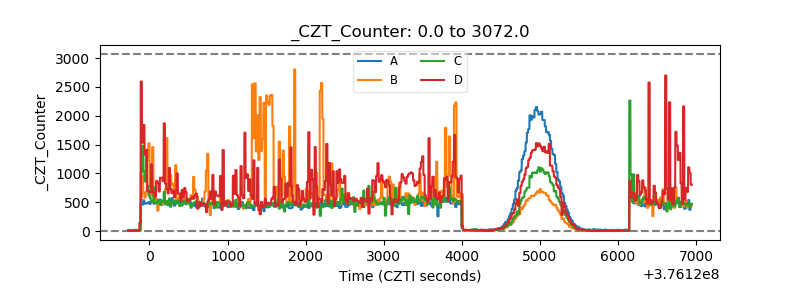 |
| +2.5 Volts monitor |  |
| +5 Volts monitor |  |
| _ROLL_ROT | 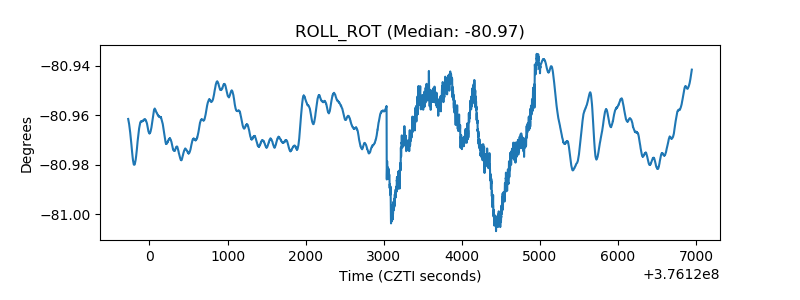 |
| _Roll_DEC | 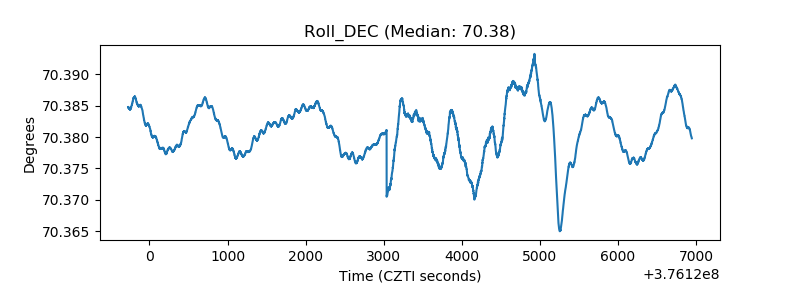 |
| _Roll_RA | 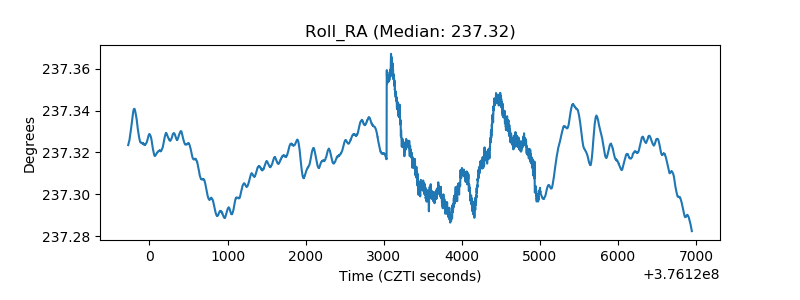 |
| Veto Counter | 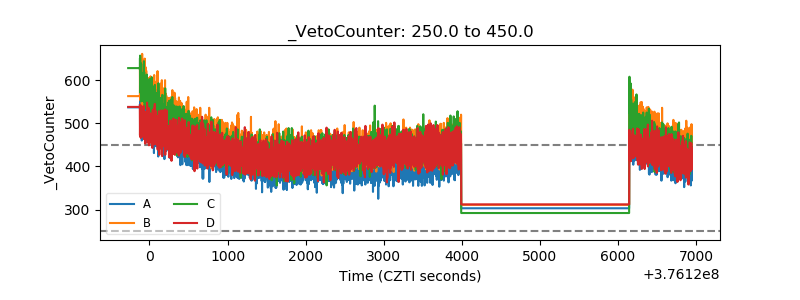 |