| Param | Original file | Final file |
|---|---|---|
| Filename | modeM0/AS1C07_001T03_9000004790_33411cztM0_level2.evt | modeM0/AS1C07_001T03_9000004790_33411cztM0_level2_quad_clean.evt |
| Size (bytes) | 1,123,073,280 | 212,754,240 |
| Size | 1.0 GB | 202.9 MB |
| Events in quadrant A | 6,015,363 | 1,470,753 |
| Events in quadrant B | 9,835,741 | 1,408,804 |
| Events in quadrant C | 6,630,609 | 1,379,053 |
| Events in quadrant D | 10,658,590 | 1,291,749 |
| Mode SS | |||
|---|---|---|---|
| Quadrant | BADHDUFLAG | Total packets | Discarded packets |
| A | 0 | 266 | 0 |
| B | 0 | 266 | 0 |
| C | 0 | 266 | 0 |
| D | 0 | 266 | 0 |
| Mode M0 | |||
|---|---|---|---|
| Quadrant | BADHDUFLAG | Total packets | Discarded packets |
| A | 0 | 25948 | 4 |
| B | 0 | 37467 | 3 |
| C | 0 | 27185 | 3 |
| D | 0 | 40744 | 3 |
| Mode M9 | |||
|---|---|---|---|
| Quadrant | BADHDUFLAG | Total packets | Discarded packets |
| A | 0 | 63 | 0 |
| B | 0 | 63 | 0 |
| C | 0 | 63 | 0 |
| D | 0 | 63 | 0 |
| Quadrant | Total seconds | Saturated seconds | Saturation percentage |
|---|---|---|---|
| A | 12925 | 6 | 0.046422% |
| B | 12925 | 1089 | 8.425532% |
| C | 12925 | 61 | 0.471954% |
| D | 12925 | 343 | 2.653772% |
Noise dominated data is calculated using 1-second bins in cleaned event files. If a bin has >2000 counts, and if more than 50% of those come from <1% of pixels, then it is considered to be noise-dominated and hence unusable.
| Quadrant | # 1 sec bins | Bins with >0 counts | Bins with >2000 counts | High rate bins dominated by noise | Noise dominated (total time) | Noise dominated (detector-on time) | Marked lightcurve |
|---|---|---|---|---|---|---|---|
| A | 19234 | 12928 | 0 | 0 | 0.00% | 0.00% |  |
| B | 19234 | 12928 | 899 | 899 | 4.67% | 6.95% |  |
| C | 19234 | 12928 | 48 | 48 | 0.25% | 0.37% |  |
| D | 19233 | 12927 | 308 | 308 | 1.60% | 2.38% |  |
Top three noisy pixels from each quadrant. If the there are fewer than three noisy pixels in the level2.evt file, extra rows are filled as -1
| Pixel properties | Quadrant properties | ||||||
|---|---|---|---|---|---|---|---|
| Quadrant | DetID | PixID | Counts | Sigma | Mean | Median | Sigma |
| A | 13 | 6 | 24395 | 75.64 | 1550 | 1525 | 302.4 |
| A | 13 | 254 | 23076 | 71.28 | 1550 | 1525 | 302.4 |
| A | 3 | 137 | 14040 | 41.39 | 1550 | 1525 | 302.4 |
| B | 5 | 172 | 2726899 | 9965.55 | 1478 | 1441 | 273.5 |
| B | 5 | 255 | 389062 | 1417.32 | 1478 | 1441 | 273.5 |
| B | 0 | 213 | 316805 | 1153.12 | 1478 | 1441 | 273.5 |
| C | 15 | 214 | 552604 | 1671.65 | 1460 | 1468 | 329.7 |
| C | 0 | 10 | 255147 | 769.43 | 1460 | 1468 | 329.7 |
| C | 14 | 254 | 46913 | 137.84 | 1460 | 1468 | 329.7 |
| D | 8 | 195 | 2649877 | 7602.95 | 1462 | 1425 | 348.3 |
| D | 2 | 250 | 602158 | 1724.53 | 1462 | 1425 | 348.3 |
| D | 13 | 249 | 346044 | 989.3 | 1462 | 1425 | 348.3 |
Histogram calculated using DETX and DETY for each event in the final _common_clean file
| Quadrant A |  |
 |
Quadrant B |
|---|---|---|---|
| Quadrant D |  |
 |
Quadrant C |
| Plot type | Count rate plots | Images |
|---|---|---|
| Comparison with Poisson distribution Blue bars denote a histogram of data divided into 1 sec bins. Red curve is a Poisson curve with rate = median count rate of data. |
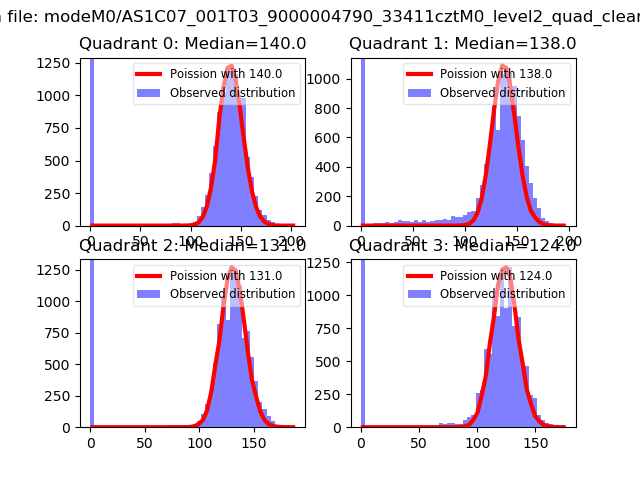 |
 |
| Quadrant-wise count rates Data is divided into 100 sec bins |
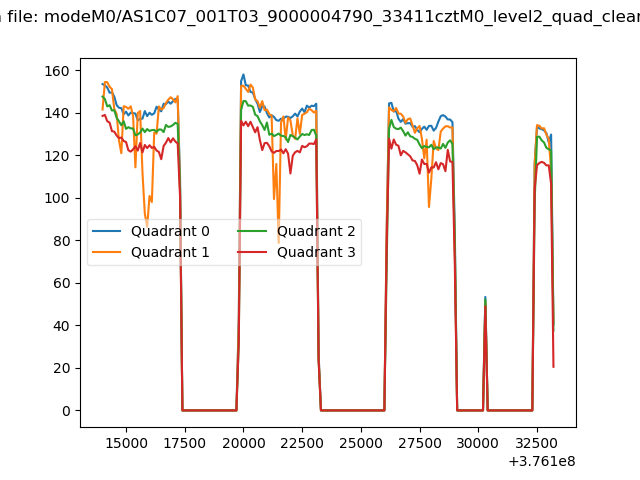 |
|
| Module-wise count rates for Quadrant A Data is divided into 100 sec bins |
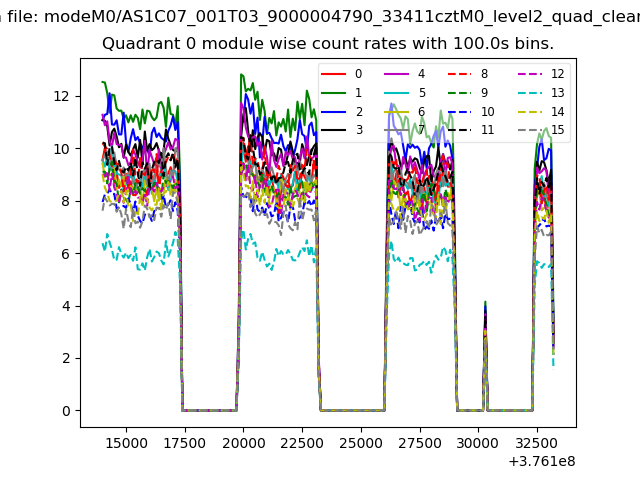 |
 |
| Module-wise count rates for Quadrant B Data is divided into 100 sec bins |
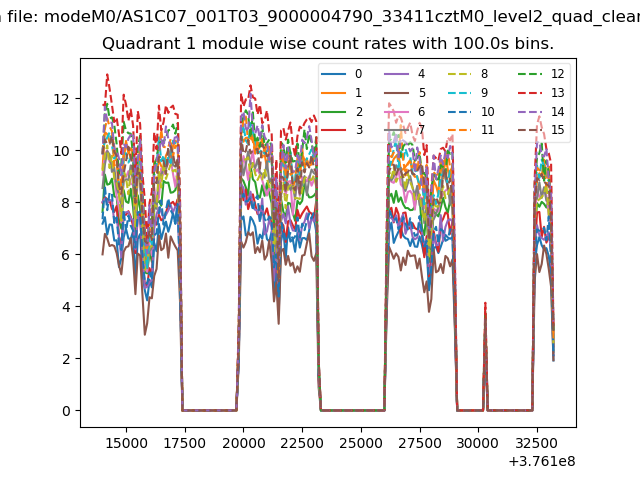 |
 |
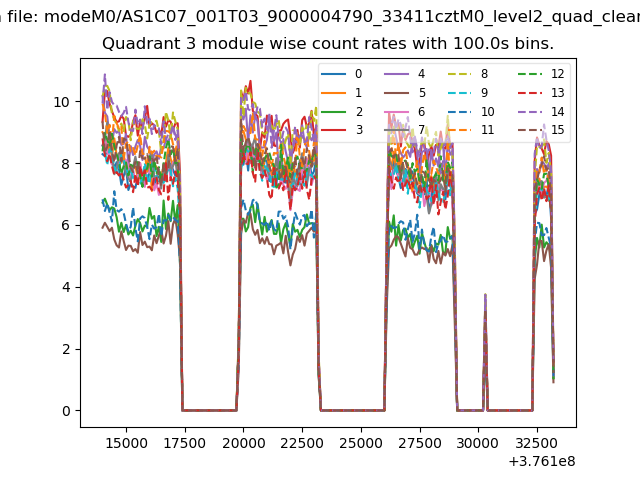
| Module-wise count rates for Quadrant C Data is divided into 100 sec bins |
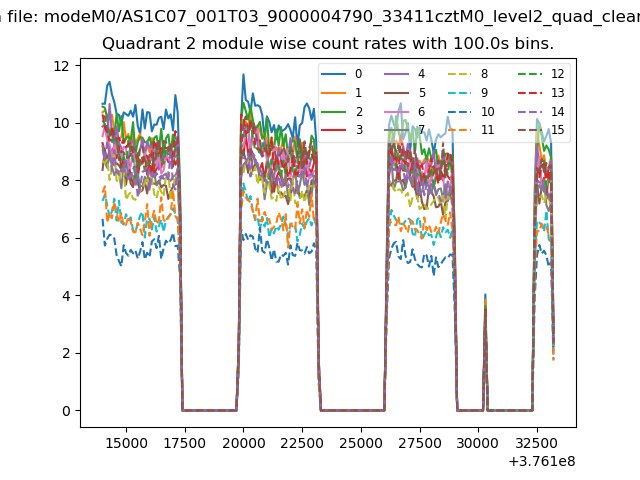 |
 |
| Module-wise count rates for Quadrant D Data is divided into 100 sec bins |
 |
 |
| Parameter | Plot |
|---|---|
| CZT HV Monitor | 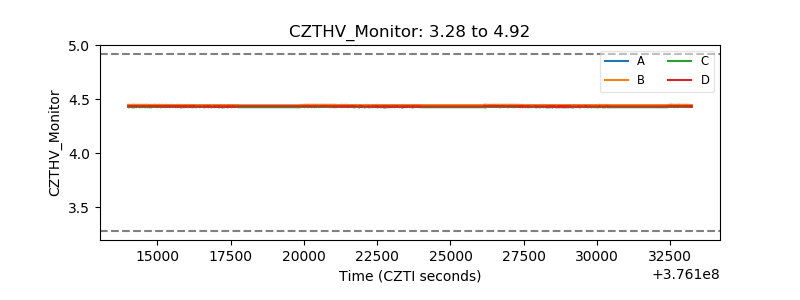 |
| D_VDD |  |
| Temperature 1 |  |
| Veto HV Monitor |  |
| Veto LLD |  |
| Alpha Counter | 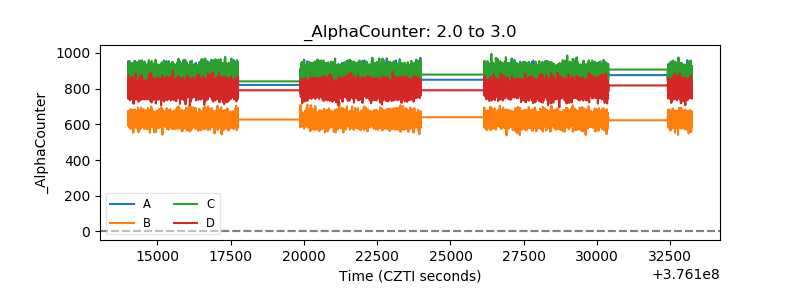 |
| _CPM_Rate | 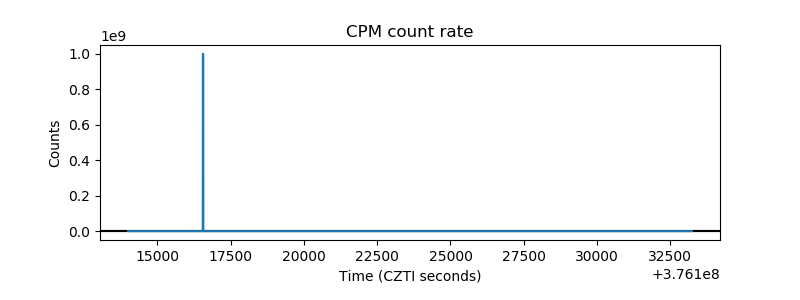 |
| CZT Counter |  |
| +2.5 Volts monitor |  |
| +5 Volts monitor |  |
| _ROLL_ROT | 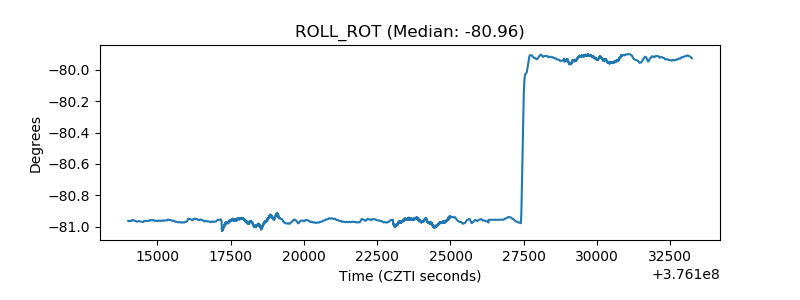 |
| _Roll_DEC | 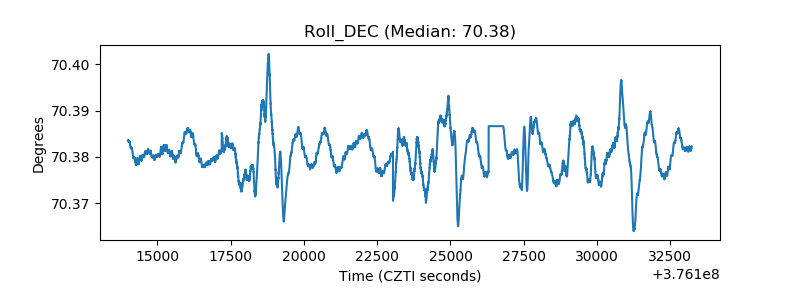 |
| _Roll_RA |  |
| Veto Counter | 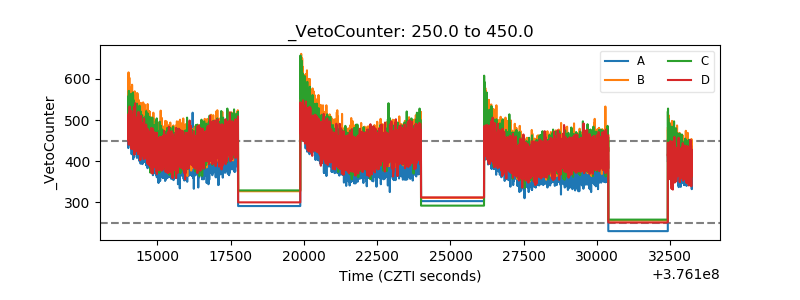 |