| Param | Original file | Final file |
|---|---|---|
| Filename | modeM0/AS1C07_001T03_9000004790_33412cztM0_level2.evt | modeM0/AS1C07_001T03_9000004790_33412cztM0_level2_quad_clean.evt |
| Size (bytes) | 589,014,720 | 74,419,200 |
| Size | 561.7 MB | 71.0 MB |
| Events in quadrant A | 2,377,594 | 522,646 |
| Events in quadrant B | 4,925,643 | 483,633 |
| Events in quadrant C | 2,780,531 | 498,074 |
| Events in quadrant D | 7,394,739 | 376,193 |
| Mode SS | |||
|---|---|---|---|
| Quadrant | BADHDUFLAG | Total packets | Discarded packets |
| A | 0 | 110 | 0 |
| B | 0 | 110 | 0 |
| C | 0 | 110 | 0 |
| D | 0 | 110 | 0 |
| Mode M0 | |||
|---|---|---|---|
| Quadrant | BADHDUFLAG | Total packets | Discarded packets |
| A | 0 | 10640 | 3 |
| B | 0 | 18150 | 2 |
| C | 0 | 11379 | 2 |
| D | 0 | 25533 | 2 |
| Mode M9 | |||
|---|---|---|---|
| Quadrant | BADHDUFLAG | Total packets | Discarded packets |
| A | 0 | 17 | 0 |
| B | 0 | 17 | 0 |
| C | 0 | 17 | 0 |
| D | 0 | 18 | 0 |
| Quadrant | Total seconds | Saturated seconds | Saturation percentage |
|---|---|---|---|
| A | 5308 | 5 | 0.094197% |
| B | 5308 | 676 | 12.735494% |
| C | 5308 | 46 | 0.866616% |
| D | 5308 | 1444 | 27.204220% |
Noise dominated data is calculated using 1-second bins in cleaned event files. If a bin has >2000 counts, and if more than 50% of those come from <1% of pixels, then it is considered to be noise-dominated and hence unusable.
| Quadrant | # 1 sec bins | Bins with >0 counts | Bins with >2000 counts | High rate bins dominated by noise | Noise dominated (total time) | Noise dominated (detector-on time) | Marked lightcurve |
|---|---|---|---|---|---|---|---|
| A | 7041 | 5309 | 0 | 0 | 0.00% | 0.00% | 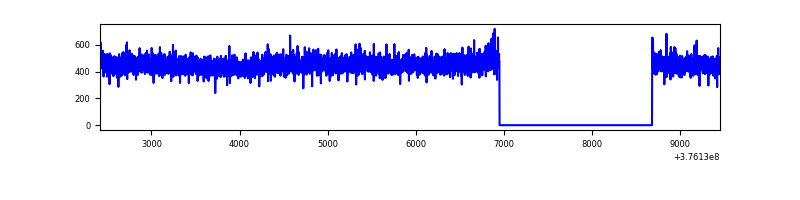 |
| B | 7041 | 5309 | 549 | 549 | 7.80% | 10.34% | 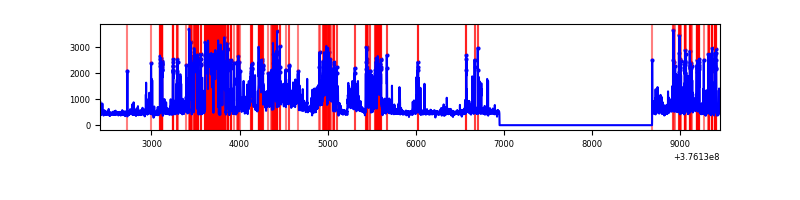 |
| C | 7041 | 5309 | 35 | 35 | 0.50% | 0.66% |  |
| D | 7041 | 5309 | 1369 | 1369 | 19.44% | 25.79% | 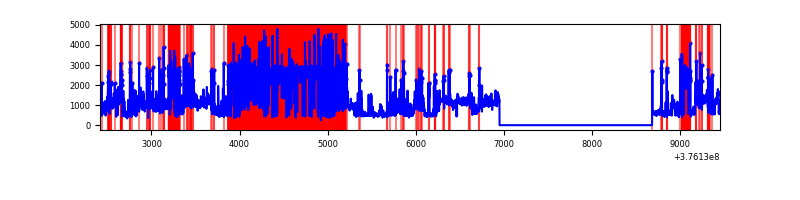 |
Top three noisy pixels from each quadrant. If the there are fewer than three noisy pixels in the level2.evt file, extra rows are filled as -1
| Pixel properties | Quadrant properties | ||||||
|---|---|---|---|---|---|---|---|
| Quadrant | DetID | PixID | Counts | Sigma | Mean | Median | Sigma |
| A | 13 | 6 | 10685 | 82.8 | 611 | 599 | 121.8 |
| A | 13 | 254 | 9696 | 74.68 | 611 | 599 | 121.8 |
| A | 3 | 137 | 5702 | 41.89 | 611 | 599 | 121.8 |
| B | 5 | 172 | 1502199 | 13589.28 | 575 | 560 | 110.5 |
| B | 5 | 255 | 797537 | 7212.35 | 575 | 560 | 110.5 |
| B | 0 | 213 | 133897 | 1206.65 | 575 | 560 | 110.5 |
| C | 15 | 214 | 232410 | 1728.94 | 584 | 587 | 134.1 |
| C | 0 | 10 | 132737 | 985.58 | 584 | 587 | 134.1 |
| C | 1 | 23 | 53982 | 398.22 | 584 | 587 | 134.1 |
| D | 1 | 52 | 3257781 | 27078.68 | 488 | 473 | 120.3 |
| D | 8 | 195 | 1465297 | 12177.39 | 488 | 473 | 120.3 |
| D | 12 | 218 | 224257 | 1860.36 | 488 | 473 | 120.3 |
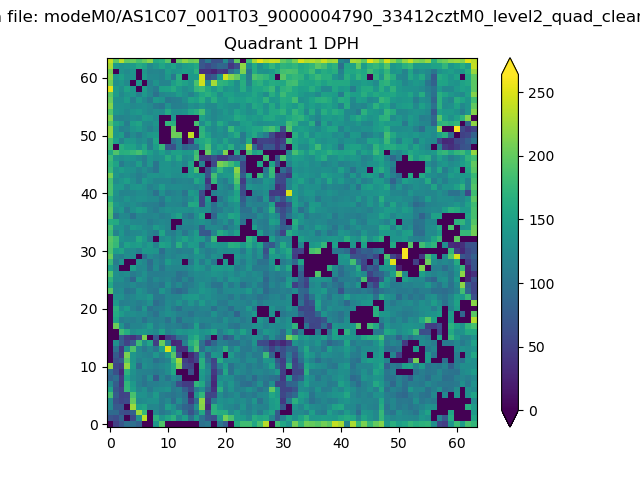
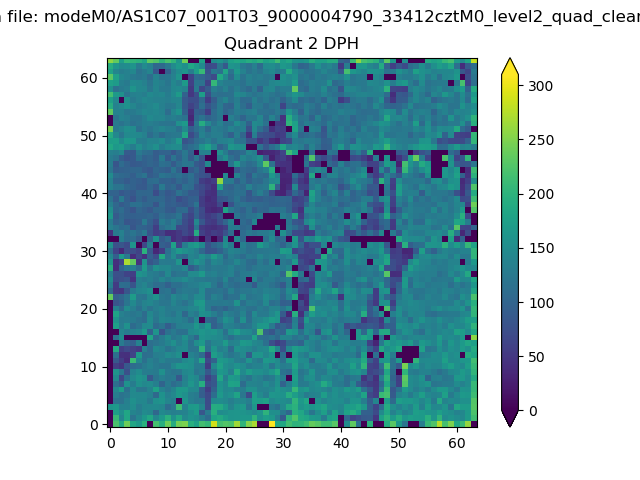
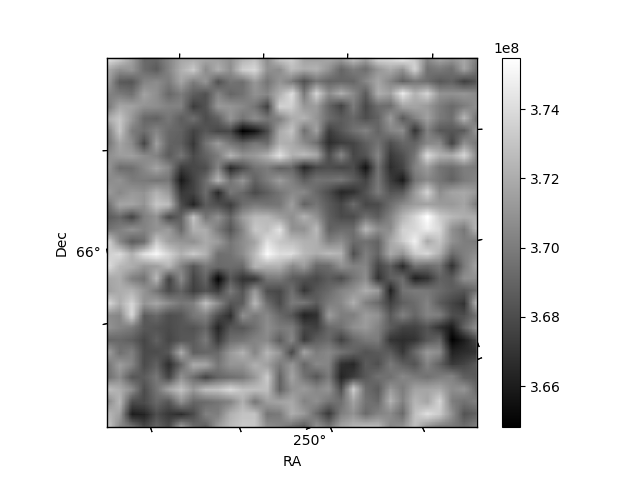
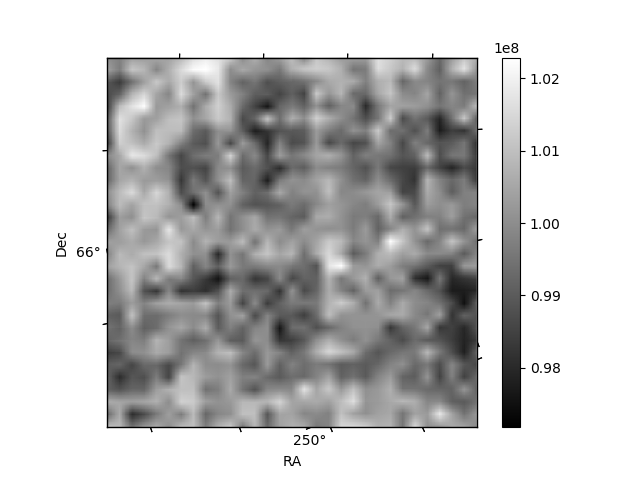
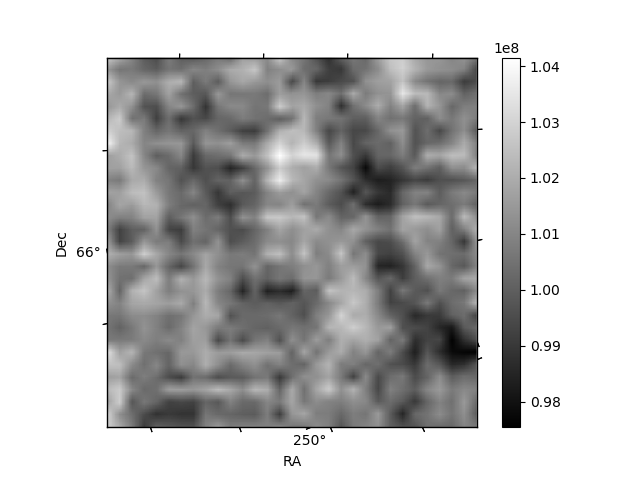
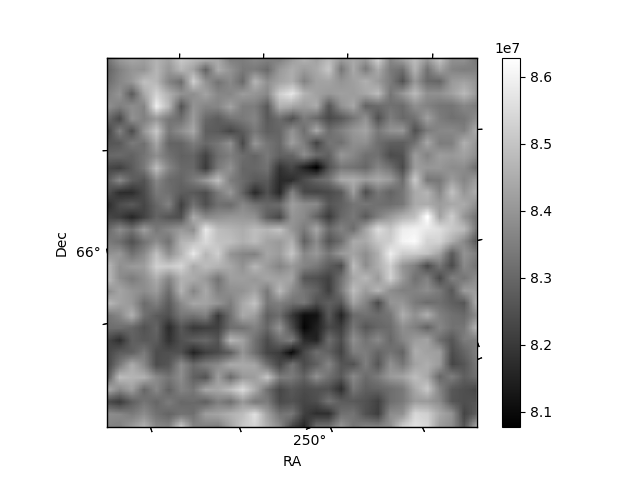
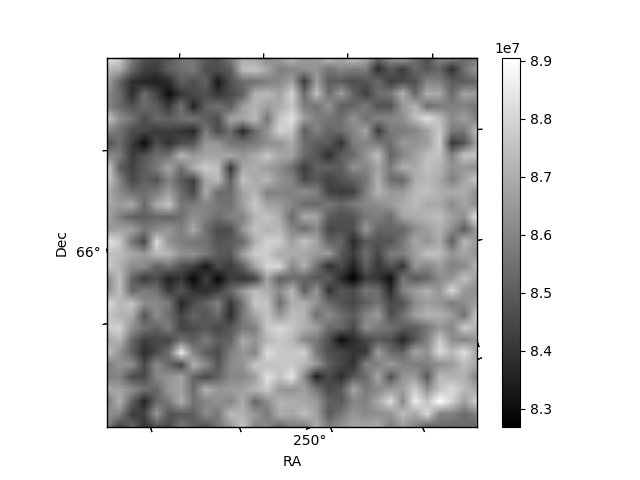
Histogram calculated using DETX and DETY for each event in the final _common_clean file
| Quadrant A | 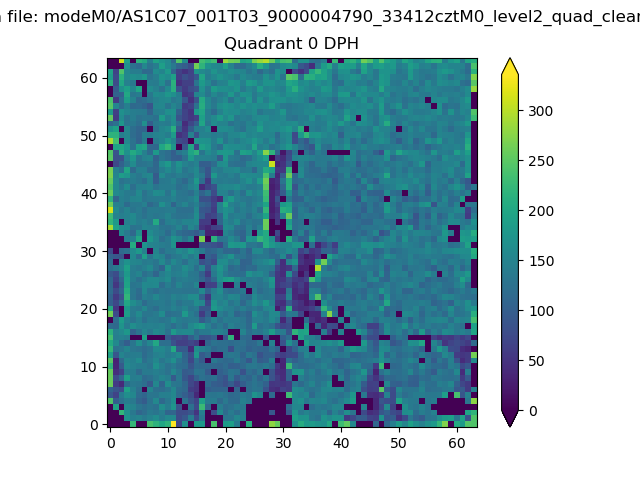 |
 |
Quadrant B |
|---|---|---|---|
| Quadrant D | 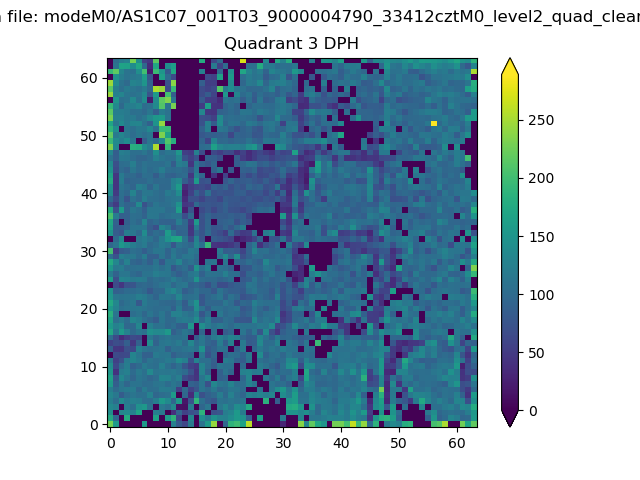 |
 |
Quadrant C |
| Plot type | Count rate plots | Images |
|---|---|---|
| Comparison with Poisson distribution Blue bars denote a histogram of data divided into 1 sec bins. Red curve is a Poisson curve with rate = median count rate of data. |
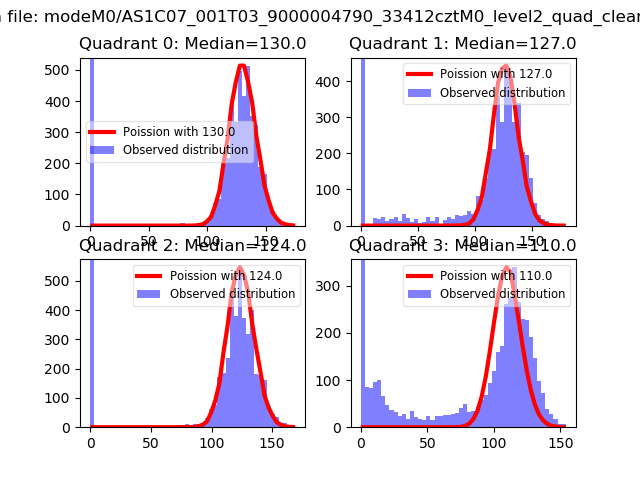 |
 |
| Quadrant-wise count rates Data is divided into 100 sec bins |
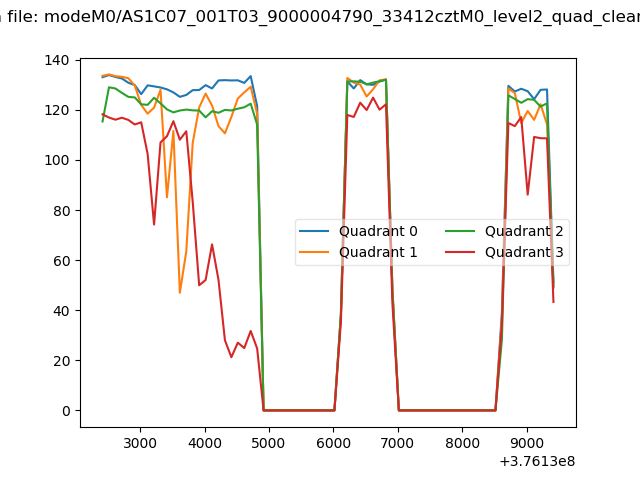 |
|
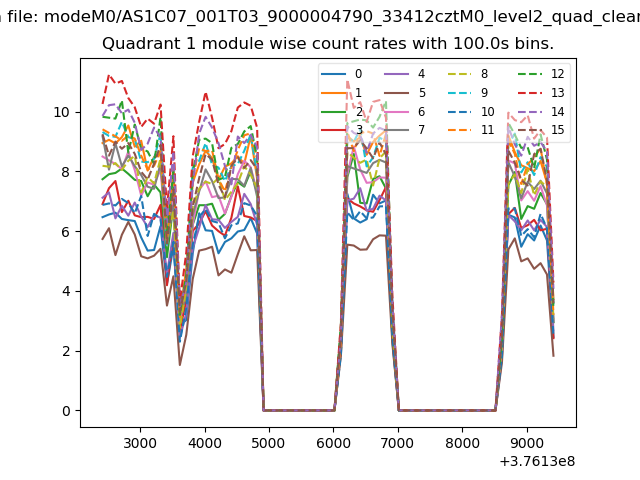
| Module-wise count rates for Quadrant A Data is divided into 100 sec bins |
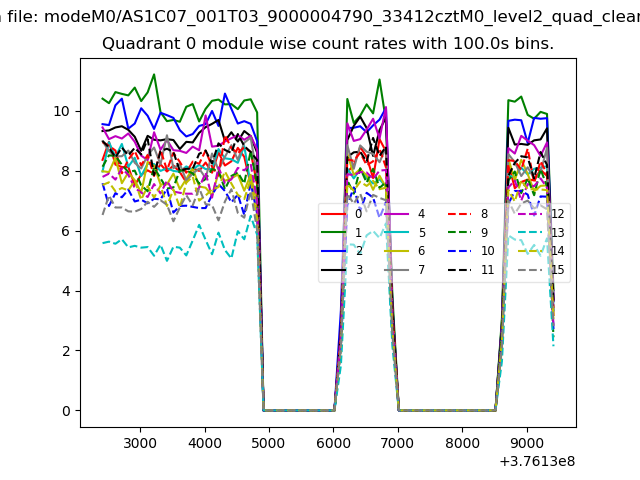 |
 |
| Module-wise count rates for Quadrant B Data is divided into 100 sec bins |
 |
 |
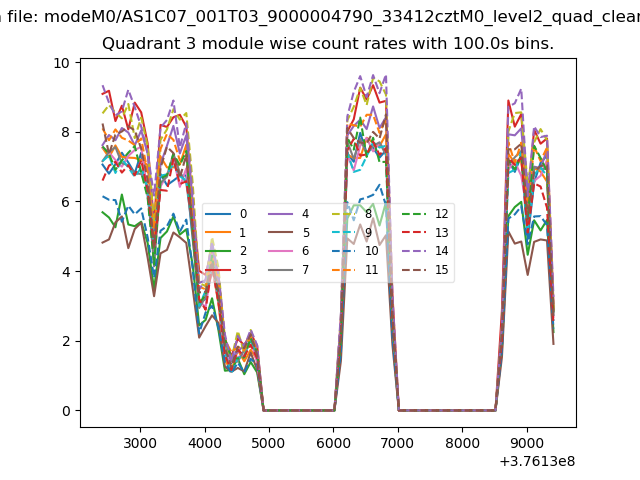
| Module-wise count rates for Quadrant C Data is divided into 100 sec bins |
 |
 |
| Module-wise count rates for Quadrant D Data is divided into 100 sec bins |
 |
 |
| Parameter | Plot |
|---|---|
| CZT HV Monitor | 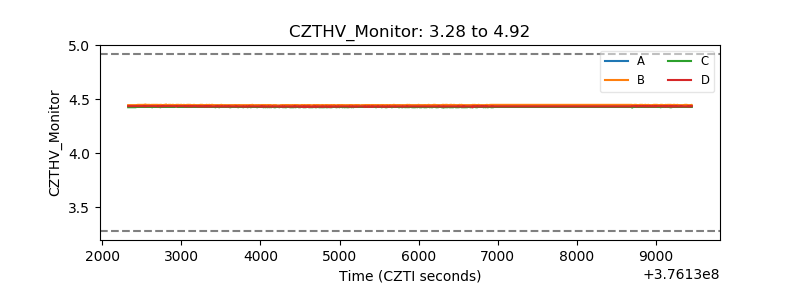 |
| D_VDD | 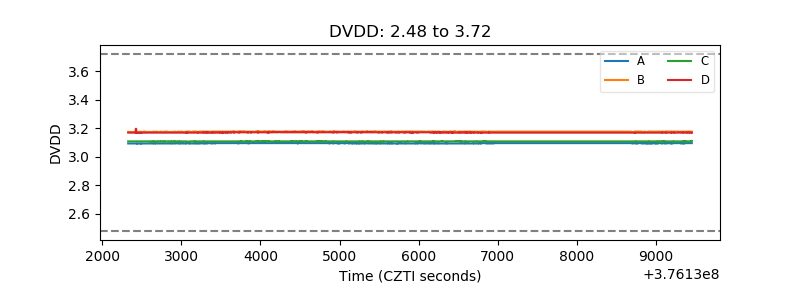 |
| Temperature 1 | 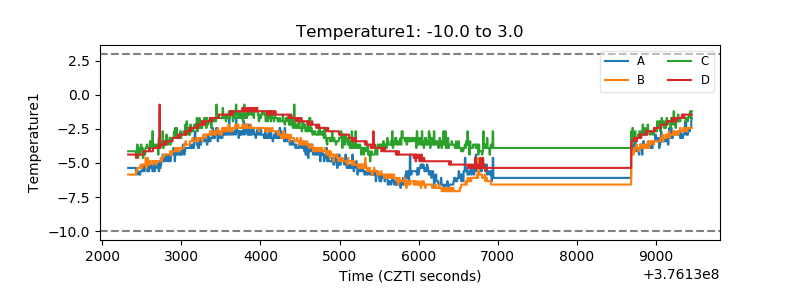 |
| Veto HV Monitor | 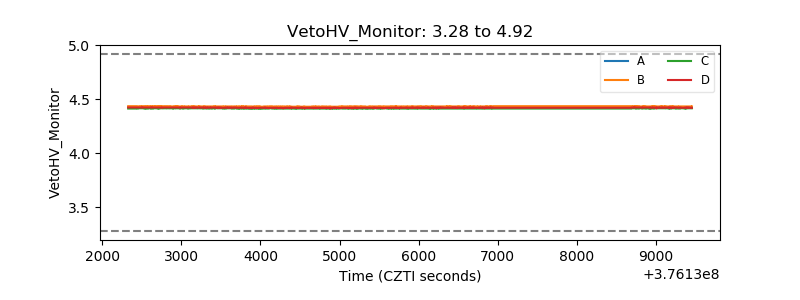 |
| Veto LLD | 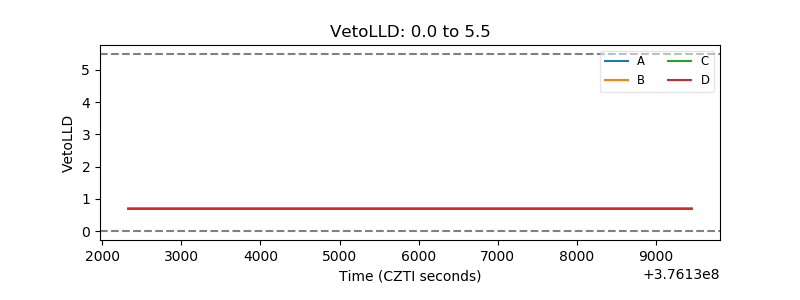 |
| Alpha Counter | 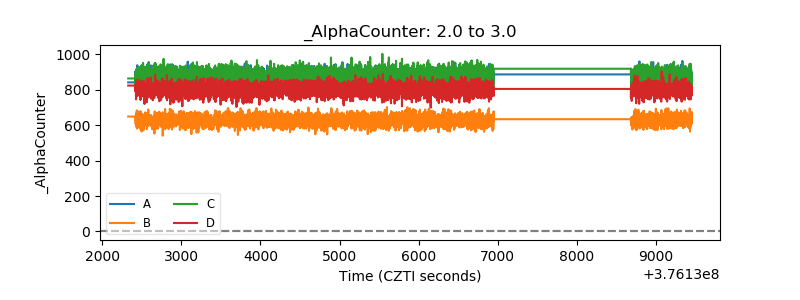 |
| _CPM_Rate | 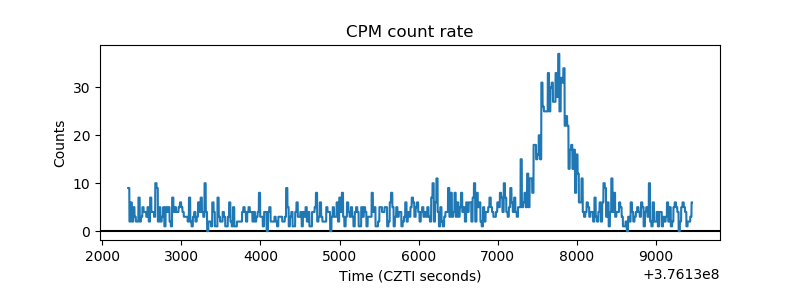 |
| CZT Counter | 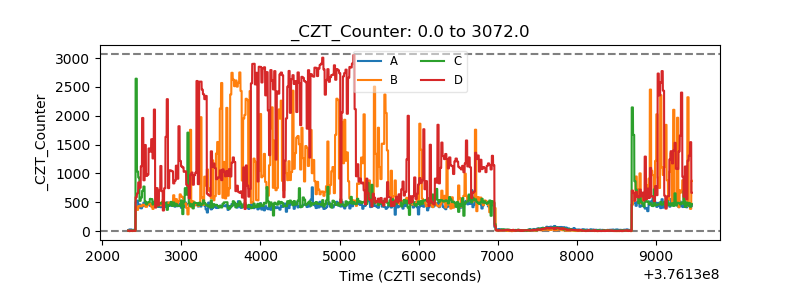 |
| +2.5 Volts monitor |  |
| +5 Volts monitor | 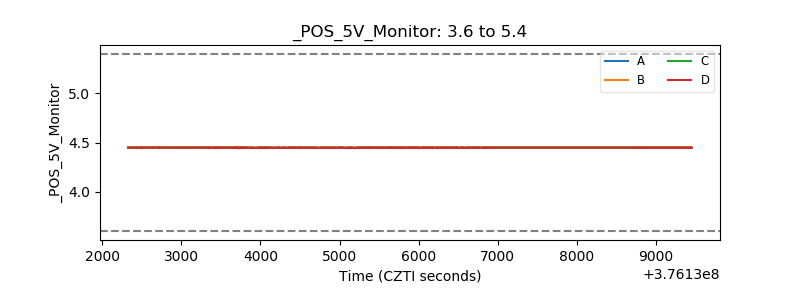 |
| _ROLL_ROT | 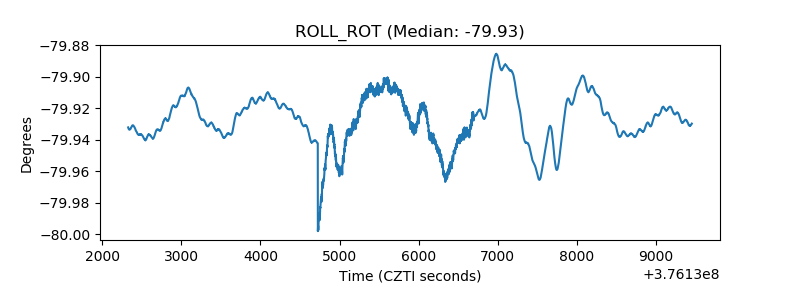 |
| _Roll_DEC | 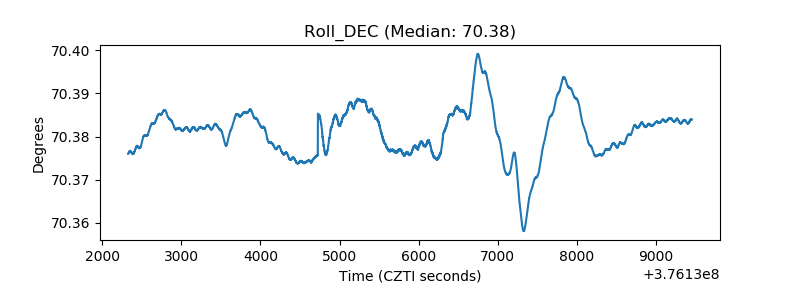 |
| _Roll_RA | 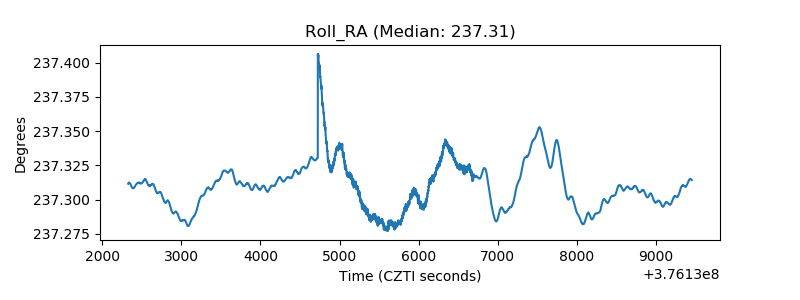 |
| Veto Counter | 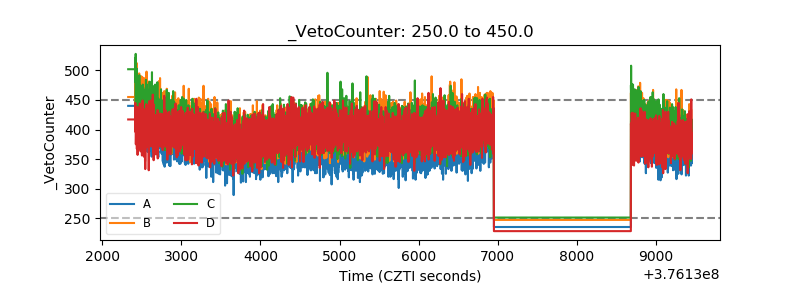 |