| Param | Original file | Final file |
|---|---|---|
| Filename | modeM0/AS1C07_001T03_9000004790_33417cztM0_level2.evt | modeM0/AS1C07_001T03_9000004790_33417cztM0_level2_quad_clean.evt |
| Size (bytes) | 1,375,162,560 | 206,755,200 |
| Size | 1.3 GB | 197.2 MB |
| Events in quadrant A | 7,143,216 | 1,360,587 |
| Events in quadrant B | 11,204,174 | 1,289,468 |
| Events in quadrant C | 8,587,842 | 1,310,858 |
| Events in quadrant D | 13,659,259 | 1,223,281 |
| Mode SS | |||
|---|---|---|---|
| Quadrant | BADHDUFLAG | Total packets | Discarded packets |
| A | 0 | 318 | 0 |
| B | 0 | 318 | 0 |
| C | 0 | 318 | 0 |
| D | 0 | 318 | 0 |
| Mode M0 | |||
|---|---|---|---|
| Quadrant | BADHDUFLAG | Total packets | Discarded packets |
| A | 0 | 31822 | 4 |
| B | 0 | 43724 | 3 |
| C | 0 | 34839 | 3 |
| D | 0 | 51502 | 3 |
| Mode M9 | |||
|---|---|---|---|
| Quadrant | BADHDUFLAG | Total packets | Discarded packets |
| A | 0 | 43 | 0 |
| B | 0 | 43 | 0 |
| C | 0 | 43 | 0 |
| D | 0 | 44 | 0 |
| Quadrant | Total seconds | Saturated seconds | Saturation percentage |
|---|---|---|---|
| A | 15615 | 17 | 0.108870% |
| B | 15615 | 1348 | 8.632725% |
| C | 15615 | 264 | 1.690682% |
| D | 15615 | 652 | 4.175472% |
Noise dominated data is calculated using 1-second bins in cleaned event files. If a bin has >2000 counts, and if more than 50% of those come from <1% of pixels, then it is considered to be noise-dominated and hence unusable.
| Quadrant | # 1 sec bins | Bins with >0 counts | Bins with >2000 counts | High rate bins dominated by noise | Noise dominated (total time) | Noise dominated (detector-on time) | Marked lightcurve |
|---|---|---|---|---|---|---|---|
| A | 19824 | 15618 | 0 | 0 | 0.00% | 0.00% | 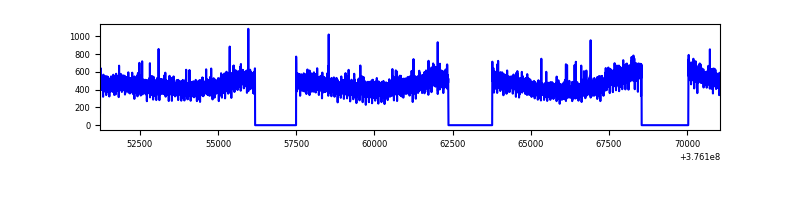 |
| B | 19824 | 15618 | 1067 | 1067 | 5.38% | 6.83% | 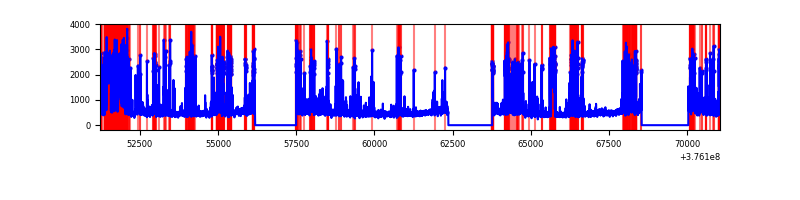 |
| C | 19824 | 15618 | 210 | 210 | 1.06% | 1.34% |  |
| D | 19824 | 15618 | 561 | 561 | 2.83% | 3.59% | 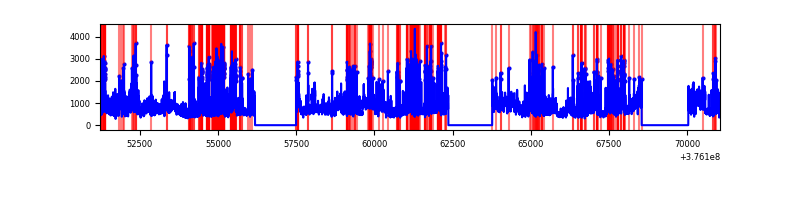 |
Top three noisy pixels from each quadrant. If the there are fewer than three noisy pixels in the level2.evt file, extra rows are filled as -1
| Pixel properties | Quadrant properties | ||||||
|---|---|---|---|---|---|---|---|
| Quadrant | DetID | PixID | Counts | Sigma | Mean | Median | Sigma |
| A | 15 | 47 | 158246 | 436.07 | 1800 | 1767 | 358.8 |
| A | 13 | 6 | 28532 | 74.59 | 1800 | 1767 | 358.8 |
| A | 13 | 254 | 25925 | 67.32 | 1800 | 1767 | 358.8 |
| B | 5 | 172 | 3580395 | 10888.48 | 1725 | 1677 | 328.7 |
| B | 0 | 213 | 284664 | 861.01 | 1725 | 1677 | 328.7 |
| B | 5 | 255 | 204489 | 617.07 | 1725 | 1677 | 328.7 |
| C | 15 | 214 | 663717 | 1669.8 | 1730 | 1744 | 396.4 |
| C | 9 | 187 | 425085 | 1067.86 | 1730 | 1744 | 396.4 |
| C | 0 | 10 | 283764 | 711.38 | 1730 | 1744 | 396.4 |
| D | 8 | 195 | 4207742 | 9962.53 | 1717 | 1666 | 422.2 |
| D | 14 | 173 | 1128325 | 2668.61 | 1717 | 1666 | 422.2 |
| D | 13 | 249 | 518259 | 1223.6 | 1717 | 1666 | 422.2 |
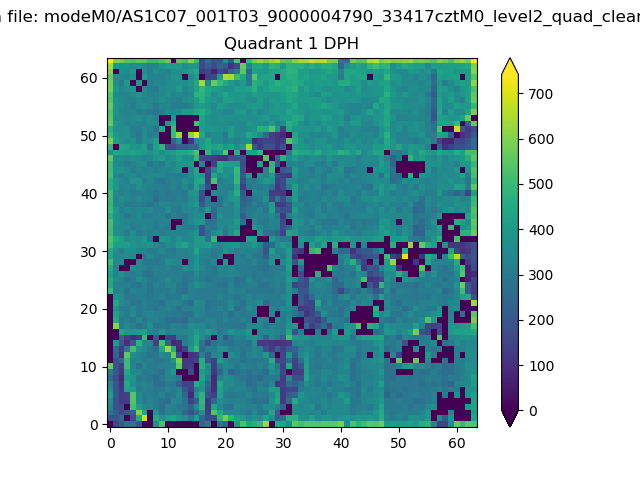
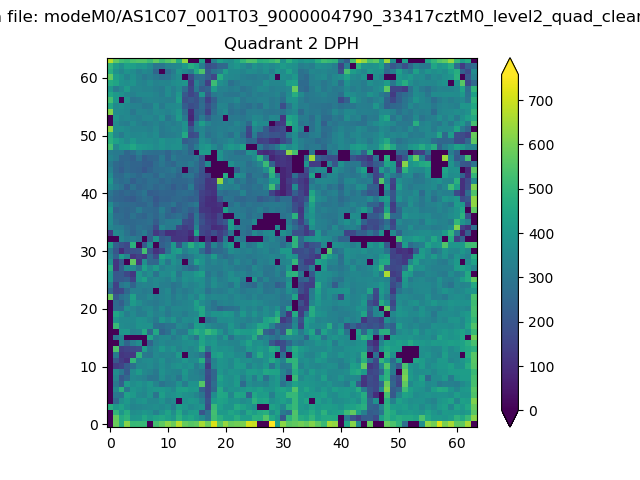
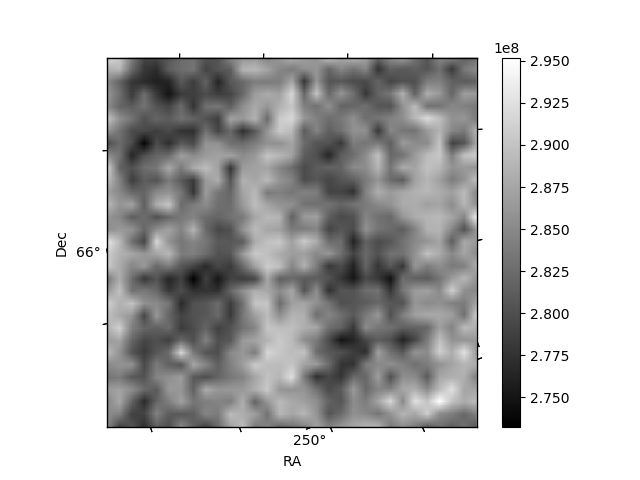
Histogram calculated using DETX and DETY for each event in the final _common_clean file
| Quadrant A | 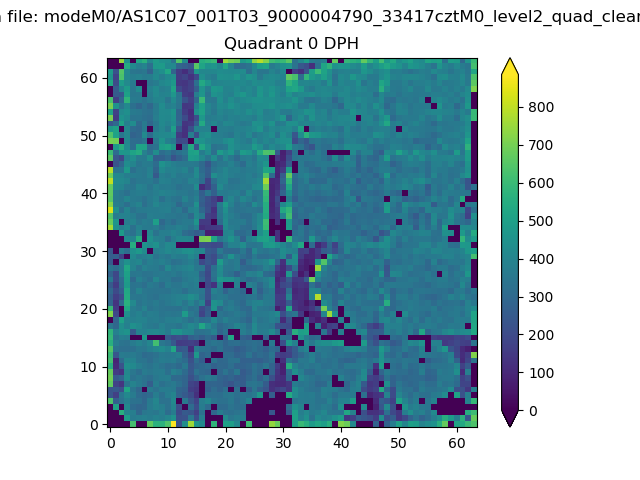 |
 |
Quadrant B |
|---|---|---|---|
| Quadrant D |  |
 |
Quadrant C |
| Plot type | Count rate plots | Images |
|---|---|---|
| Comparison with Poisson distribution Blue bars denote a histogram of data divided into 1 sec bins. Red curve is a Poisson curve with rate = median count rate of data. |
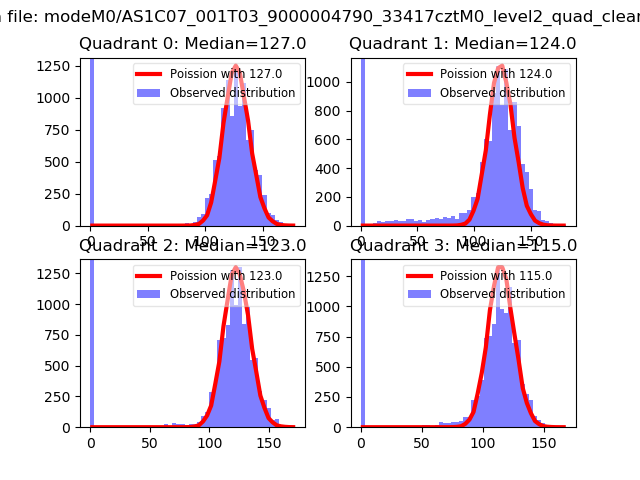 |
 |
| Quadrant-wise count rates Data is divided into 100 sec bins |
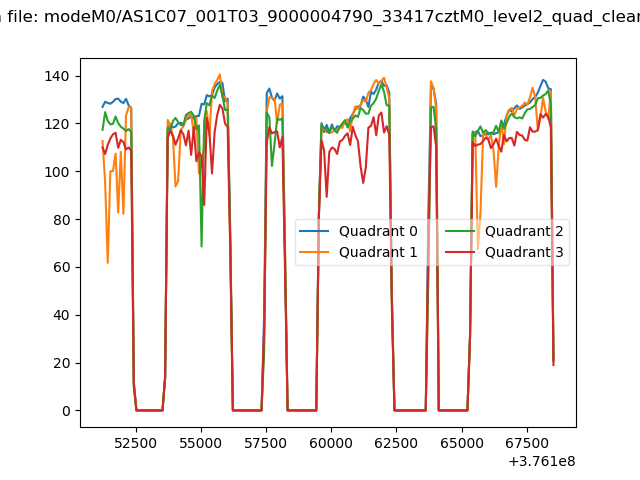 |
|
| Module-wise count rates for Quadrant A Data is divided into 100 sec bins |
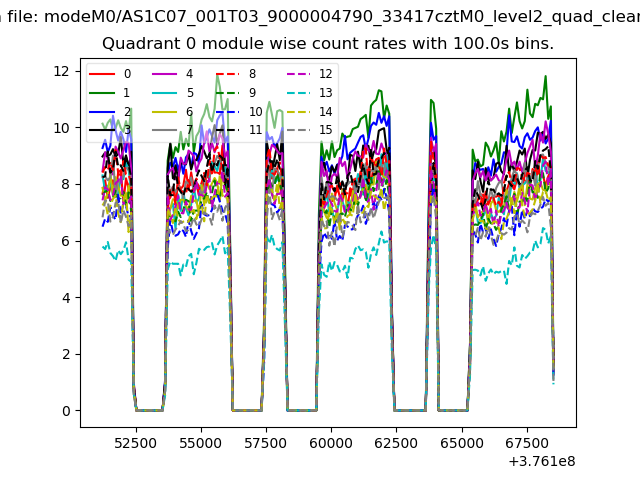 |
 |
| Module-wise count rates for Quadrant B Data is divided into 100 sec bins |
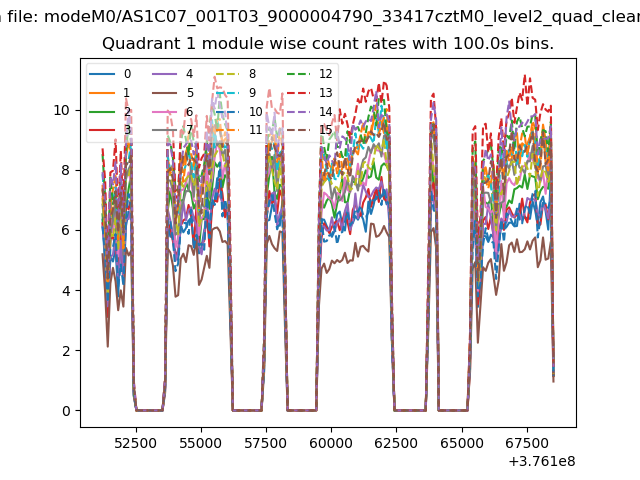 |
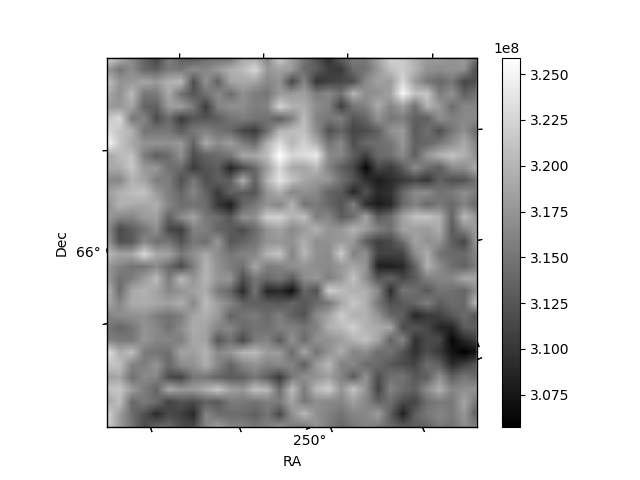 |
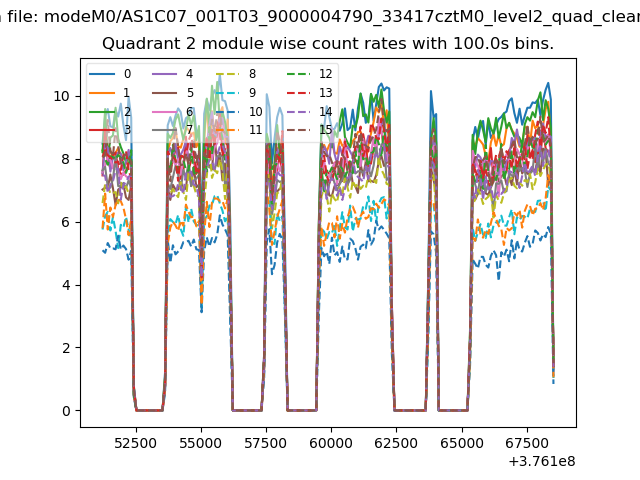
| Module-wise count rates for Quadrant C Data is divided into 100 sec bins |
 |
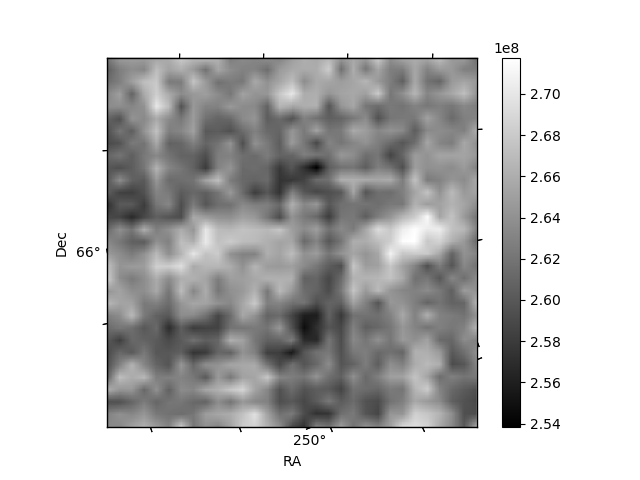 |
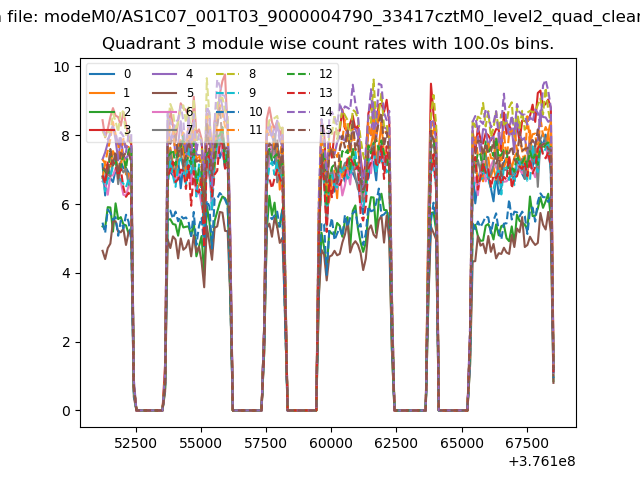
| Module-wise count rates for Quadrant D Data is divided into 100 sec bins |
 |
 |
| Parameter | Plot |
|---|---|
| CZT HV Monitor | 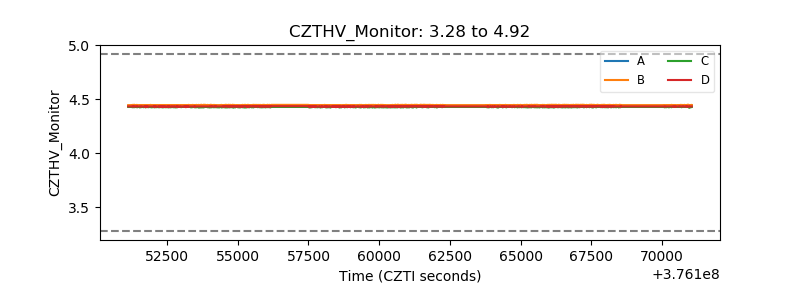 |
| D_VDD | 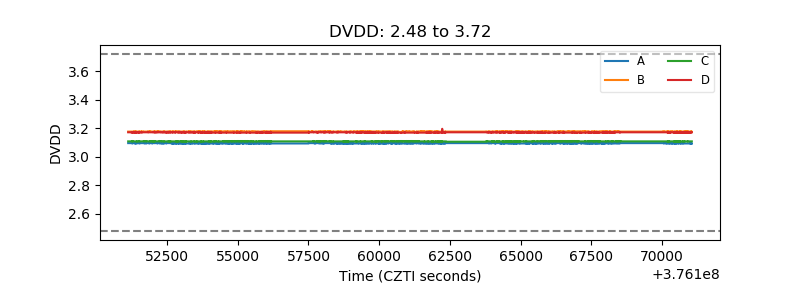 |
| Temperature 1 | 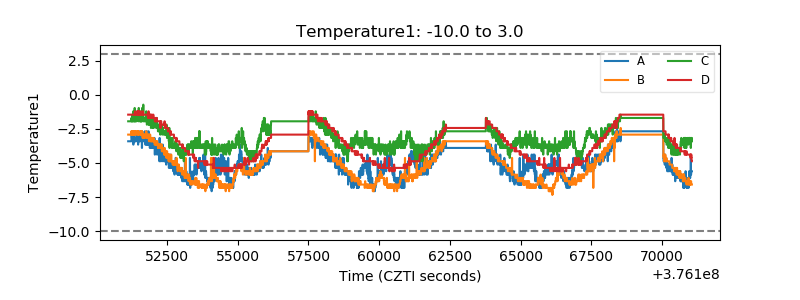 |
| Veto HV Monitor | 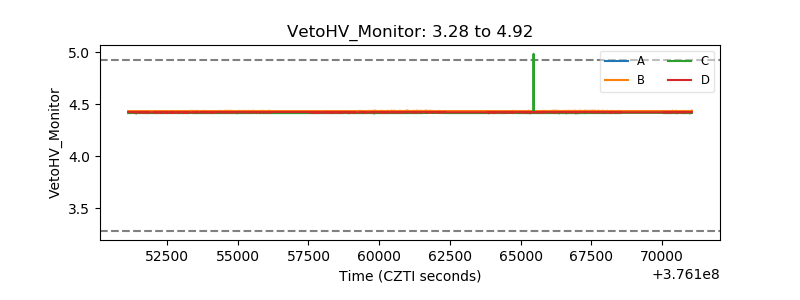 |
| Veto LLD | 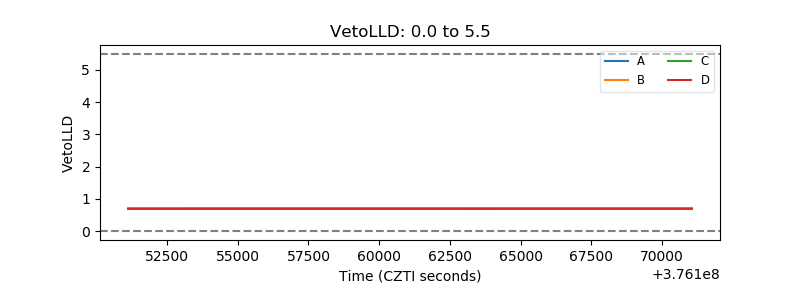 |
| Alpha Counter | 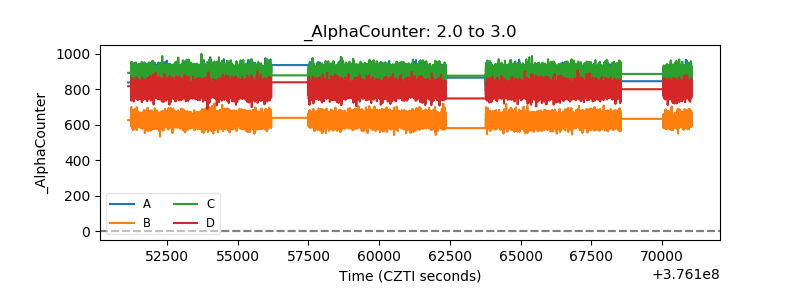 |
| _CPM_Rate | 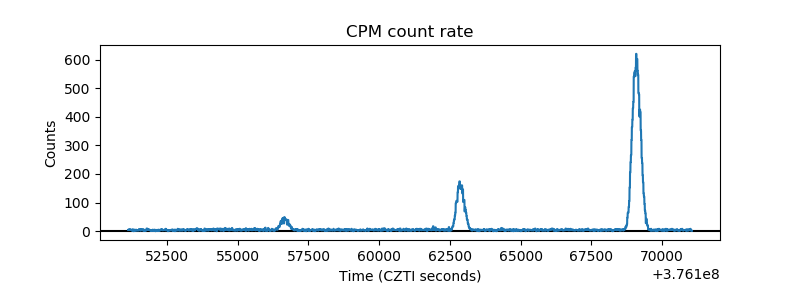 |
| CZT Counter | 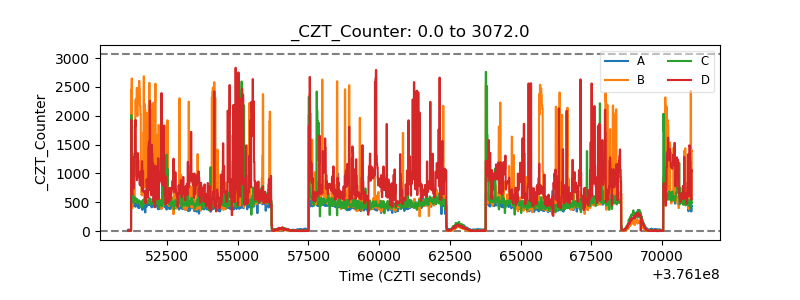 |
| +2.5 Volts monitor |  |
| +5 Volts monitor | 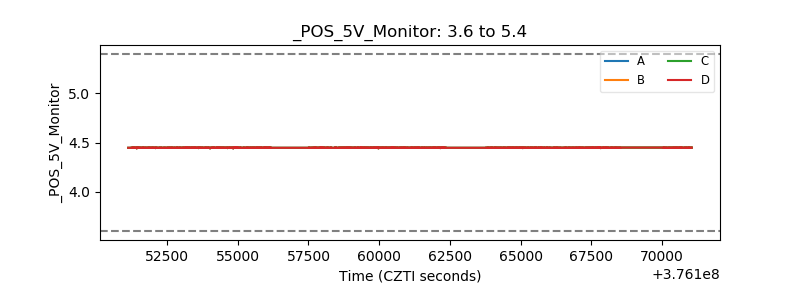 |
| _ROLL_ROT | 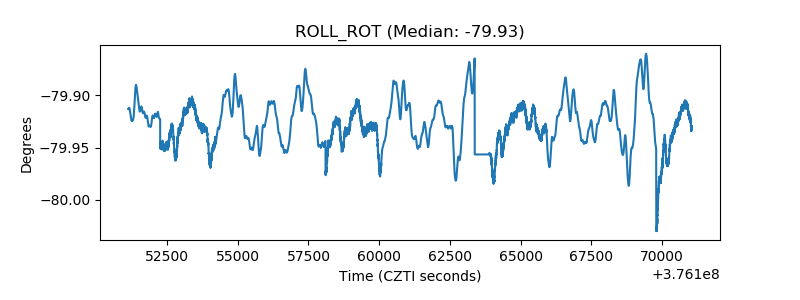 |
| _Roll_DEC | 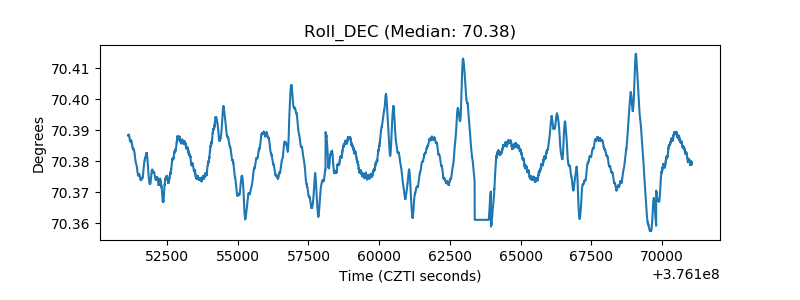 |
| _Roll_RA | 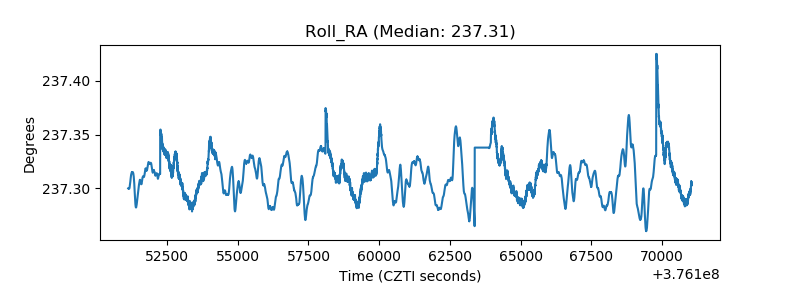 |
| Veto Counter | 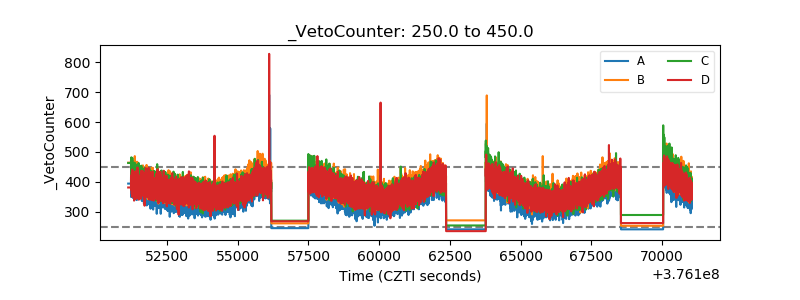 |