| Param | Original file | Final file |
|---|---|---|
| Filename | modeM0/AS1C07_001T03_9000004790_33418cztM0_level2.evt | modeM0/AS1C07_001T03_9000004790_33418cztM0_level2_quad_clean.evt |
| Size (bytes) | 195,785,280 | 27,581,760 |
| Size | 186.7 MB | 26.3 MB |
| Events in quadrant A | 1,181,501 | 165,533 |
| Events in quadrant B | 1,440,187 | 165,533 |
| Events in quadrant C | 1,228,766 | 167,401 |
| Events in quadrant D | 1,909,981 | 159,613 |
| Mode SS | |||
|---|---|---|---|
| Quadrant | BADHDUFLAG | Total packets | Discarded packets |
| A | 0 | 50 | 0 |
| B | 0 | 50 | 0 |
| C | 0 | 50 | 0 |
| D | 0 | 50 | 0 |
| Mode M0 | |||
|---|---|---|---|
| Quadrant | BADHDUFLAG | Total packets | Discarded packets |
| A | 0 | 5011 | 0 |
| B | 0 | 6010 | 0 |
| C | 0 | 5234 | 0 |
| D | 0 | 7363 | 0 |
| Quadrant | Total seconds | Saturated seconds | Saturation percentage |
|---|---|---|---|
| A | 2453 | 0 | 0.000000% |
| B | 2453 | 77 | 3.139013% |
| C | 2453 | 0 | 0.000000% |
| D | 2453 | 18 | 0.733795% |
Noise dominated data is calculated using 1-second bins in cleaned event files. If a bin has >2000 counts, and if more than 50% of those come from <1% of pixels, then it is considered to be noise-dominated and hence unusable.
| Quadrant | # 1 sec bins | Bins with >0 counts | Bins with >2000 counts | High rate bins dominated by noise | Noise dominated (total time) | Noise dominated (detector-on time) | Marked lightcurve |
|---|---|---|---|---|---|---|---|
| A | 2453 | 2453 | 0 | 0 | 0.00% | 0.00% | 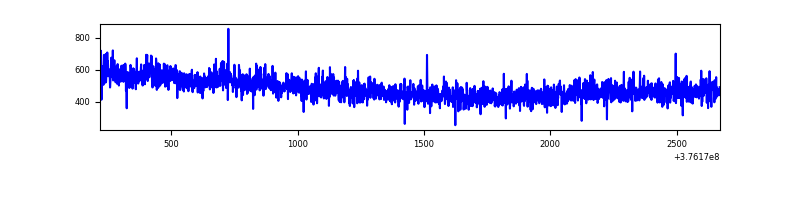 |
| B | 2453 | 2453 | 59 | 59 | 2.41% | 2.41% | 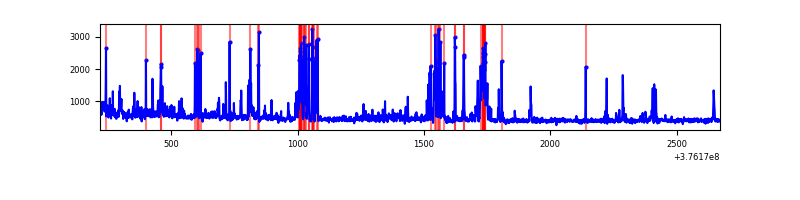 |
| C | 2453 | 2453 | 0 | 0 | 0.00% | 0.00% | 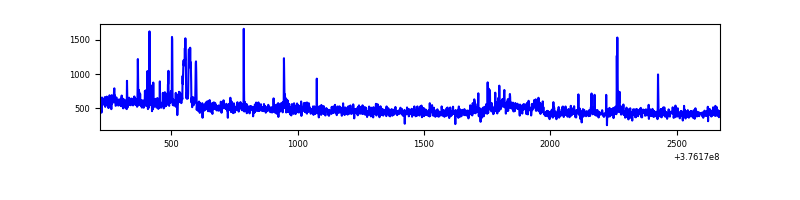 |
| D | 2453 | 2453 | 10 | 10 | 0.41% | 0.41% | 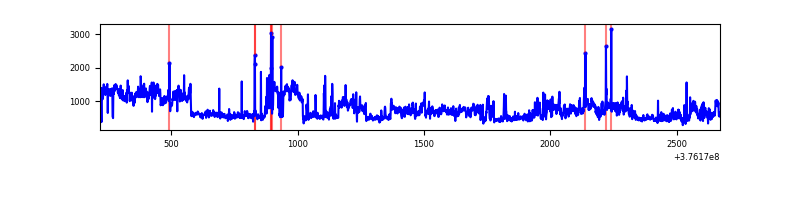 |
Top three noisy pixels from each quadrant. If the there are fewer than three noisy pixels in the level2.evt file, extra rows are filled as -1
| Pixel properties | Quadrant properties | ||||||
|---|---|---|---|---|---|---|---|
| Quadrant | DetID | PixID | Counts | Sigma | Mean | Median | Sigma |
| A | 15 | 47 | 157386 | 2903.7 | 263 | 258 | 54.1 |
| A | 13 | 254 | 4338 | 75.4 | 263 | 258 | 54.1 |
| A | 13 | 6 | 4254 | 73.85 | 263 | 258 | 54.1 |
| B | 5 | 172 | 283581 | 5487.25 | 263 | 256 | 51.6 |
| B | 5 | 255 | 57715 | 1112.83 | 263 | 256 | 51.6 |
| B | 0 | 213 | 34131 | 656.07 | 263 | 256 | 51.6 |
| C | 15 | 214 | 104258 | 1676.35 | 263 | 265 | 62.0 |
| C | 10 | 49 | 34269 | 548.14 | 263 | 265 | 62.0 |
| C | 9 | 187 | 25009 | 398.87 | 263 | 265 | 62.0 |
| D | 8 | 195 | 800916 | 12256.34 | 258 | 249 | 65.3 |
| D | 13 | 249 | 27748 | 420.95 | 258 | 249 | 65.3 |
| D | 12 | 6 | 26233 | 397.75 | 258 | 249 | 65.3 |
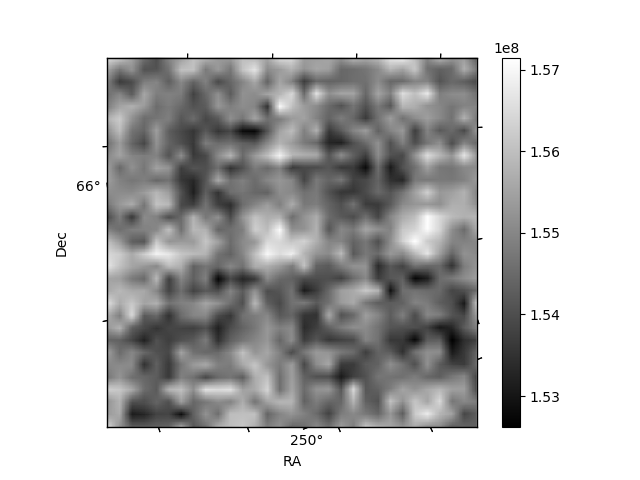
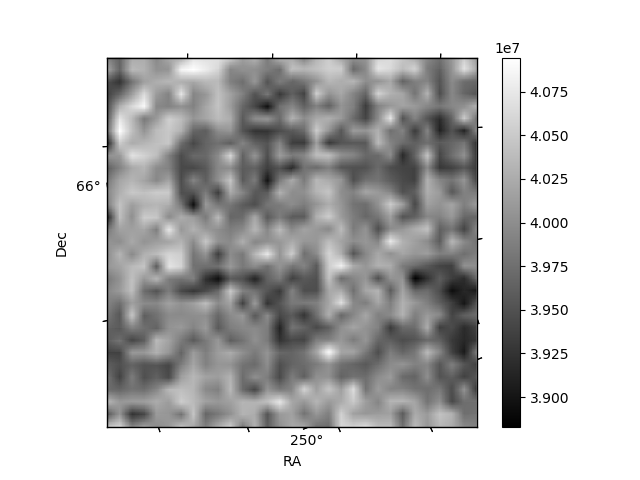
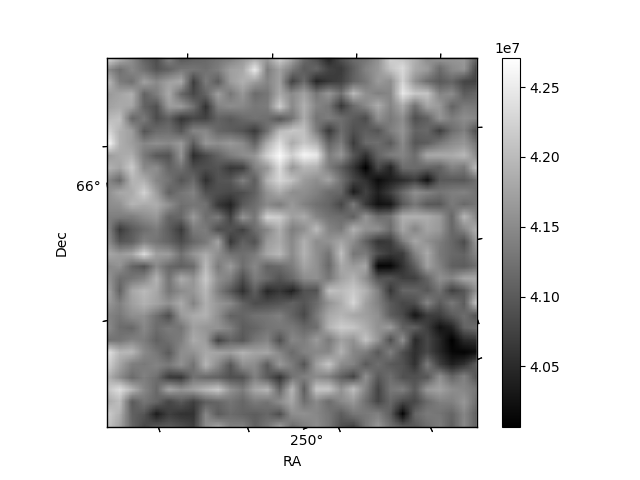
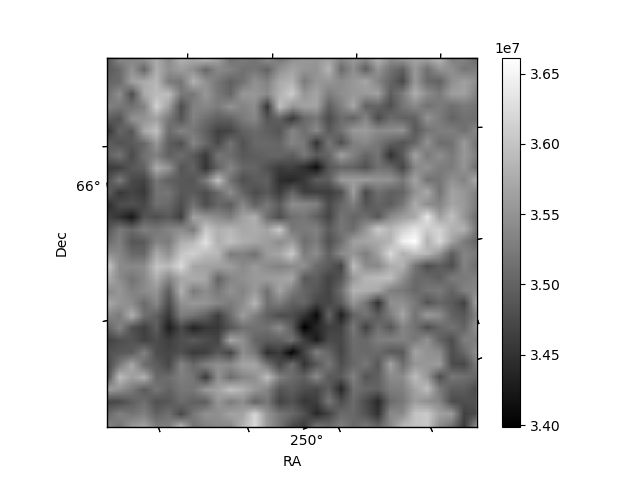
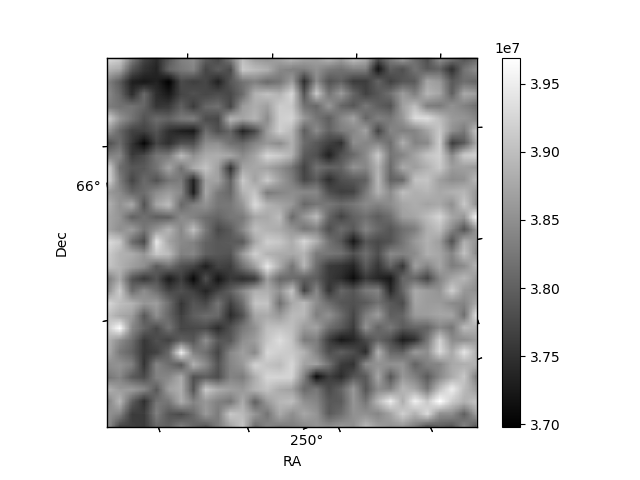
Histogram calculated using DETX and DETY for each event in the final _common_clean file
| Quadrant A | 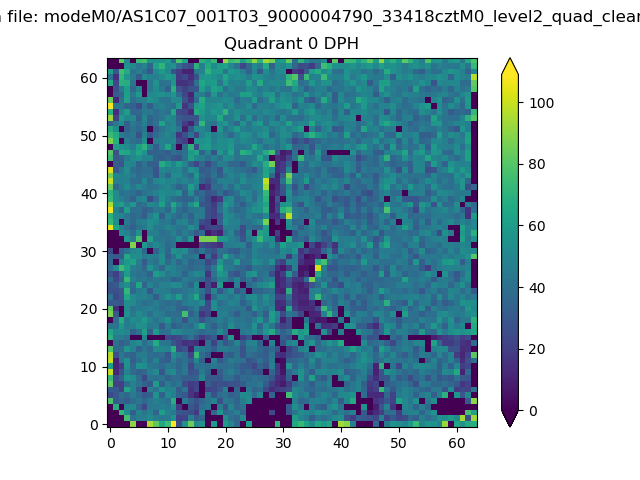 |
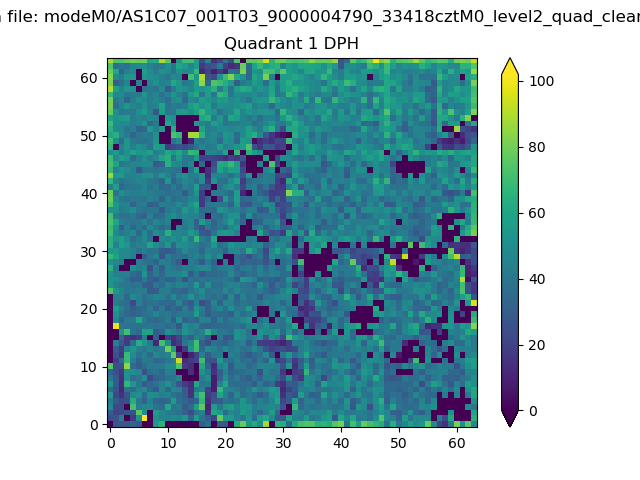 |
Quadrant B |
|---|---|---|---|
| Quadrant D |  |
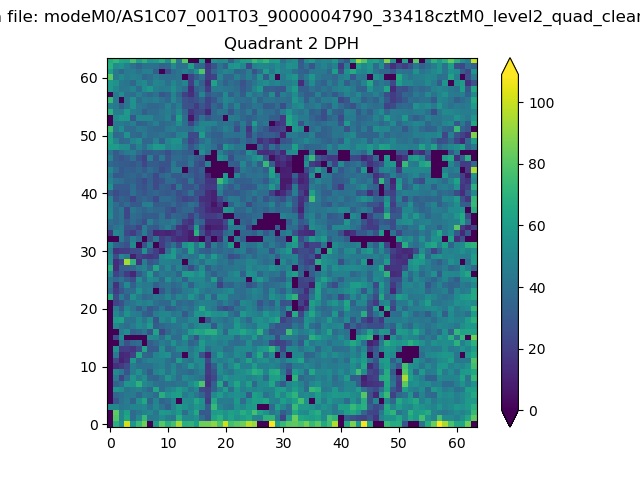 |
Quadrant C |
| Plot type | Count rate plots | Images |
|---|---|---|
| Comparison with Poisson distribution Blue bars denote a histogram of data divided into 1 sec bins. Red curve is a Poisson curve with rate = median count rate of data. |
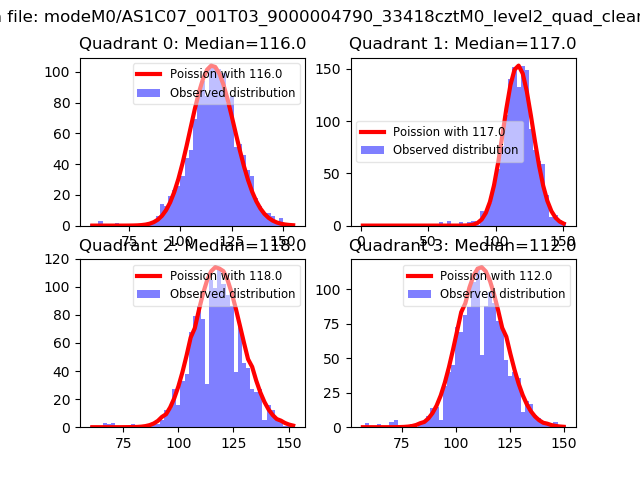 |
 |
| Quadrant-wise count rates Data is divided into 100 sec bins |
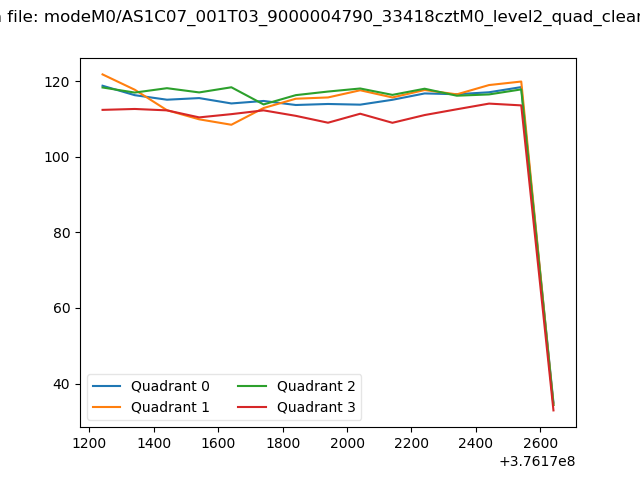 |
|
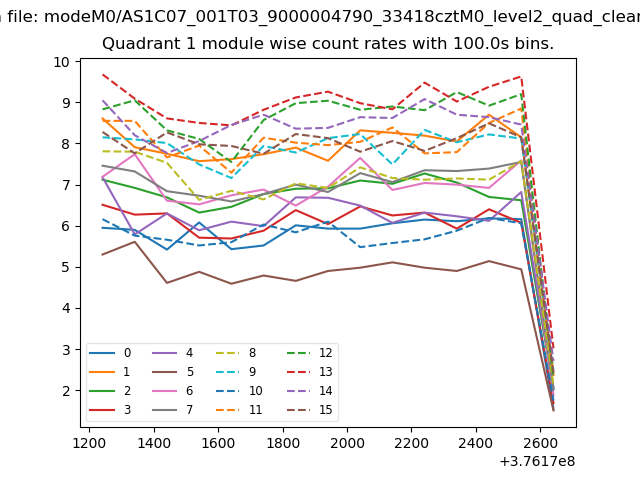
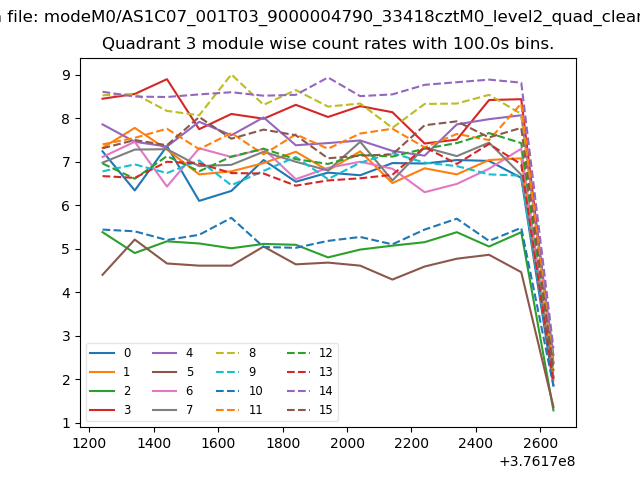
| Module-wise count rates for Quadrant A Data is divided into 100 sec bins |
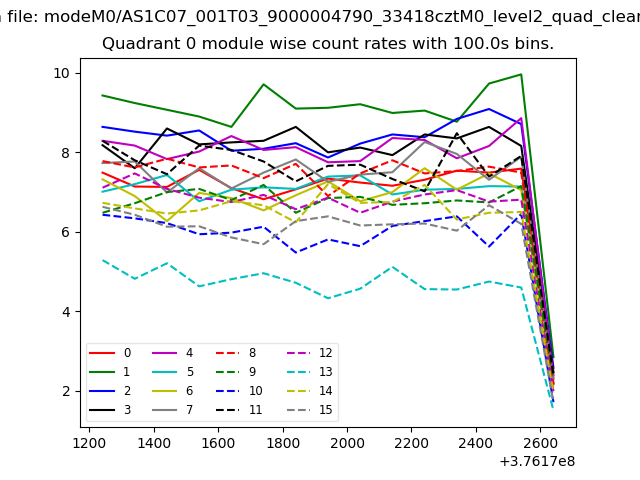 |
 |
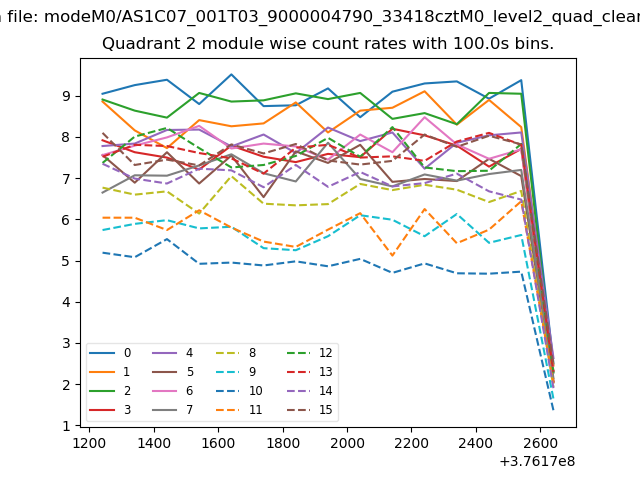
| Module-wise count rates for Quadrant B Data is divided into 100 sec bins |
 |
 |
| Module-wise count rates for Quadrant C Data is divided into 100 sec bins |
 |
 |
| Module-wise count rates for Quadrant D Data is divided into 100 sec bins |
 |
 |
| Parameter | Plot |
|---|---|
| CZT HV Monitor | 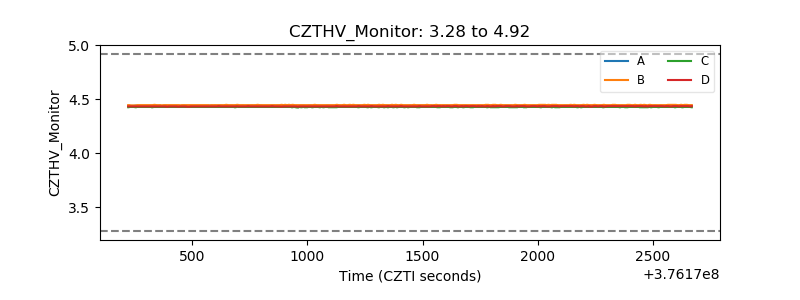 |
| D_VDD | 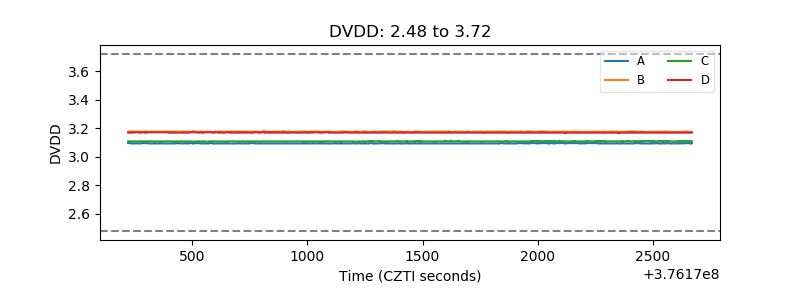 |
| Temperature 1 |  |
| Veto HV Monitor | 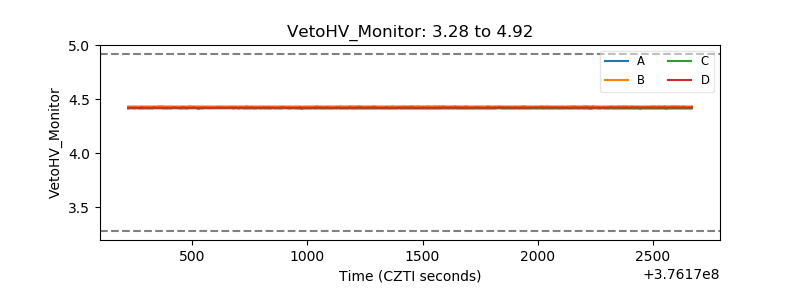 |
| Veto LLD | 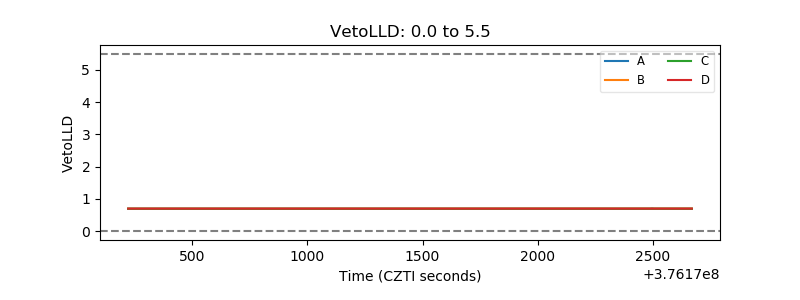 |
| Alpha Counter | 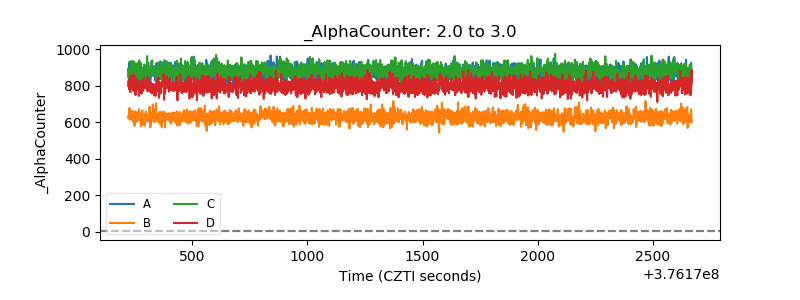 |
| _CPM_Rate | 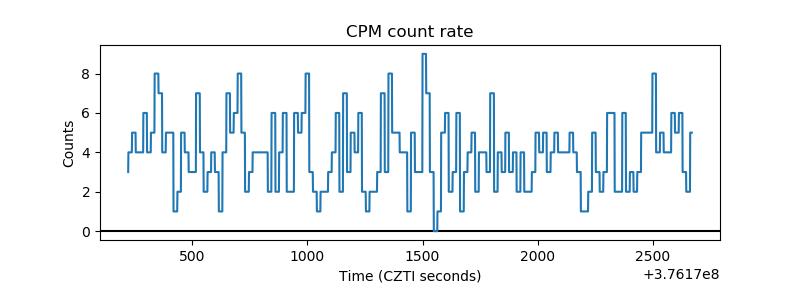 |
| CZT Counter | 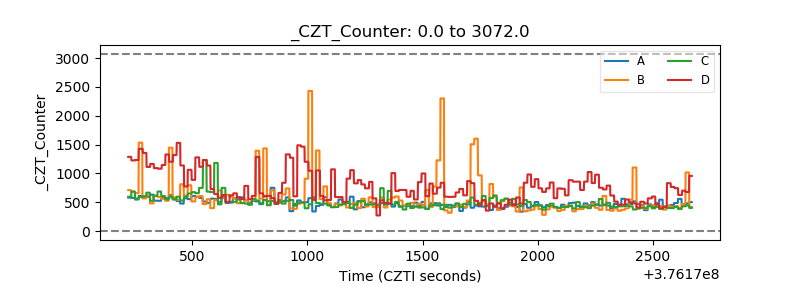 |
| +2.5 Volts monitor |  |
| +5 Volts monitor |  |
| _ROLL_ROT | 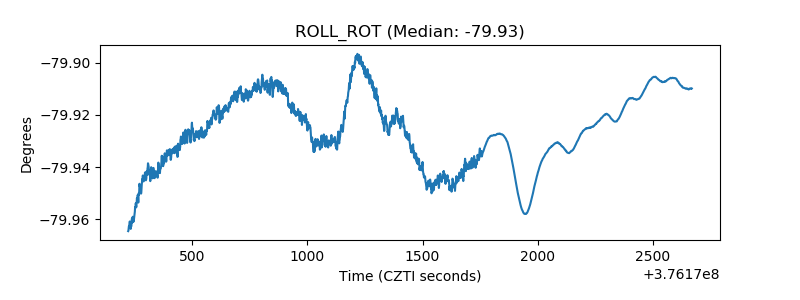 |
| _Roll_DEC | 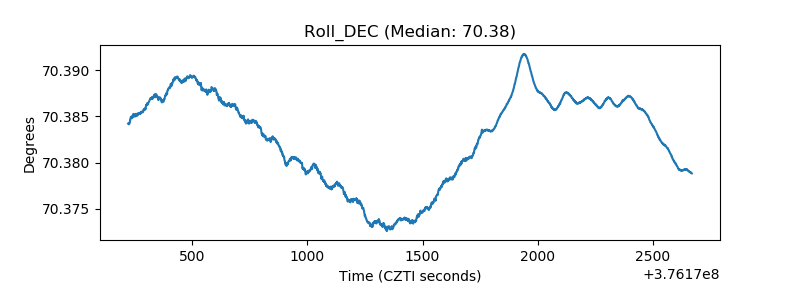 |
| _Roll_RA | 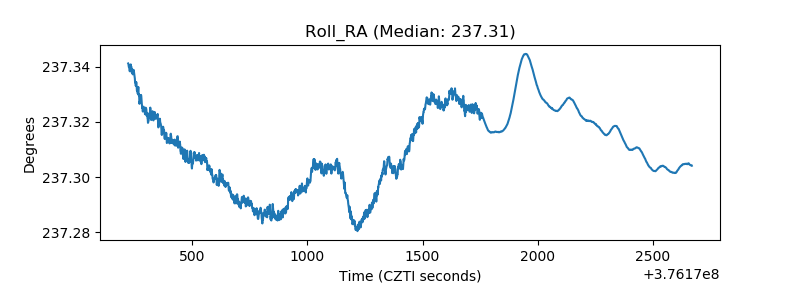 |
| Veto Counter | 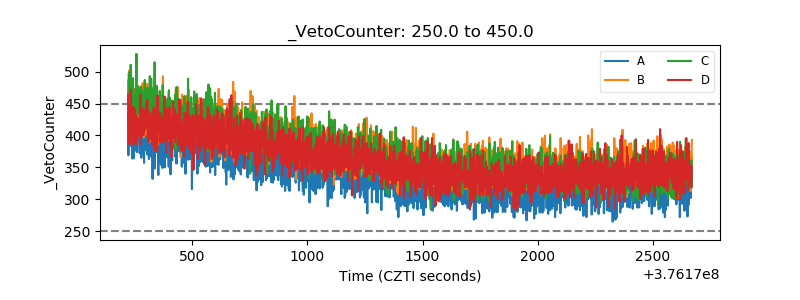 |