| Param | Original file | Final file |
|---|---|---|
| Filename | modeM0/AS1A11_046T04_9000004792cztM0_level2.fits | modeM0/AS1A11_046T04_9000004792cztM0_level2_quad_clean.evt |
| Size (bytes) | 692,354,880 | 882,616,320 |
| Size | 660.3 MB | 841.7 MB |
| Events in quadrant A | 4,309,356 | 5,867,592 |
| Events in quadrant B | 3,964,736 | 5,530,177 |
| Events in quadrant C | 4,150,458 | 5,518,516 |
| Events in quadrant D | 3,435,554 | 4,711,842 |
| Mode M0 | |||
|---|---|---|---|
| Quadrant | BADHDUFLAG | Total packets | Discarded packets |
| A | 0 | 154967 | 0 |
| B | 0 | 205904 | 0 |
| C | 0 | 161528 | 0 |
| D | 0 | 276229 | 0 |
| Mode M9 | |||
|---|---|---|---|
| Quadrant | BADHDUFLAG | Total packets | Discarded packets |
| A | 0 | 295 | 0 |
| B | 0 | 295 | 0 |
| C | 0 | 295 | 0 |
| D | 0 | 295 | 0 |
| Mode SS | |||
|---|---|---|---|
| Quadrant | BADHDUFLAG | Total packets | Discarded packets |
| A | 0 | 1522 | 0 |
| B | 0 | 1522 | 0 |
| C | 0 | 1522 | 0 |
| D | 0 | 1522 | 0 |
| Quadrant | Total seconds | Saturated seconds | Saturation percentage |
|---|---|---|---|
| A | 74438 | 79 | 0.106129% |
| B | 74438 | 4974 | 6.682071% |
| C | 74438 | 590 | 0.792606% |
| D | 74438 | 5803 | 7.795749% |
Noise dominated data is calculated using 1-second bins in cleaned event files. If a bin has >2000 counts, and if more than 50% of those come from <1% of pixels, then it is considered to be noise-dominated and hence unusable.
| Quadrant | # 1 sec bins | Bins with >0 counts | Bins with >2000 counts | High rate bins dominated by noise | Noise dominated (total time) | Noise dominated (detector-on time) | Marked lightcurve |
|---|---|---|---|---|---|---|---|
| A | 103923 | 74438 | 0 | 0 | 0.00% | 0.00% |  |
| B | 103923 | 74370 | 0 | 0 | 0.00% | 0.00% |  |
| C | 103923 | 74434 | 0 | 0 | 0.00% | 0.00% |  |
| D | 103923 | 74397 | 0 | 0 | 0.00% | 0.00% |  |
Top three noisy pixels from each quadrant. If the there are fewer than three noisy pixels in the level2.evt file, extra rows are filled as -1
| Pixel properties | Quadrant properties | ||||||
|---|---|---|---|---|---|---|---|
| Quadrant | DetID | PixID | Counts | Sigma | Mean | Median | Sigma |
| A | 9 | 19 | 3582 | 9.07 | 1125 | 1064 | 277.5 |
| A | 0 | 29 | 3545 | 8.94 | 1125 | 1064 | 277.5 |
| A | 7 | 110 | 3537 | 8.91 | 1125 | 1064 | 277.5 |
| B | 2 | 9 | 3411 | 11.58 | 1054 | 1011 | 207.3 |
| B | 3 | 80 | 3098 | 10.07 | 1054 | 1011 | 207.3 |
| B | 2 | 8 | 2769 | 8.48 | 1054 | 1011 | 207.3 |
| C | 3 | 202 | 3225 | 7.86 | 1098 | 1032 | 279.0 |
| C | 3 | 203 | 3176 | 7.68 | 1098 | 1032 | 279.0 |
| C | 3 | 187 | 2791 | 6.3 | 1098 | 1032 | 279.0 |
| D | 4 | 160 | 2500 | 6.06 | 984 | 899 | 264.2 |
| D | 6 | 38 | 2484 | 6.0 | 984 | 899 | 264.2 |
| D | 6 | 231 | 2481 | 5.99 | 984 | 899 | 264.2 |
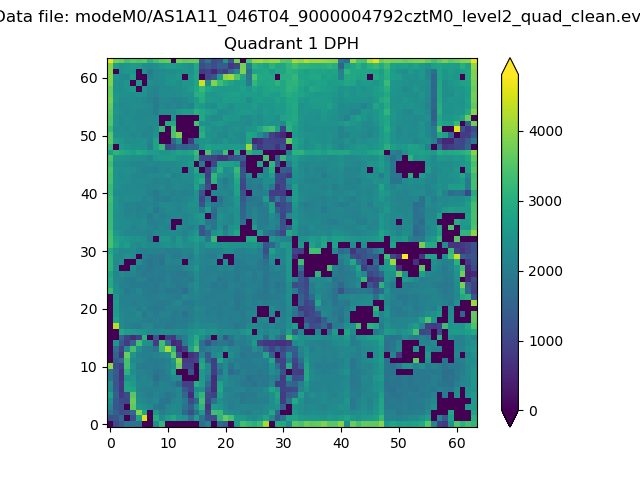
Histogram calculated using DETX and DETY for each event in the final _common_clean file
| Quadrant A |  |
 |
Quadrant B |
|---|---|---|---|
| Quadrant D |  |
 |
Quadrant C |
| Plot type | Count rate plots | Images |
|---|---|---|
| Comparison with Poisson distribution Blue bars denote a histogram of data divided into 1 sec bins. Red curve is a Poisson curve with rate = median count rate of data. |
 |
 |
| Quadrant-wise count rates Data is divided into 100 sec bins |
 |
|
| Module-wise count rates for Quadrant A Data is divided into 100 sec bins |
 |
 |
| Module-wise count rates for Quadrant B Data is divided into 100 sec bins |
 |
 |
| Module-wise count rates for Quadrant C Data is divided into 100 sec bins |
 |
 |
| Module-wise count rates for Quadrant D Data is divided into 100 sec bins |
 |
 |
| Parameter | Plot |
|---|---|
| CZT HV Monitor |  |
| D_VDD |  |
| Temperature 1 |  |
| Veto HV Monitor |  |
| Veto LLD |  |
| Alpha Counter |  |
| _CPM_Rate |  |
| CZT Counter |  |
| +2.5 Volts monitor |  |
| +5 Volts monitor |  |
| _ROLL_ROT |  |
| _Roll_DEC |  |
| _Roll_RA |  |
| Veto Counter |  |