| Param | Original file | Final file |
|---|---|---|
| Filename | modeM0/AS1A11_046T04_9000004792_33421cztM0_level2.evt | modeM0/AS1A11_046T04_9000004792_33421cztM0_level2_quad_clean.evt |
| Size (bytes) | 472,622,400 | 101,111,040 |
| Size | 450.7 MB | 96.4 MB |
| Events in quadrant A | 2,807,215 | 687,487 |
| Events in quadrant B | 4,097,140 | 669,502 |
| Events in quadrant C | 3,173,192 | 679,158 |
| Events in quadrant D | 3,864,841 | 643,317 |
| Mode M0 | |||
|---|---|---|---|
| Quadrant | BADHDUFLAG | Total packets | Discarded packets |
| A | 0 | 11479 | 3 |
| B | 0 | 15842 | 2 |
| C | 0 | 12733 | 2 |
| D | 0 | 15127 | 2 |
| Mode M9 | |||
|---|---|---|---|
| Quadrant | BADHDUFLAG | Total packets | Discarded packets |
| A | 0 | 27 | 0 |
| B | 0 | 27 | 0 |
| C | 0 | 27 | 0 |
| D | 0 | 28 | 0 |
| Mode SS | |||
|---|---|---|---|
| Quadrant | BADHDUFLAG | Total packets | Discarded packets |
| A | 0 | 112 | 0 |
| B | 0 | 112 | 0 |
| C | 0 | 112 | 0 |
| D | 0 | 112 | 0 |
| Quadrant | Total seconds | Saturated seconds | Saturation percentage |
|---|---|---|---|
| A | 5462 | 10 | 0.183083% |
| B | 5462 | 569 | 10.417430% |
| C | 5462 | 99 | 1.812523% |
| D | 5462 | 168 | 3.075796% |
Noise dominated data is calculated using 1-second bins in cleaned event files. If a bin has >2000 counts, and if more than 50% of those come from <1% of pixels, then it is considered to be noise-dominated and hence unusable.
| Quadrant | # 1 sec bins | Bins with >0 counts | Bins with >2000 counts | High rate bins dominated by noise | Noise dominated (total time) | Noise dominated (detector-on time) | Marked lightcurve |
|---|---|---|---|---|---|---|---|
| A | 7315 | 5463 | 0 | 0 | 0.00% | 0.00% | 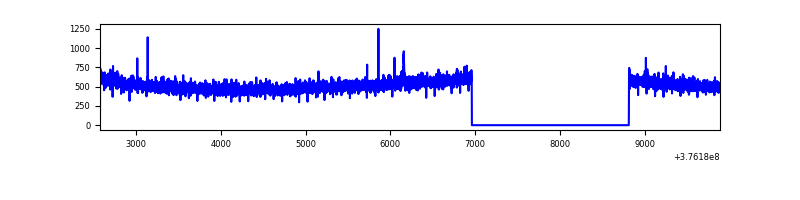 |
| B | 7315 | 5463 | 449 | 449 | 6.14% | 8.22% | 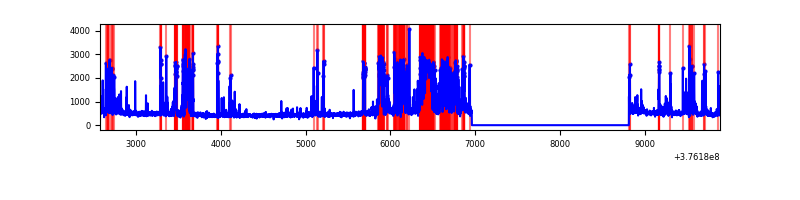 |
| C | 7315 | 5463 | 91 | 91 | 1.24% | 1.67% | 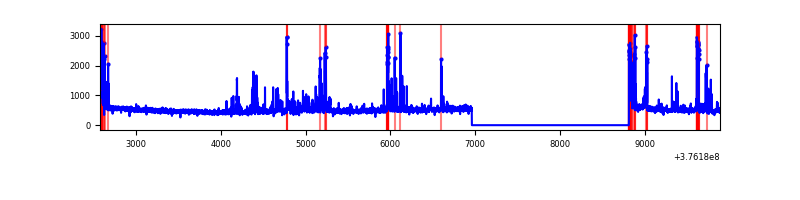 |
| D | 7315 | 5463 | 164 | 164 | 2.24% | 3.00% | 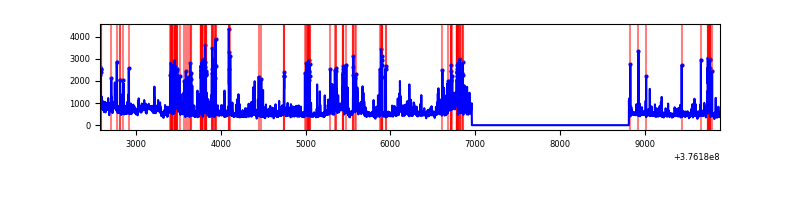 |
Top three noisy pixels from each quadrant. If the there are fewer than three noisy pixels in the level2.evt file, extra rows are filled as -1
| Pixel properties | Quadrant properties | ||||||
|---|---|---|---|---|---|---|---|
| Quadrant | DetID | PixID | Counts | Sigma | Mean | Median | Sigma |
| A | 15 | 47 | 354444 | 2834.19 | 630 | 619 | 124.8 |
| A | 13 | 254 | 9640 | 72.26 | 630 | 619 | 124.8 |
| A | 15 | 174 | 7579 | 55.75 | 630 | 619 | 124.8 |
| B | 5 | 172 | 1469396 | 12849.23 | 604 | 589 | 114.3 |
| B | 5 | 255 | 86227 | 749.17 | 604 | 589 | 114.3 |
| B | 0 | 189 | 38343 | 330.27 | 604 | 589 | 114.3 |
| C | 15 | 214 | 234877 | 1682.9 | 609 | 614 | 139.2 |
| C | 3 | 233 | 198763 | 1423.46 | 609 | 614 | 139.2 |
| C | 14 | 254 | 161633 | 1156.73 | 609 | 614 | 139.2 |
| D | 8 | 195 | 580669 | 4013.75 | 599 | 583 | 144.5 |
| D | 13 | 249 | 350438 | 2420.73 | 599 | 583 | 144.5 |
| D | 2 | 250 | 280728 | 1938.39 | 599 | 583 | 144.5 |
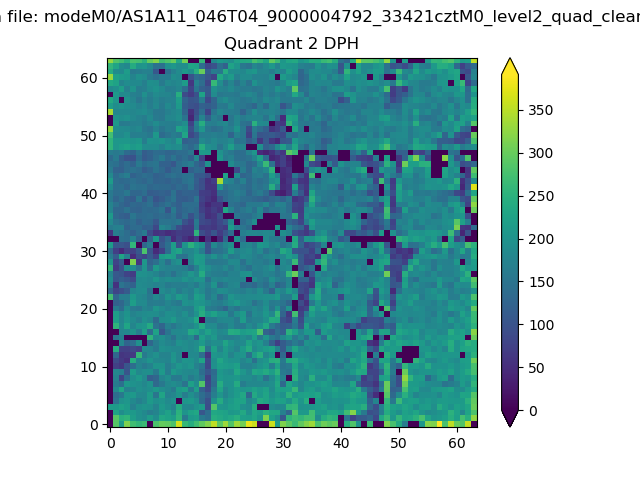
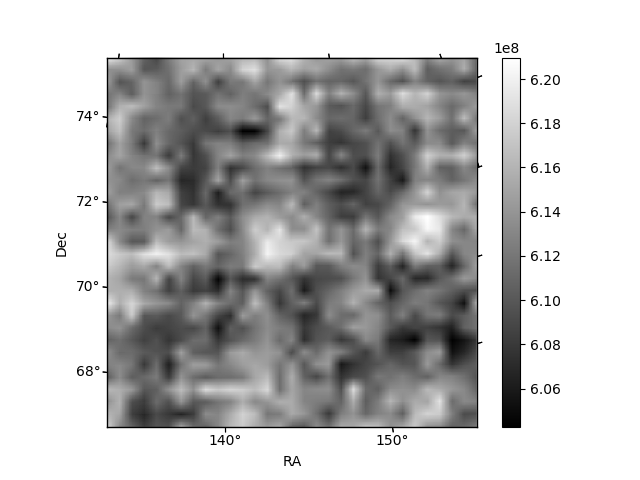
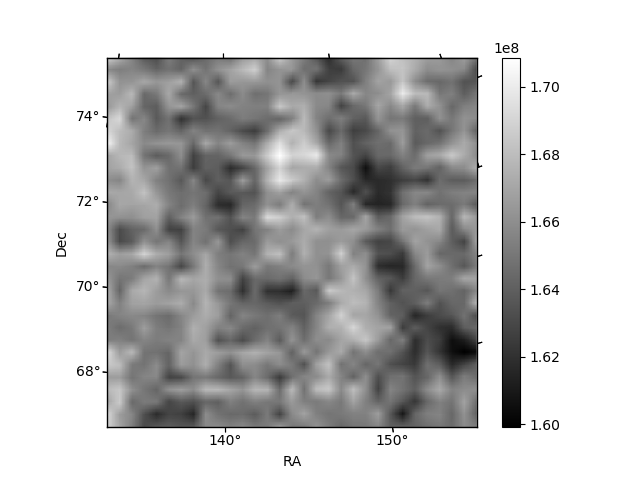
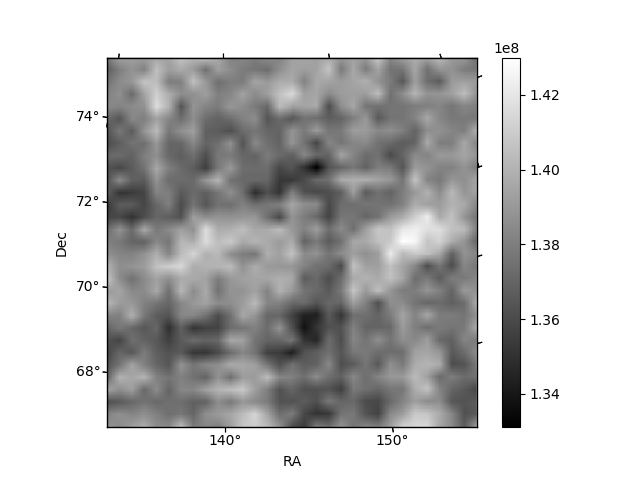
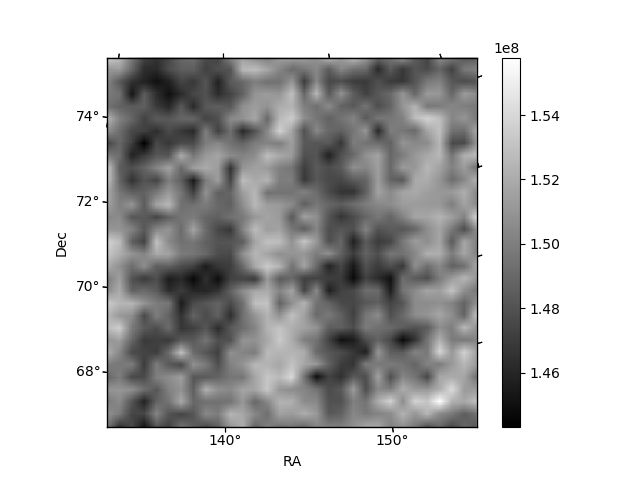
Histogram calculated using DETX and DETY for each event in the final _common_clean file
| Quadrant A | 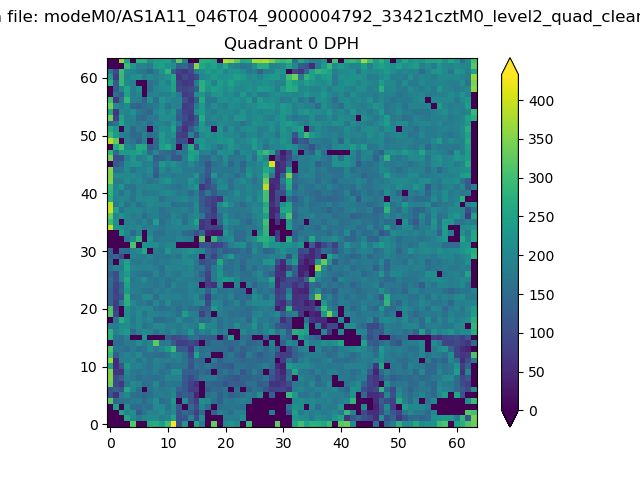 |
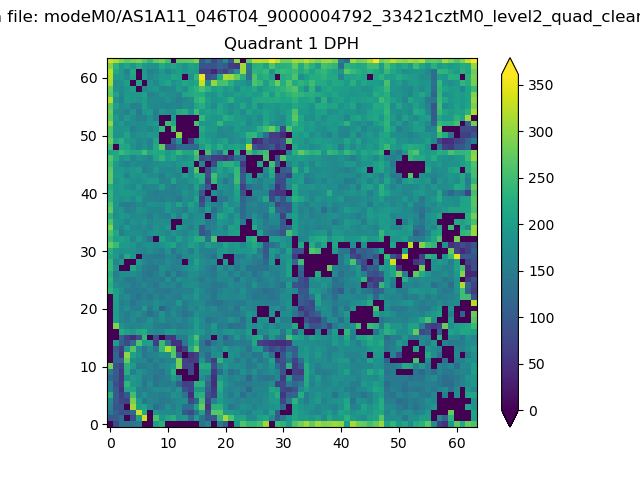 |
Quadrant B |
|---|---|---|---|
| Quadrant D | 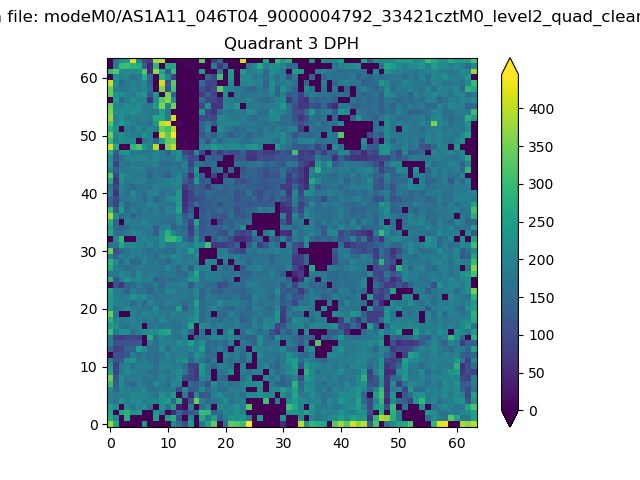 |
 |
Quadrant C |
| Plot type | Count rate plots | Images |
|---|---|---|
| Comparison with Poisson distribution Blue bars denote a histogram of data divided into 1 sec bins. Red curve is a Poisson curve with rate = median count rate of data. |
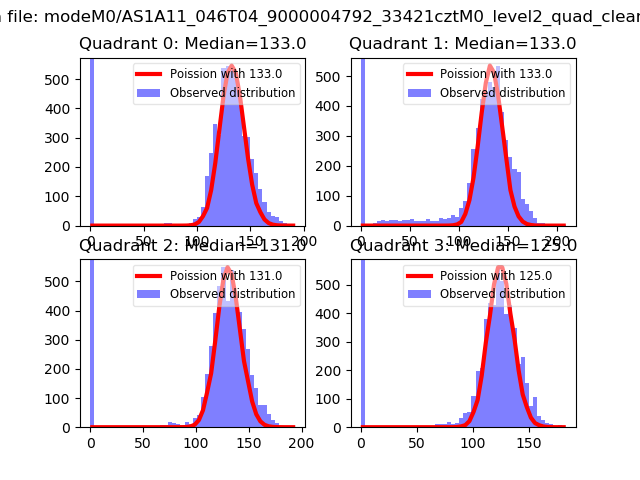 |
 |
| Quadrant-wise count rates Data is divided into 100 sec bins |
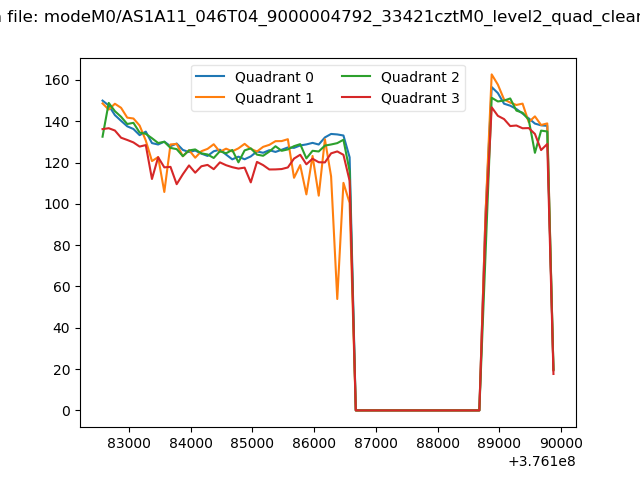 |
|
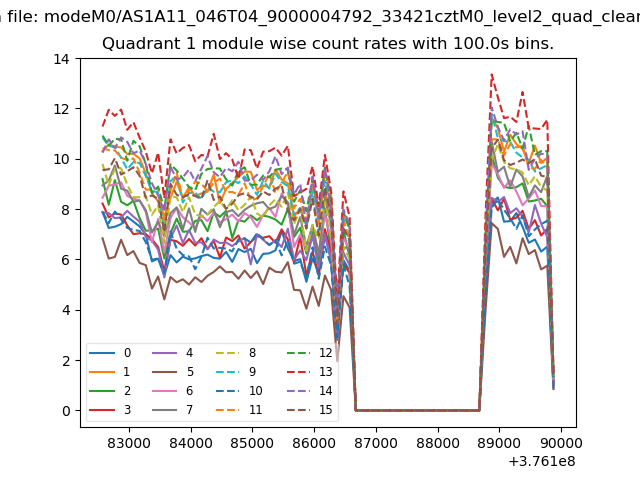
| Module-wise count rates for Quadrant A Data is divided into 100 sec bins |
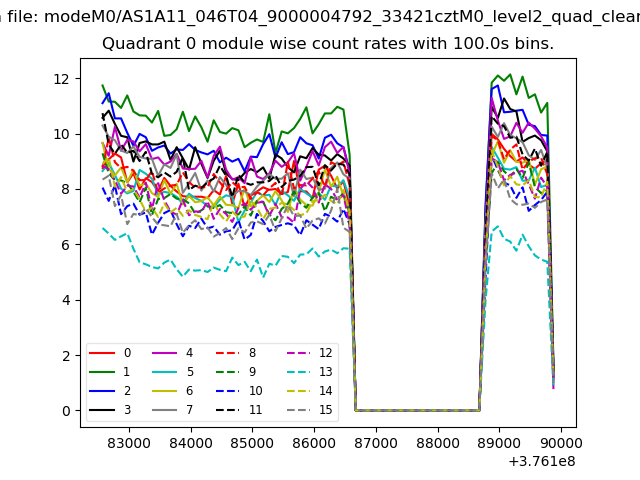 |
 |
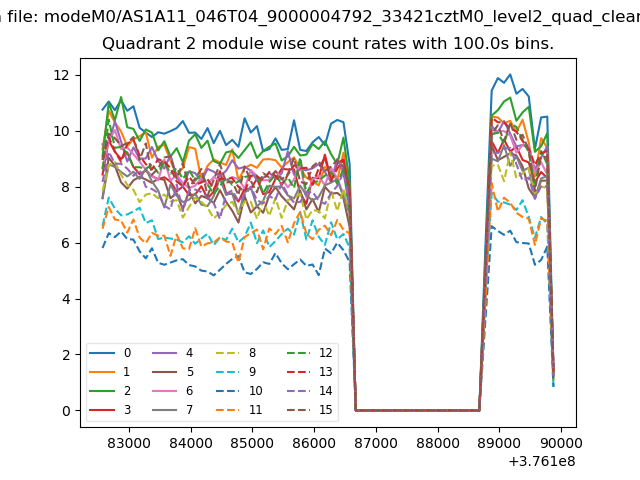
| Module-wise count rates for Quadrant B Data is divided into 100 sec bins |
 |
 |
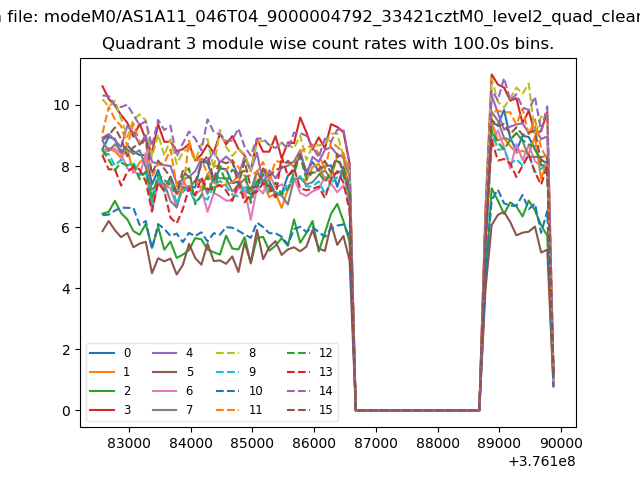
| Module-wise count rates for Quadrant C Data is divided into 100 sec bins |
 |
 |
| Module-wise count rates for Quadrant D Data is divided into 100 sec bins |
 |
 |
| Parameter | Plot |
|---|---|
| CZT HV Monitor | 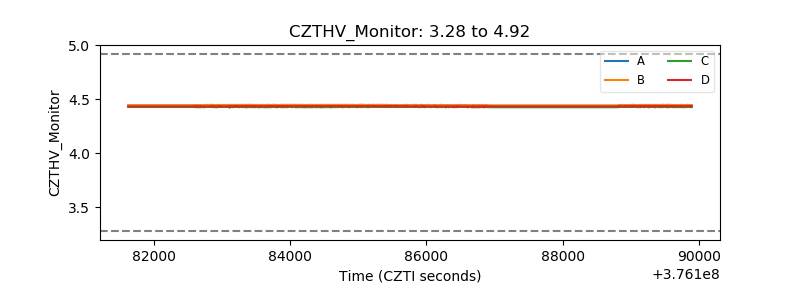 |
| D_VDD | 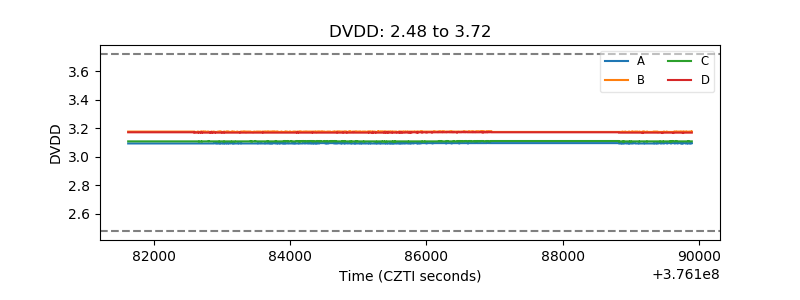 |
| Temperature 1 | 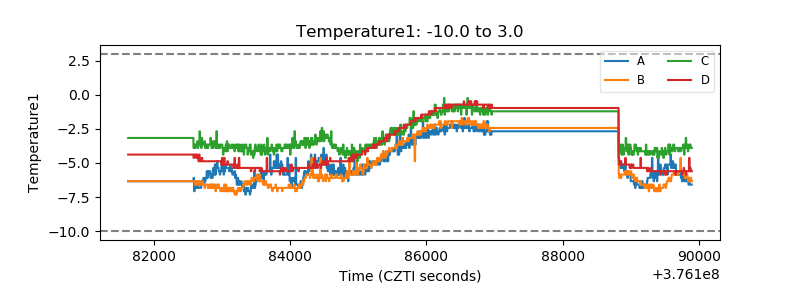 |
| Veto HV Monitor | 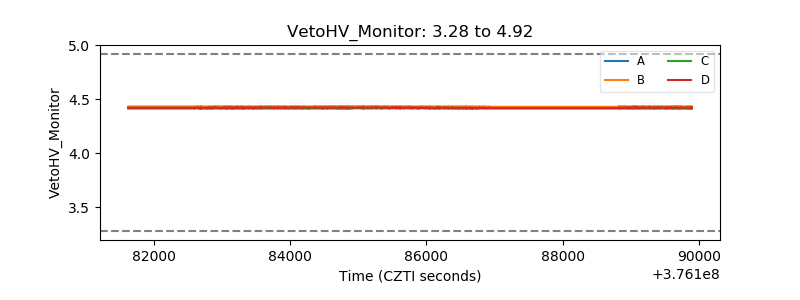 |
| Veto LLD | 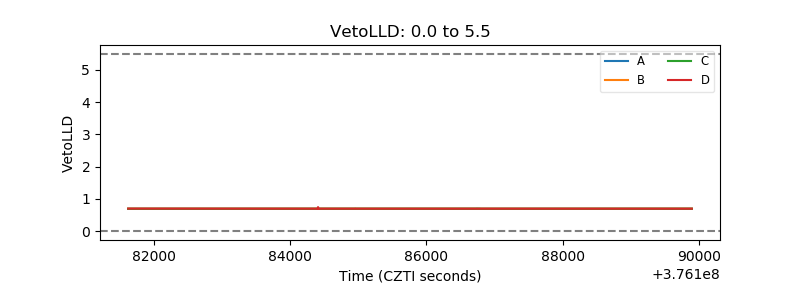 |
| Alpha Counter | 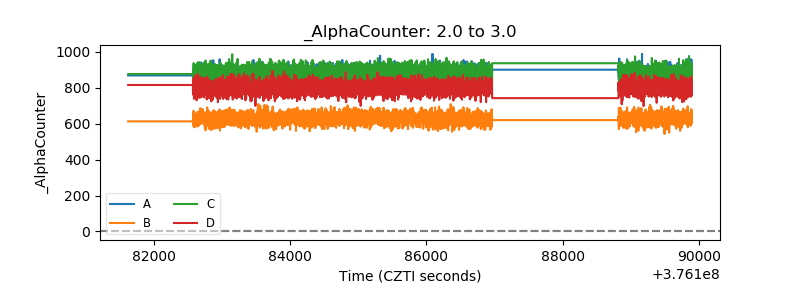 |
| _CPM_Rate | 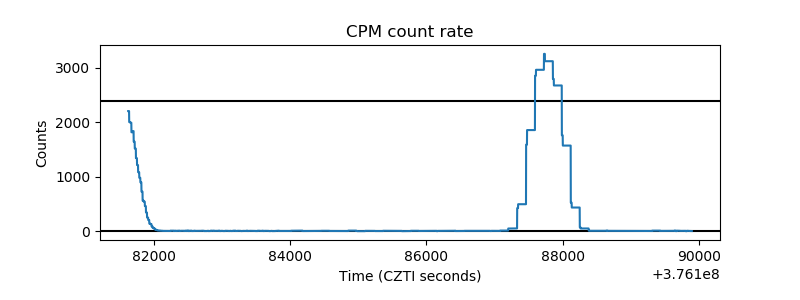 |
| CZT Counter |  |
| +2.5 Volts monitor |  |
| +5 Volts monitor | 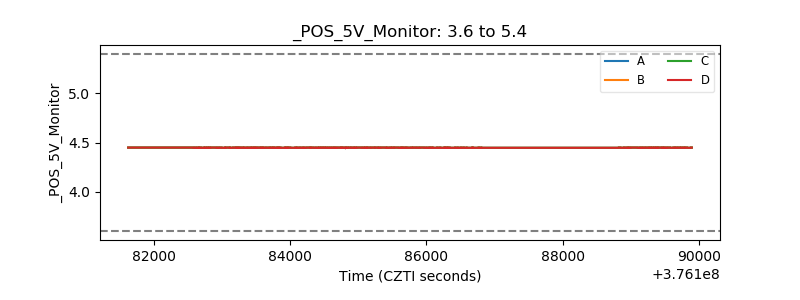 |
| _ROLL_ROT | 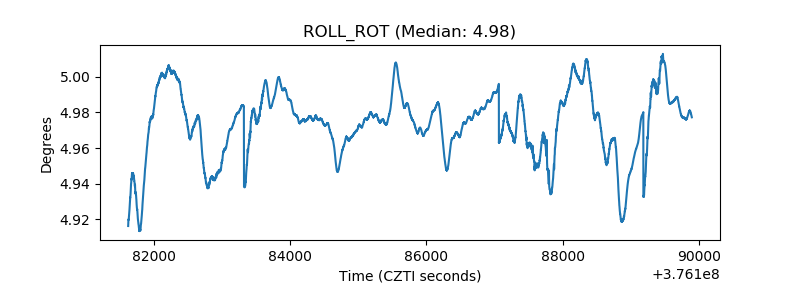 |
| _Roll_DEC | 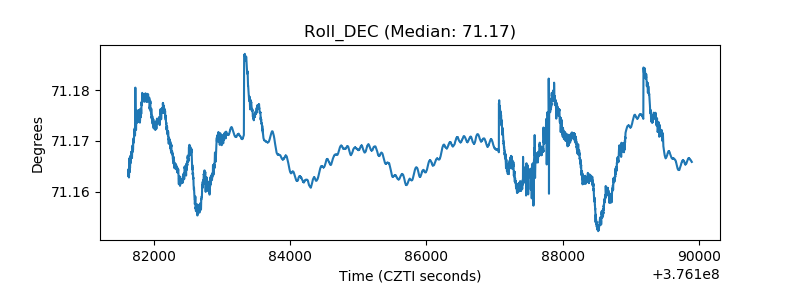 |
| _Roll_RA |  |
| Veto Counter | 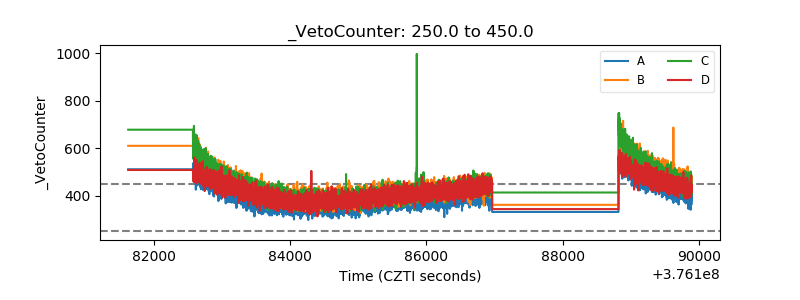 |