| Param | Original file | Final file |
|---|---|---|
| Filename | modeM0/AS1A11_046T04_9000004792_33424cztM0_level2.evt | modeM0/AS1A11_046T04_9000004792_33424cztM0_level2_quad_clean.evt |
| Size (bytes) | 421,194,240 | 82,572,480 |
| Size | 401.7 MB | 78.7 MB |
| Events in quadrant A | 2,498,413 | 574,138 |
| Events in quadrant B | 3,206,251 | 554,159 |
| Events in quadrant C | 2,400,918 | 553,390 |
| Events in quadrant D | 4,338,133 | 495,718 |
| Mode M0 | |||
|---|---|---|---|
| Quadrant | BADHDUFLAG | Total packets | Discarded packets |
| A | 0 | 10300 | 431 |
| B | 0 | 13243 | 798 |
| C | 0 | 10158 | 418 |
| D | 0 | 17385 | 1284 |
| Mode M9 | |||
|---|---|---|---|
| Quadrant | BADHDUFLAG | Total packets | Discarded packets |
| A | 0 | 31 | 0 |
| B | 0 | 31 | 1 |
| C | 0 | 31 | 0 |
| D | 0 | 32 | 0 |
| Mode SS | |||
|---|---|---|---|
| Quadrant | BADHDUFLAG | Total packets | Discarded packets |
| A | 0 | 98 | 6 |
| B | 0 | 98 | 4 |
| C | 0 | 98 | 4 |
| D | 0 | 98 | 0 |
| Quadrant | Total seconds | Saturated seconds | Saturation percentage |
|---|---|---|---|
| A | 4636 | 5 | 0.107852% |
| B | 4578 | 266 | 5.810398% |
| C | 4636 | 17 | 0.366695% |
| D | 4524 | 292 | 6.454465% |
Noise dominated data is calculated using 1-second bins in cleaned event files. If a bin has >2000 counts, and if more than 50% of those come from <1% of pixels, then it is considered to be noise-dominated and hence unusable.
| Quadrant | # 1 sec bins | Bins with >0 counts | Bins with >2000 counts | High rate bins dominated by noise | Noise dominated (total time) | Noise dominated (detector-on time) | Marked lightcurve |
|---|---|---|---|---|---|---|---|
| A | 6999 | 4743 | 0 | 0 | 0.00% | 0.00% |  |
| B | 6999 | 4703 | 208 | 208 | 2.97% | 4.42% |  |
| C | 6999 | 4747 | 19 | 19 | 0.27% | 0.40% | 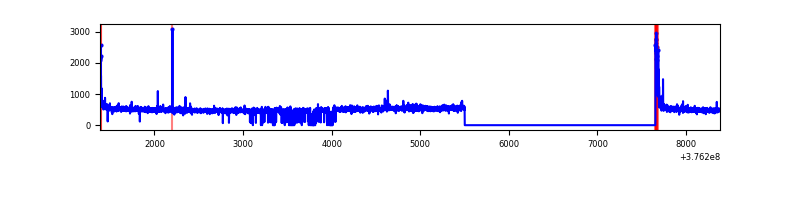 |
| D | 6999 | 4660 | 268 | 268 | 3.83% | 5.75% |  |
Top three noisy pixels from each quadrant. If the there are fewer than three noisy pixels in the level2.evt file, extra rows are filled as -1
| Pixel properties | Quadrant properties | ||||||
|---|---|---|---|---|---|---|---|
| Quadrant | DetID | PixID | Counts | Sigma | Mean | Median | Sigma |
| A | 15 | 47 | 314193 | 2846.97 | 562 | 552 | 110.2 |
| A | 13 | 254 | 8563 | 72.72 | 562 | 552 | 110.2 |
| A | 13 | 6 | 8178 | 69.22 | 562 | 552 | 110.2 |
| B | 5 | 172 | 799592 | 7965.37 | 537 | 523 | 100.3 |
| B | 5 | 255 | 178963 | 1778.75 | 537 | 523 | 100.3 |
| B | 0 | 213 | 37900 | 372.59 | 537 | 523 | 100.3 |
| C | 15 | 214 | 206348 | 1696.99 | 530 | 533 | 121.3 |
| C | 0 | 10 | 91762 | 752.21 | 530 | 533 | 121.3 |
| C | 14 | 254 | 10603 | 83.03 | 530 | 533 | 121.3 |
| D | 8 | 195 | 1104184 | 9019.46 | 508 | 494 | 122.4 |
| D | 2 | 250 | 538844 | 4399.45 | 508 | 494 | 122.4 |
| D | 1 | 52 | 301162 | 2457.09 | 508 | 494 | 122.4 |
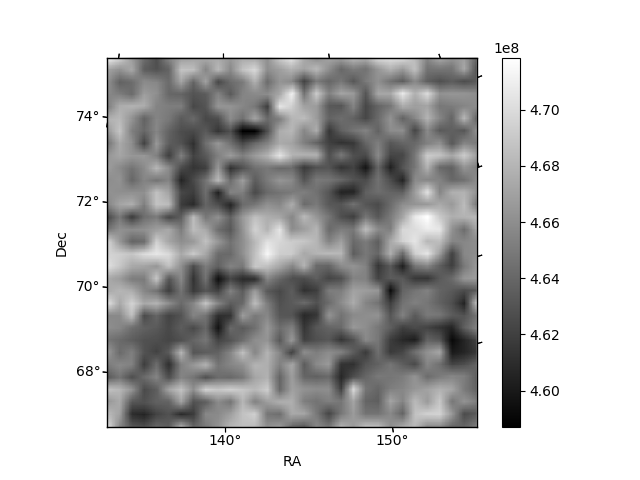
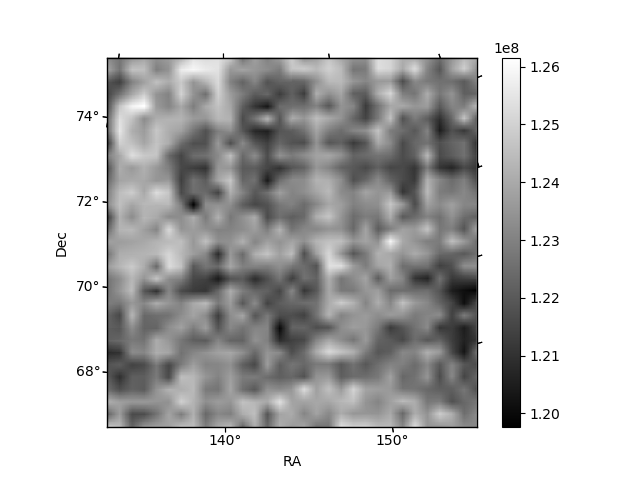
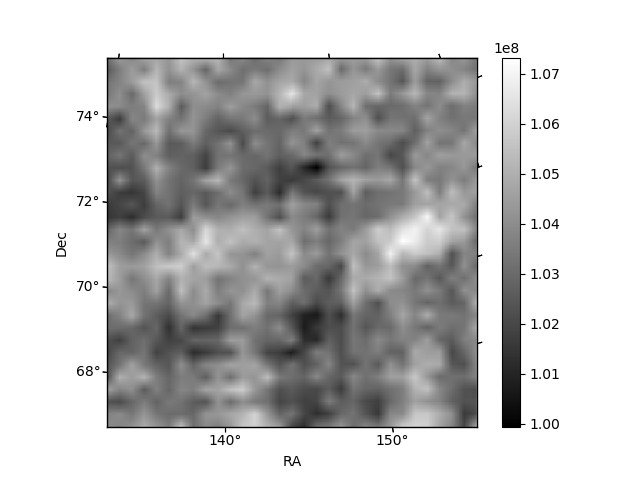
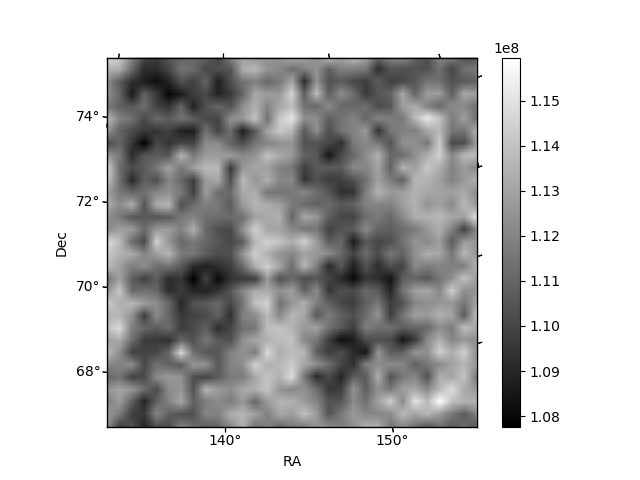
Histogram calculated using DETX and DETY for each event in the final _common_clean file
| Quadrant A | 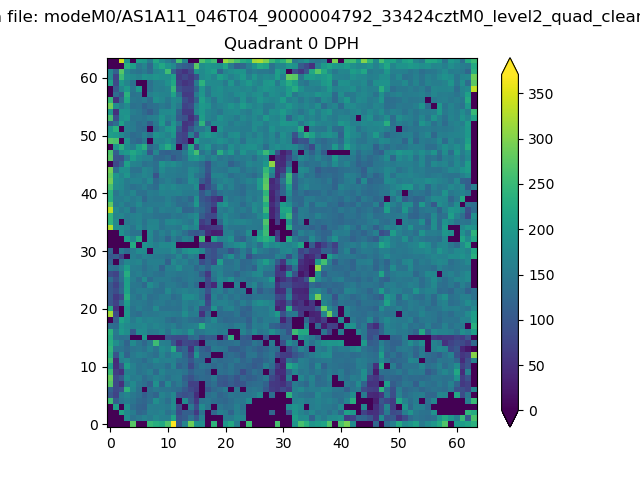 |
 |
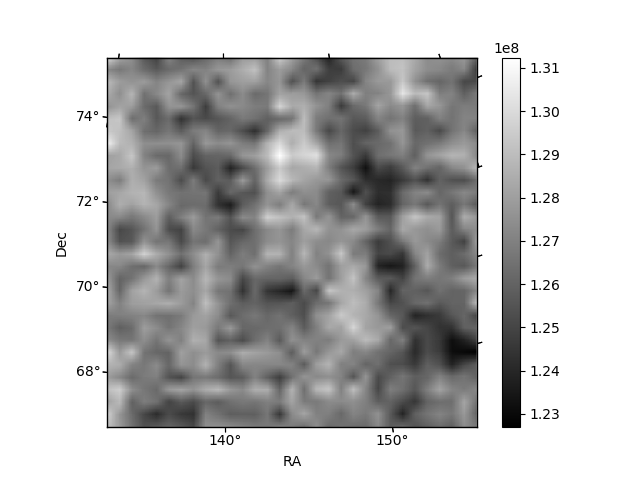
Quadrant B |
|---|---|---|---|
| Quadrant D | 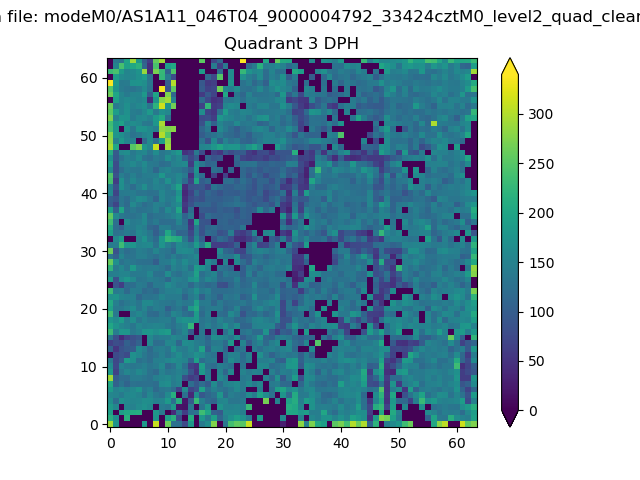 |
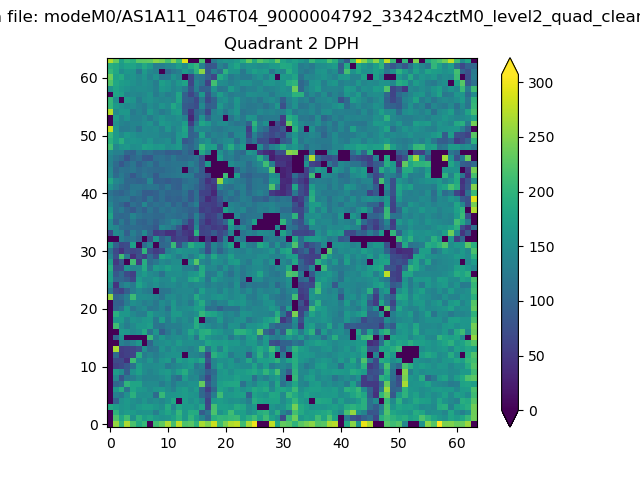 |
Quadrant C |
| Plot type | Count rate plots | Images |
|---|---|---|
| Comparison with Poisson distribution Blue bars denote a histogram of data divided into 1 sec bins. Red curve is a Poisson curve with rate = median count rate of data. |
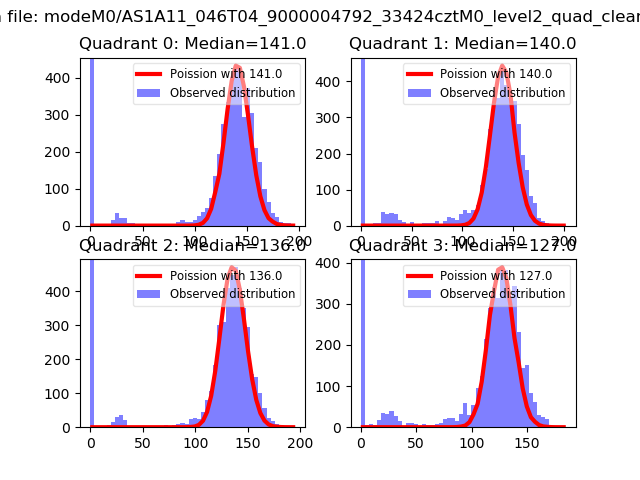 |
 |
| Quadrant-wise count rates Data is divided into 100 sec bins |
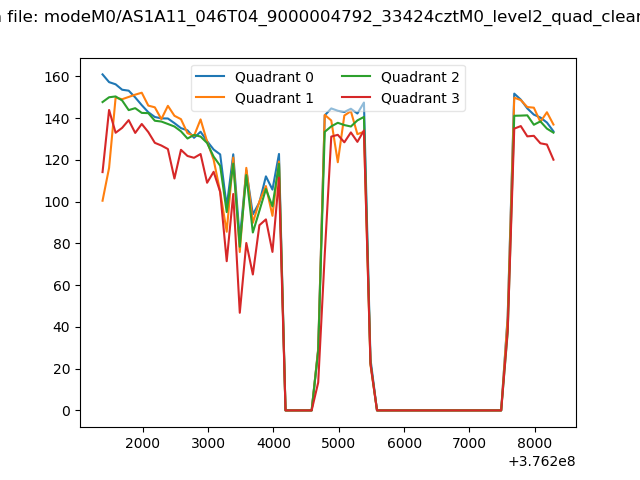 |
|
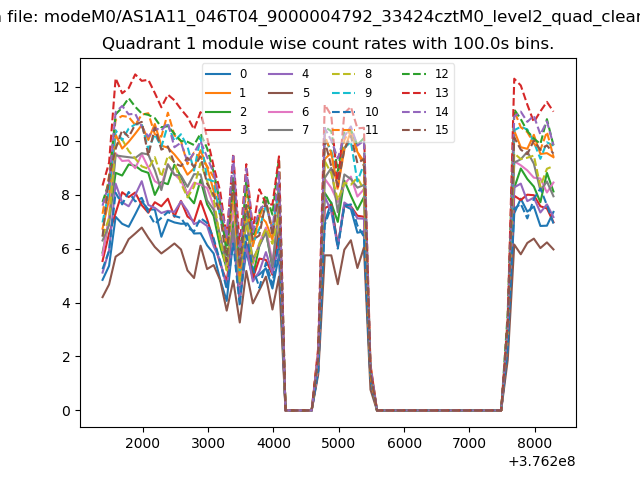
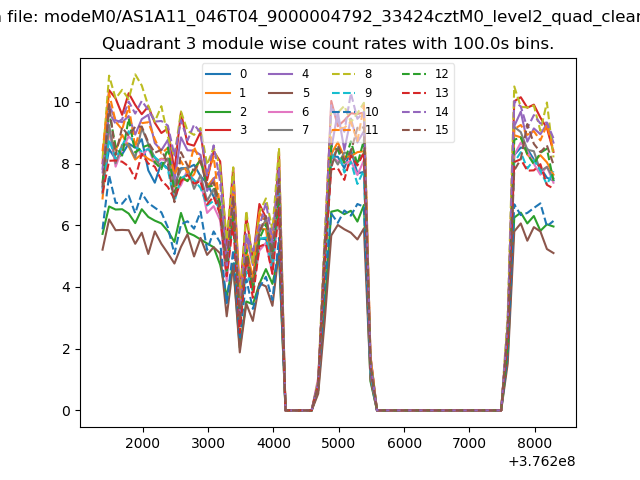
| Module-wise count rates for Quadrant A Data is divided into 100 sec bins |
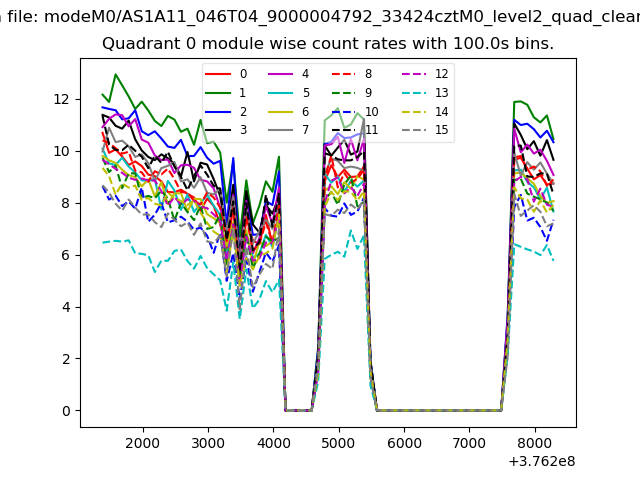 |
 |
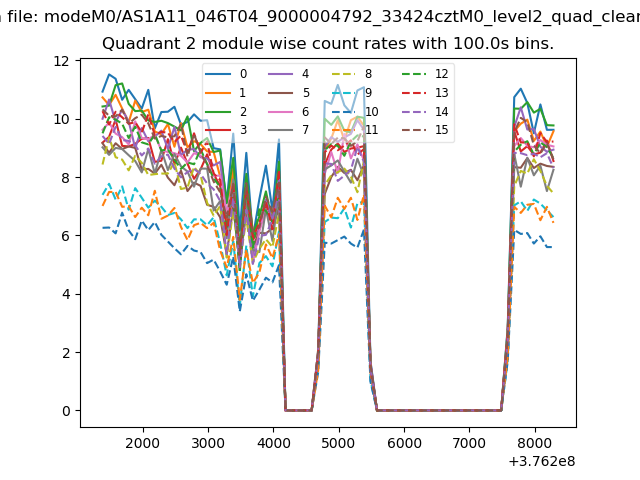
| Module-wise count rates for Quadrant B Data is divided into 100 sec bins |
 |
 |
| Module-wise count rates for Quadrant C Data is divided into 100 sec bins |
 |
 |
| Module-wise count rates for Quadrant D Data is divided into 100 sec bins |
 |
 |
| Parameter | Plot |
|---|---|
| CZT HV Monitor | 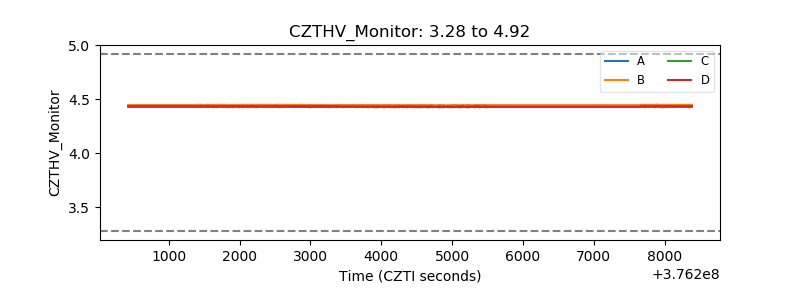 |
| D_VDD | 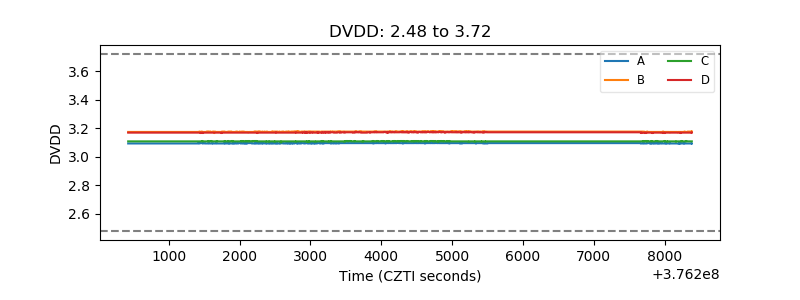 |
| Temperature 1 | 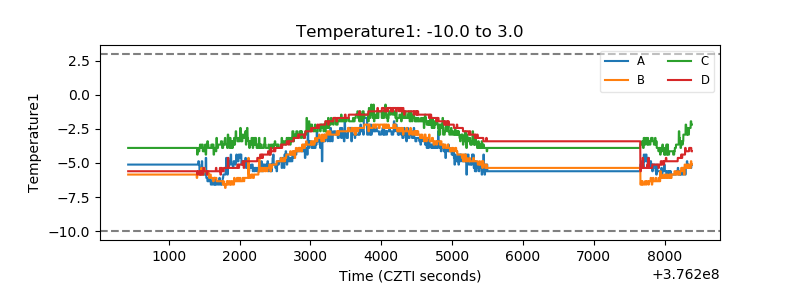 |
| Veto HV Monitor |  |
| Veto LLD | 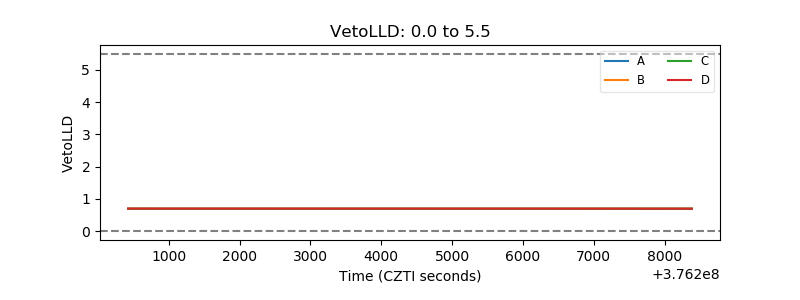 |
| Alpha Counter | 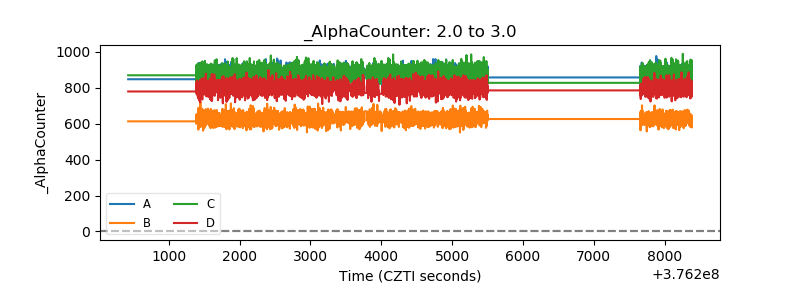 |
| _CPM_Rate | 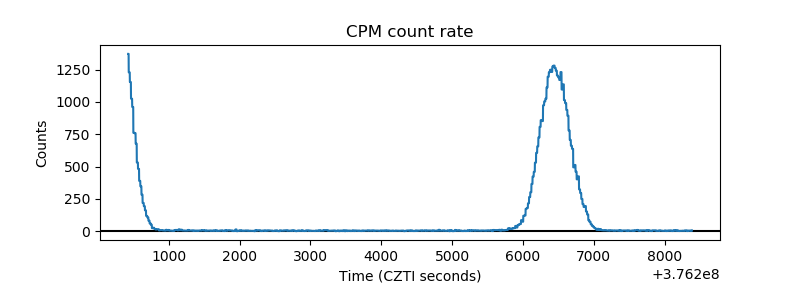 |
| CZT Counter | 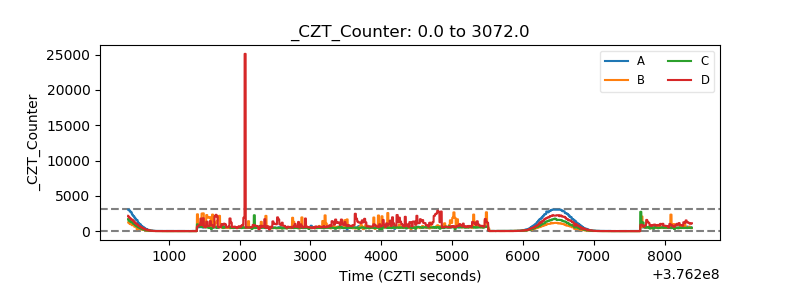 |
| +2.5 Volts monitor | 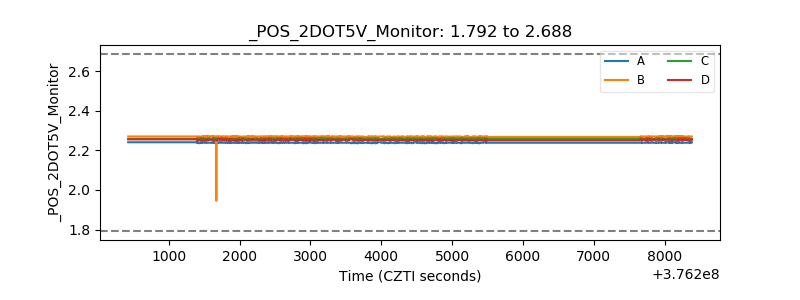 |
| +5 Volts monitor |  |
| _ROLL_ROT | 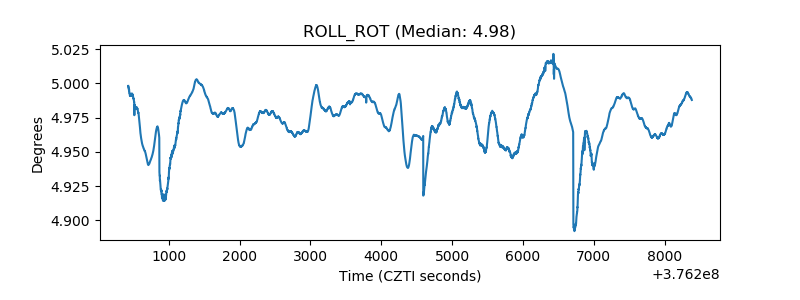 |
| _Roll_DEC | 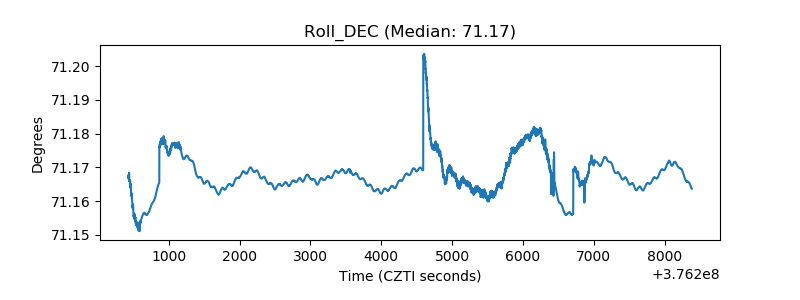 |
| _Roll_RA | 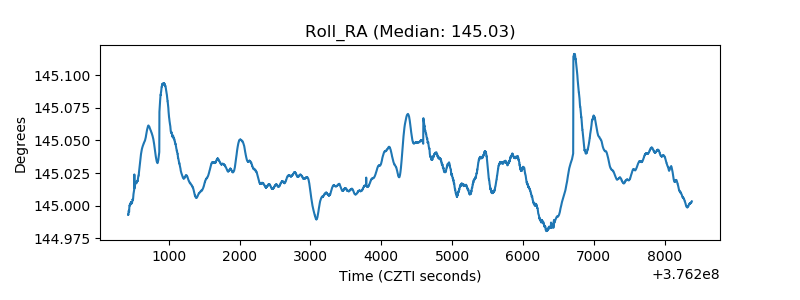 |
| Veto Counter | 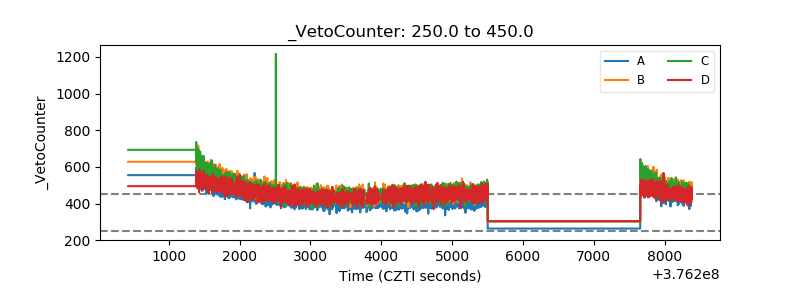 |