| Param | Original file | Final file |
|---|---|---|
| Filename | modeM0/AS1A11_046T04_9000004792_33425cztM0_level2.evt | modeM0/AS1A11_046T04_9000004792_33425cztM0_level2_quad_clean.evt |
| Size (bytes) | 432,512,640 | 86,832,000 |
| Size | 412.5 MB | 82.8 MB |
| Events in quadrant A | 2,627,080 | 588,939 |
| Events in quadrant B | 3,003,547 | 589,792 |
| Events in quadrant C | 2,636,293 | 570,582 |
| Events in quadrant D | 4,496,472 | 533,520 |
| Mode M0 | |||
|---|---|---|---|
| Quadrant | BADHDUFLAG | Total packets | Discarded packets |
| A | 0 | 10369 | 3 |
| B | 0 | 12035 | 2 |
| C | 0 | 10707 | 2 |
| D | 0 | 16914 | 2 |
| Mode M9 | |||
|---|---|---|---|
| Quadrant | BADHDUFLAG | Total packets | Discarded packets |
| A | 0 | 21 | 0 |
| B | 0 | 21 | 0 |
| C | 0 | 21 | 0 |
| D | 0 | 21 | 0 |
| Mode SS | |||
|---|---|---|---|
| Quadrant | BADHDUFLAG | Total packets | Discarded packets |
| A | 0 | 100 | 0 |
| B | 0 | 100 | 0 |
| C | 0 | 100 | 0 |
| D | 0 | 100 | 0 |
| Quadrant | Total seconds | Saturated seconds | Saturation percentage |
|---|---|---|---|
| A | 4946 | 4 | 0.080873% |
| B | 4946 | 91 | 1.839871% |
| C | 4946 | 33 | 0.667206% |
| D | 4947 | 130 | 2.627855% |
Noise dominated data is calculated using 1-second bins in cleaned event files. If a bin has >2000 counts, and if more than 50% of those come from <1% of pixels, then it is considered to be noise-dominated and hence unusable.
| Quadrant | # 1 sec bins | Bins with >0 counts | Bins with >2000 counts | High rate bins dominated by noise | Noise dominated (total time) | Noise dominated (detector-on time) | Marked lightcurve |
|---|---|---|---|---|---|---|---|
| A | 7068 | 4947 | 0 | 0 | 0.00% | 0.00% | 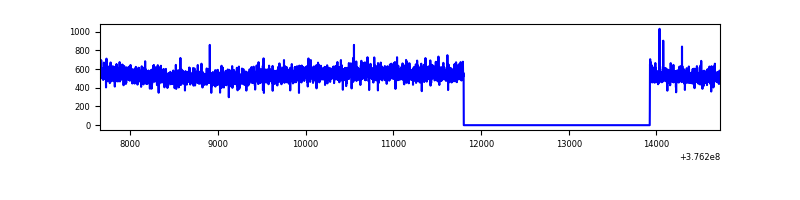 |
| B | 7068 | 4947 | 60 | 60 | 0.85% | 1.21% | 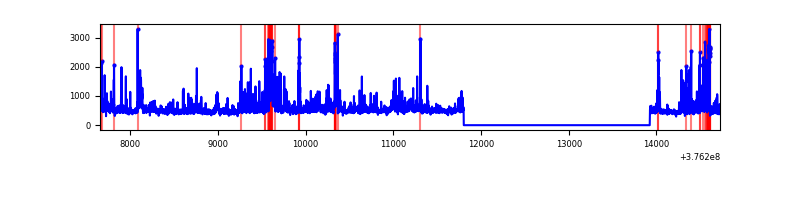 |
| C | 7068 | 4947 | 29 | 29 | 0.41% | 0.59% |  |
| D | 7069 | 4948 | 104 | 104 | 1.47% | 2.10% | 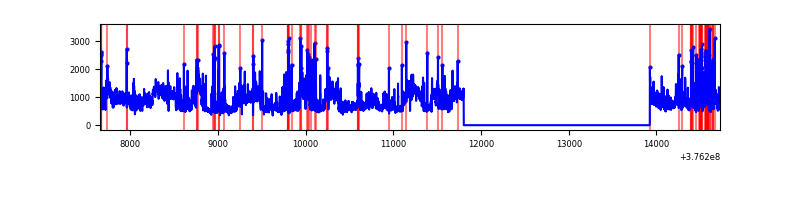 |
Top three noisy pixels from each quadrant. If the there are fewer than three noisy pixels in the level2.evt file, extra rows are filled as -1
| Pixel properties | Quadrant properties | ||||||
|---|---|---|---|---|---|---|---|
| Quadrant | DetID | PixID | Counts | Sigma | Mean | Median | Sigma |
| A | 15 | 47 | 344374 | 2962.56 | 588 | 579 | 116.0 |
| A | 13 | 254 | 9118 | 73.58 | 588 | 579 | 116.0 |
| A | 13 | 6 | 6714 | 52.87 | 588 | 579 | 116.0 |
| B | 5 | 172 | 337559 | 3116.01 | 577 | 563 | 108.1 |
| B | 5 | 255 | 231976 | 2139.74 | 577 | 563 | 108.1 |
| B | 0 | 213 | 95805 | 880.65 | 577 | 563 | 108.1 |
| C | 15 | 214 | 221608 | 1743.22 | 557 | 560 | 126.8 |
| C | 0 | 10 | 153191 | 1203.67 | 557 | 560 | 126.8 |
| C | 9 | 187 | 66397 | 519.2 | 557 | 560 | 126.8 |
| D | 8 | 195 | 1489994 | 11001.46 | 558 | 543 | 135.4 |
| D | 2 | 250 | 276273 | 2036.61 | 558 | 543 | 135.4 |
| D | 13 | 249 | 158965 | 1170.14 | 558 | 543 | 135.4 |
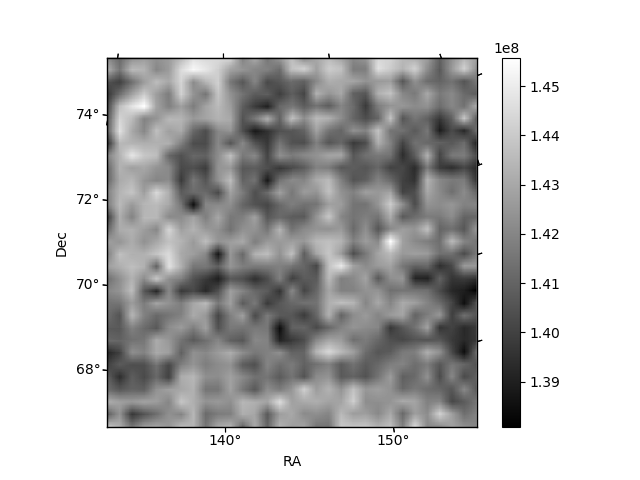
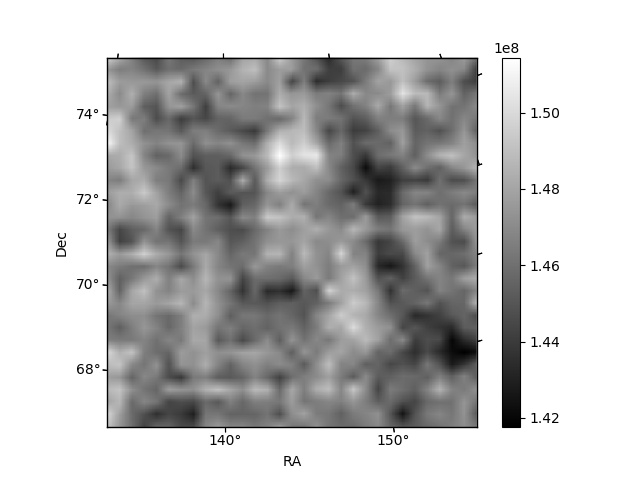
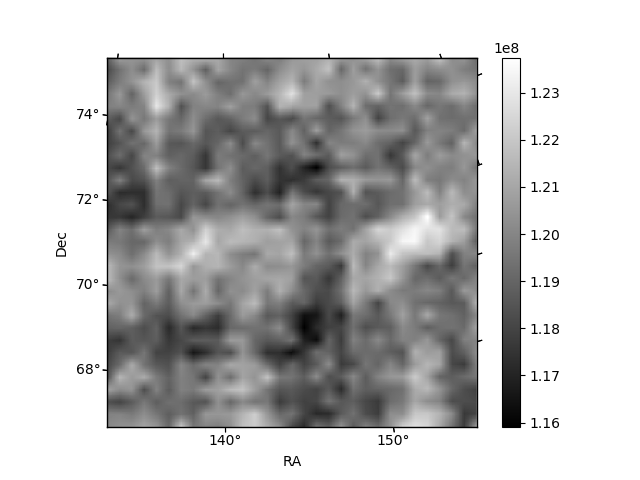
Histogram calculated using DETX and DETY for each event in the final _common_clean file
| Quadrant A | 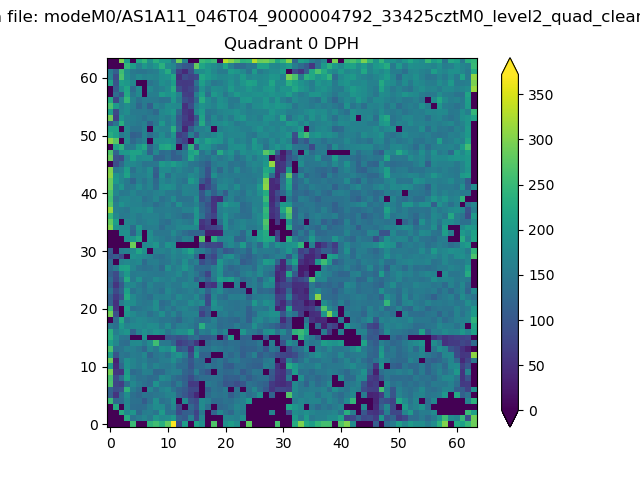 |
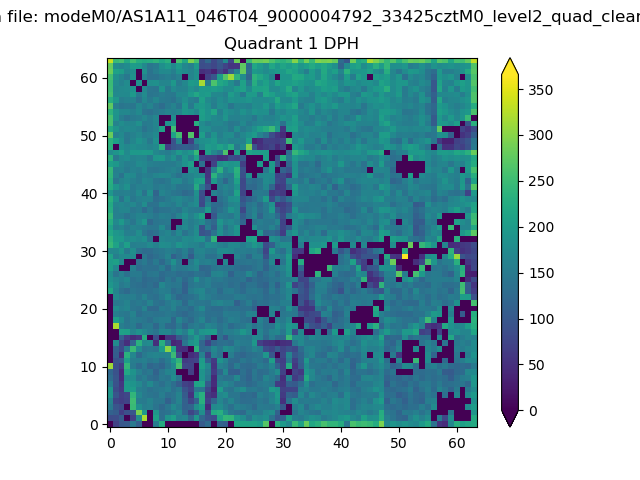 |
Quadrant B |
|---|---|---|---|
| Quadrant D |  |
 |
Quadrant C |
| Plot type | Count rate plots | Images |
|---|---|---|
| Comparison with Poisson distribution Blue bars denote a histogram of data divided into 1 sec bins. Red curve is a Poisson curve with rate = median count rate of data. |
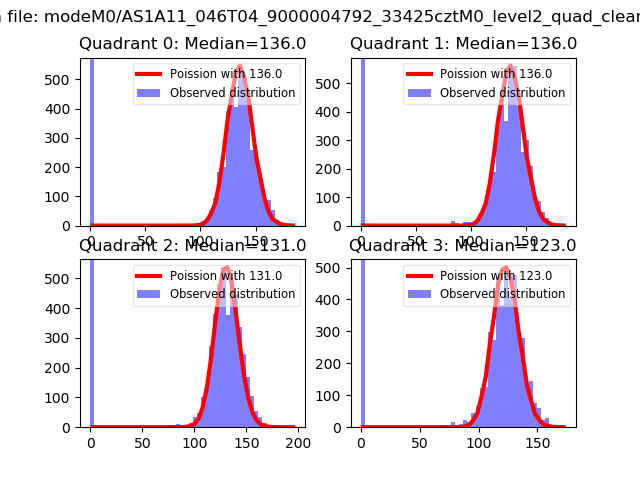 |
 |
| Quadrant-wise count rates Data is divided into 100 sec bins |
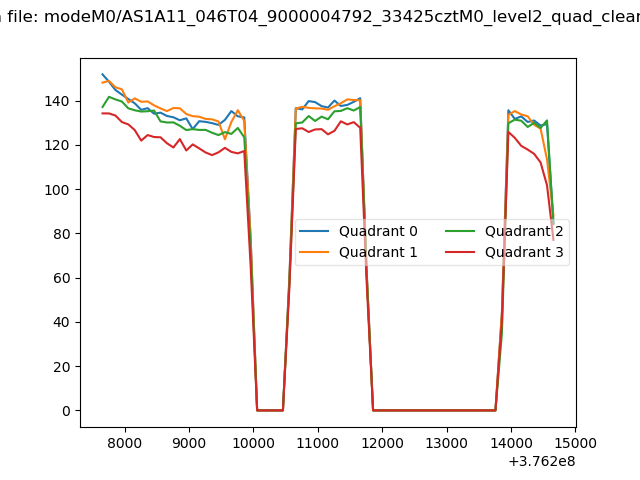 |
|
| Module-wise count rates for Quadrant A Data is divided into 100 sec bins |
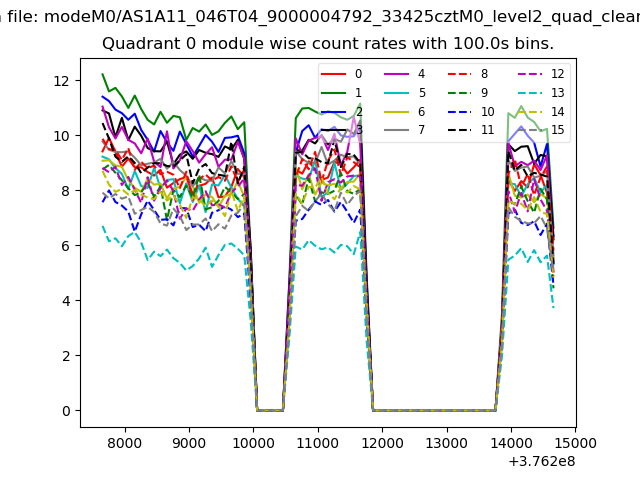 |
 |
| Module-wise count rates for Quadrant B Data is divided into 100 sec bins |
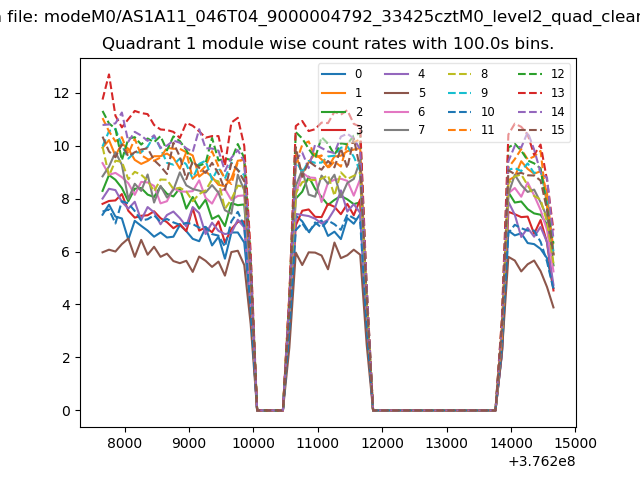 |
 |
| Module-wise count rates for Quadrant C Data is divided into 100 sec bins |
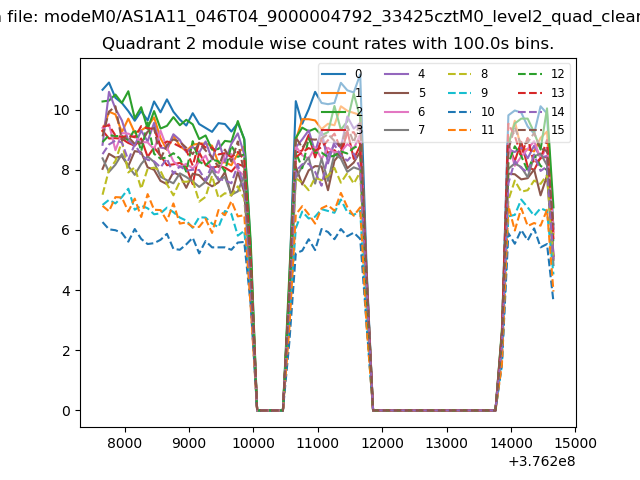 |
 |
| Module-wise count rates for Quadrant D Data is divided into 100 sec bins |
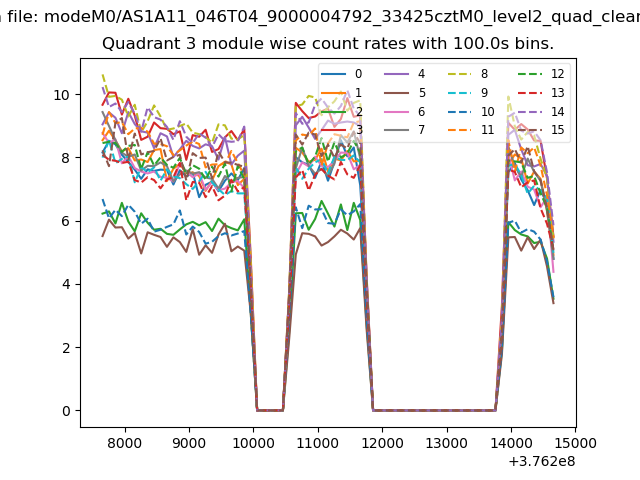 |
 |
| Parameter | Plot |
|---|---|
| CZT HV Monitor | 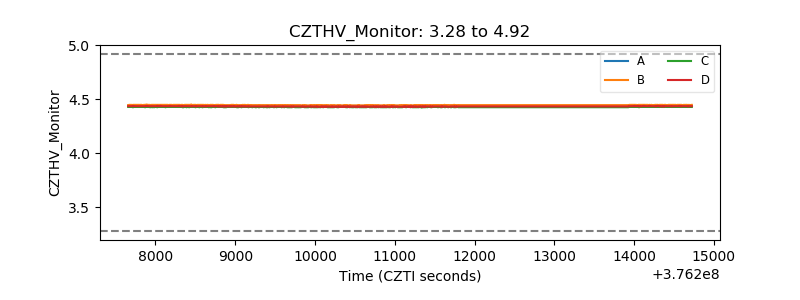 |
| D_VDD | 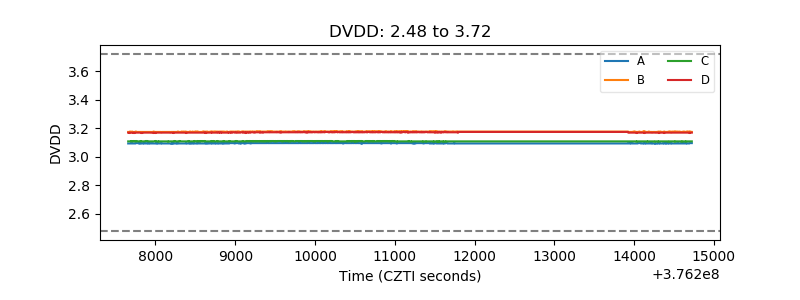 |
| Temperature 1 | 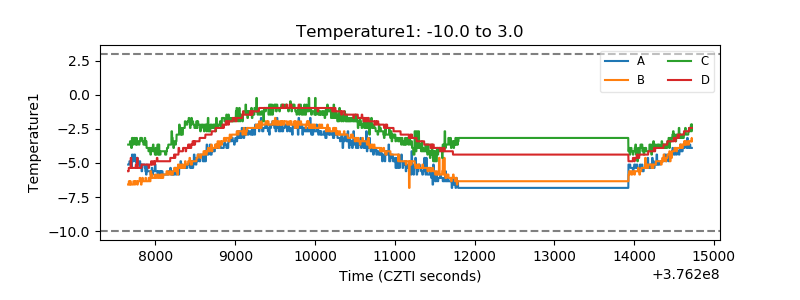 |
| Veto HV Monitor | 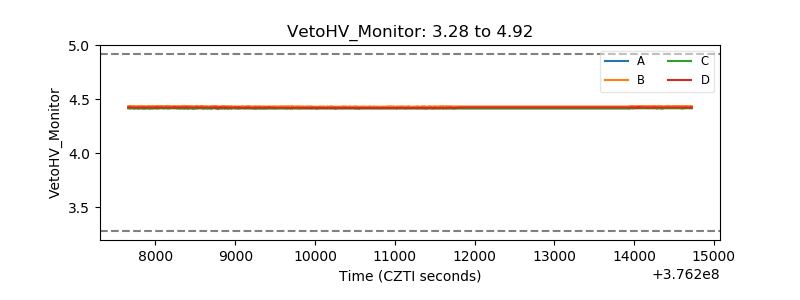 |
| Veto LLD | 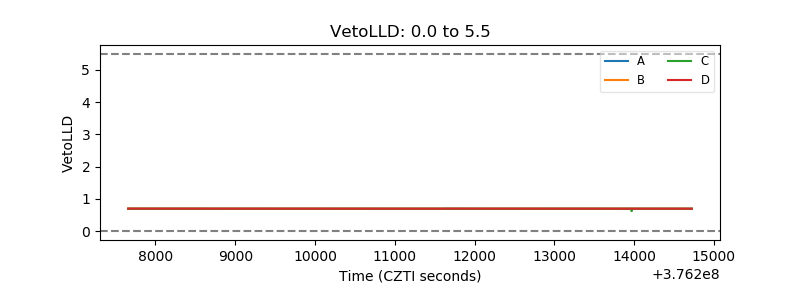 |
| Alpha Counter | 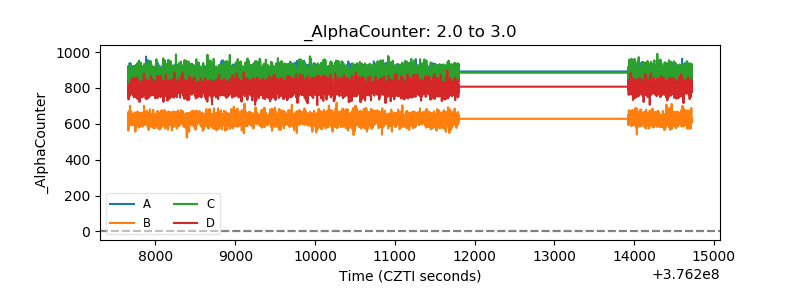 |
| _CPM_Rate | 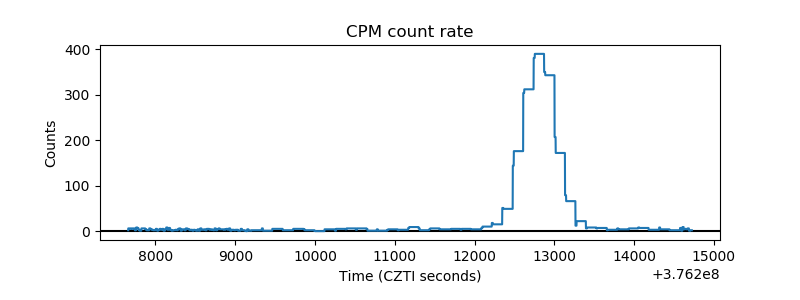 |
| CZT Counter | 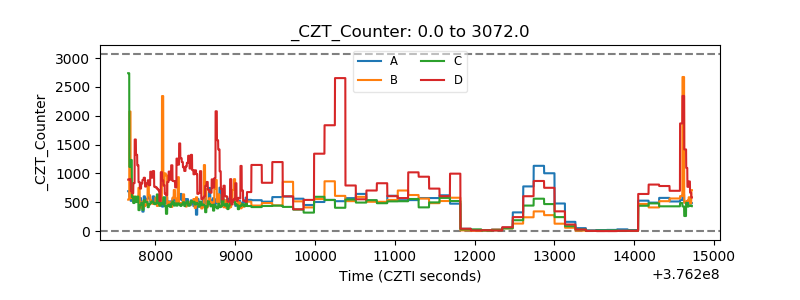 |
| +2.5 Volts monitor |  |
| +5 Volts monitor |  |
| _ROLL_ROT | 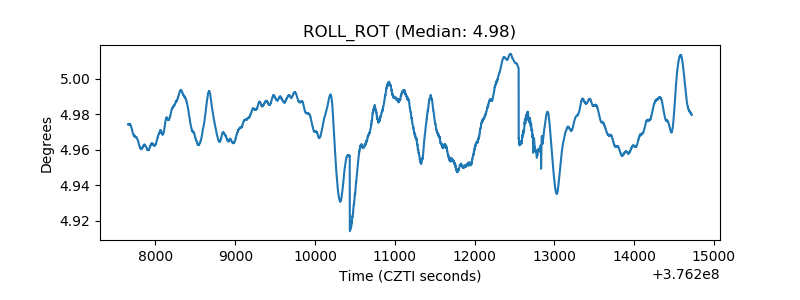 |
| _Roll_DEC | 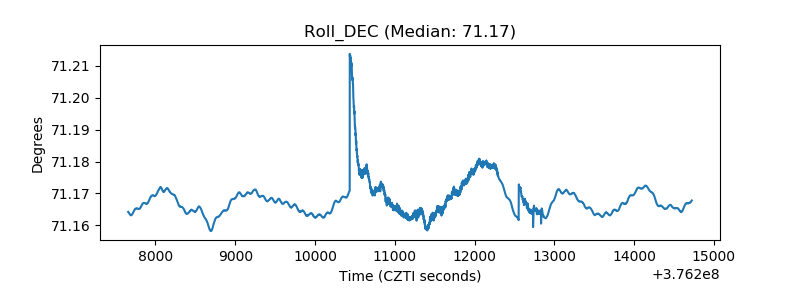 |
| _Roll_RA | 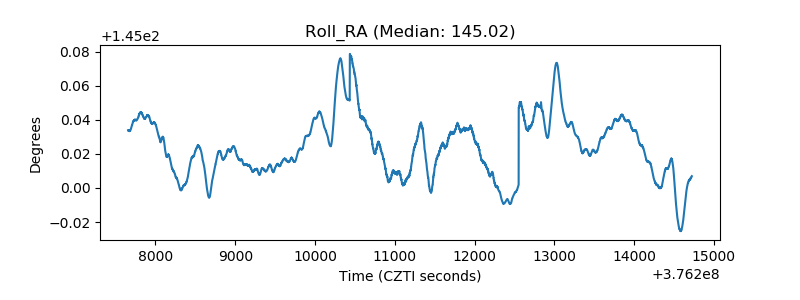 |
| Veto Counter | 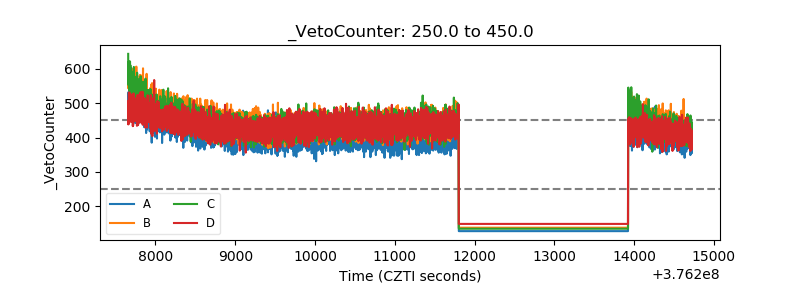 |